Oil & Gas Majors: Fact Sheets Royal Dutch Shell - August 2014
←
→
Page content transcription
If your browser does not render page correctly, please read the page content below
Oil & Gas Majors:
   Fact Sheets
   Royal Dutch Shell
                                                                August 2014

Oil & Gas Majors: Fact Sheets, Carbon Tracker Initiative 2014
About Carbon Tracker
The Carbon Tracker Initiative (CTI) is a team of financial specialists making climate
risk visible in today’s financial markets.
Our research to date on unburnable carbon and stranded assets has started a new
debate on how to align the financial system with the energy transition to a low carbon
future.
Contacts Team Members
James Leaton Jeremy Leggett, Non-executive Chairman
Research Director Mark Campanale, Founder and Executive Director
jleaton@carbontracker.org Anthony Hobley, Chief Executive Officer
www.carbontracker.org Jon Grayson, Chief Operating Officer
twitter: @carbonbubble James Leaton, Research Director
Luke Sussams, Senior Researcher
Andrew Grant Andrew Grant, Financial Analyst
Financial Analyst John Wunderlin, North America Staff Attorney
agrant@carbontracker.org Reid Capalino, Financial Analyst
www.carbontracker.org Margherita Gagliardi, Communications Officer
twitter: @carbonbubble Tracy Trainor, Office Manager
Disclaimer
CTI is a non-profit company set-up to produce new thinking on climate risk. The
organisation is funded by a range of European and American foundations. CTI is
not an investment adviser, and makes no representation regarding the advisability of
investing in any particular company or investment fund or other vehicle. A decision
to invest in any such investment fund or other entity should not be made in reliance
on any of the statements set forth in this publication. While the organisations have
obtained information believed to be reliable, they shall not be liable for any claims
or losses of any nature in connection with information contained in this document,
including but not limited to, lost profits or punitive or consequential damages. The
information used to compile this report has been collected from a number of sources
in the public domain and from CTI licensors. Some of its content may be proprietary
and belong to CTI or its licensors.
Oil & Gas Majors: Fact Sheets, Carbon Tracker Initiative 2014Royal Dutch Shell Key Points 1. Royal Dutch Shell (“Shell”) has indicated that capex will fall in 2014 compared to 20131. This appears sensible as its heavy spending over the past five years appears to have depressed group returns. Focusing on lower cost projects may could help reverse that deterioration. 2. We note that Shell announced in February 2014 it has decided to halt work on the Pierre River approval to focus on “more imminent” growth opportunities2. We believe this is sensible as the high capital intensity of Pierre River and its high break-even made it a project likely to destroy value in a low carbon environment. 3. However, several others including Carmon Creek and various deep water and ultra-deep water projects in the Atlantic are either under construction or being considered for approval. These projects all have market oil price requirements we regard as high and so could be value destroying in a low demand scenario. 4. Given that a significant proportion of Shell’s potential future production requires a market price of at least $95/bbl, investors may wish to look for similar announcements on the deferral or cancellation of other projects that may be proven uneconomic in a low demand scenario. Introduction CTI has demonstrated in its research the mismatch between continuing growth in oil demand and reducing carbon emissions to limit global warming. Our most recent research with ETA to produce the carbon cost supply curve for oil indicates that there is significant potential production that could be considered both high cost and in excess of a carbon budget. We have focused our research on undeveloped projects that, allowing for a $15/bbl contingency, would need a $95/bbl market price or above to be sanctioned (i.e. a market price required for sanction of $95/bbl is equivalent to a project breakeven price of $80/bbl), as they are the marginal barrels that could be exposed to a lower demand and price scenario in the future. This note examines Shell’s potential future project portfolio looking at production and capex using Rystad Energy’s UCube Upstream database (as at July 2014). “Capex” and “production” in this note (amongst other terms) are thus based on Rystad’s analysis and expectations of the company’s potential projects. Shell’s planned or realised capex and production may differ from these projections. Where possible we have sought to verify the status of the projects at the time of writing. 1 Shell presentation, Management Day in London, March 13, 2014, p20 http://s00.static-shell.com/content/dam/shell-new/local/corporate/corporate/downloads/pdf/investor/presentations/2014/ shell-analysts-2014-management-day-london-13032014.pdf 2 http://business.financialpost.com/2014/02/12/shell-halts-work-on-pierre-river-oil-sands-mine-in-northern-alber- ta/?__lsa=ab52-b2e1 Oil & Gas Majors: Fact Sheets, Carbon Tracker Initiative 2014 30
Royal Dutch Shell
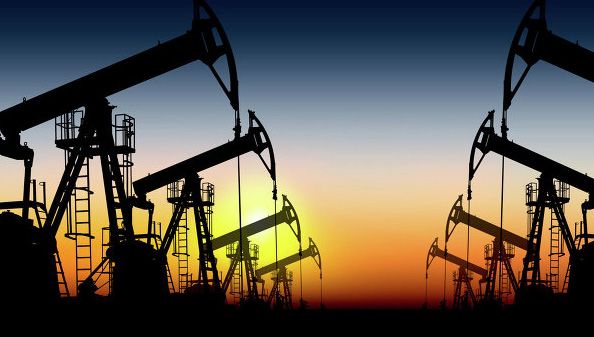
Potential future oil production
2014-2050 potential future oil production by required market price
200
Required market oil price ($/bbl)
180 30% of potential future production
160 (11.6bn bbls) will require $95/bbl+
140 market price
120
$95/bbl market price
100
80
60
40
20
0
0 5,000 10,000 15,000 20,000 25,000 30,000 35,000
Potential 2014 - 2050 Production (mmbbl)
Below US$75/bbl US$75-95/bbl US$95-115/bbl US$115-135/bbl US$135-165/bbl Above US$165/bbl
• Shell’s potential future project portfolio (2014-2050 production) exposes it to material risk
from lower oil prices, with 45% requiring a market oil price above $75/bbl for sanction and 30%
(11.6bn barrels) above $95/bbl, one of the highest proportions amongst majors.
• In the medium term, over the next decade, 16% of Shell’s production will need oil market
prices over $95/bbl for a commercial return (10% IRR).
• But by the end of 2025, projects requiring a market price of $95/bbl or more will have risen
to 36% of the company’s potential future production leaving Shell at greater risk from price or cost
volatility, especially in a low-carbon scenario.
Capex
• Turning to capital spend in the nearer term, on Rystad’s data, Shell has potential capex of
$327bn earmarked for oil projects during 2014-2025.
• Potential capex rises fairly steadily over the period, at an overall CAGR of 6.2%, (assuming
all project options are taken up). As such, Shell is likely to have to high-grade its projects to avoid a
loss of capital discipline.
• $120bn (37%) of the potential capital budget is on projects requiring at least $95/bbl for
sanction.
Potential capex by year by project required market
price
40,000
Potential capex (US$m)
30,000
20,000
10,000
0
2014 2015 2016 2017 2018 2019 2020 2021 2022 2023 2024 2025
N/A Less than US$75/bbl US$75-95/bbl
US$95-100/bbl US$100-105/bbl US$105-110/bbl
US$110-115/bbl US$115-135/bbl US$135-165/bbl
>US$165/bbl
31 Oil & Gas Majors: Fact Sheets, Carbon Tracker Initiative 2014Royal Dutch Shell
• Focusing on currently undeveloped future projects, of the $120bn of capex for projects
requiring a market price of $95/bbl or higher, $84bn (70%) is on projects that are yet to be developed.
• “Undeveloped” in this sense comprises fields where a discovery has been made (“discovery”
in the chart opposite) and where no discovery has been made (“undiscovered”)
• As high-cost, undeveloped projects, these could represent a focus for investors requiring cost
savings from the company, by being either cancelled or deferred.
Potential capex on $95/bbl+ market price projects
by life-cycle stage
16,000
Capex on currently undeveloped
14,000 projects that require $95/bbl+
market price may amount to
Potential capex (US$m)
12,000
$84bn in the medium term
10,000
8,000
6,000
4,000
2,000
0
2014 2015 2016 2017 2018 2019 2020 2021 2022 2023 2024 2025
Producing Under development Discovery Undiscovered
• Because of its size, Shell’s capex covers a diverse range of potential projects; 24% of capex
for undeveloped projects requiring at least $95/bbl is on deep water and 26% on ultra-deep water
projects, with 18% for conventional projects (onshore and continental shelf).
• Oil sands (mining) and Oil sands (in-situ) account for 21% and 7% respectively of the
potential budget.
• Under Rystad’s classification of projects, Shell’s major Arctic project – in the Chukchi Sea
– is listed as a gas project by Shell, although it is likely to require oil production in order to make it
economically viable. This project is not included in the Arctic numbers shown here.
Potential capex on undeveloped $95/bbl+ market price
projects by category
20,000
Potential capex (US$m)
Ultra deep water projects account
for 26% of potential capex on new
developments requiring $95/bbl+
10,000 market price in the medium term
0
2014 2015 2016 2017 2018 2019 2020 2021 2022 2023 2024 2025
Conventional (land and shelf) Arctic Deep water (125-1500m)
Ultra deepwater (1500m+) Oil sands (mining) Oil sands (in-situ)
Shale oil Extra heavy oil Tight liquids plays
Oil & Gas Majors: Fact Sheets, Carbon Tracker Initiative 2014 32Royal Dutch Shell
Highest risk undeveloped projects
Potential capex on undeveloped projects requiring $95/bbl+ market price
15,000
Potential capex (US$m)
10,000
5,000
0
2014 2015 2016 2017 2018 2019 2020 2021 2022 2023 2024 2025
Athabasca Oil Sands Project, CA Pierre River, CA Bosi, NG Bonga, NG
Khazar, KZ Yucatan, US Carmon Creek, CA Bobo (OPL 322), NG
Bolia, NG Gato do Mato, BR Aktote, KZ JK (G) (OML 74), NG
Vicksburg, US Parque dos Doces, BR Loyal, GB Others
69% of the $84bn potential capex on higher-cost new development attributable to the 15 largest
discovery stage projects. These top 15 have individual capex requirements ranging from c.$1.9bn to
c.$10.8bn. The market oil prices required for sanction of these projects are shown below.
Some of the projects the below table are not yet on Shell’s list of likely developments and so may be
deferred to avoid value destruction.
% of total capex on Required
2014-2025 % of total 2014- undeveloped projects market
Rank Name Country Region capex* Category
2025 capex requiring $95/bbl price** Status***
($m) (%) (%) ($/bbl)
1 Pierre River, CA Canada Alberta, CA Oil sands (mining) 6,543 2% 8% 158 - 162 Deferred
2 Carmon Creek, CA Canada Alberta, CA Oil sands (in-situ) 3,429 1% 4% 157 Approved
3 Khazar, KZ Kazakhstan Caspian Sea, KZ Conventional (land/shelf) 4,142 1% 5% 129 Not disclosed
4 Bosi, NG Nigeria Atlantic Ocean, NG Deep water 6,133 2% 7% 126 Under study
5 Gato do Mato, BR Brazil Rio de Janeiro, BR Ultra deepwater 2,218 1% 3% 121 Under study
6 Loyal, GB United Kingdom Atlantic Ocean, GB Deep water 1,625 0% 2% 121 - 127 Under study
7 Aktote, KZ Kazakhstan Atyrau, KZ Conventional (land/shelf) 2,191 1% 3% 116 Not disclosed
8 Bonga, NG Nigeria Atlantic Ocean, NG Deep water 5,588 2% 7% 115 Under development/study
9 Parque dos Doces, BR Brazil Espirito Santo, BR Ultra deepwater 1,902 1% 2% 111 - 121 Not disclosed
10 Vicksburg, US United States Gulf of Mexico deepwater, US Ultra deepwater 2,141 1% 3% 110 Under study
11 Bolia, NG Nigeria Atlantic Ocean, NG Deep water 2,711 1% 3% 108 Not disclosed
12 Yucatan, US United States Gulf of Mexico deepwater, US Ultra deepwater 3,586 1% 4% 99 Under study
13 Athabasca Oil Sands Project, CA Canada Alberta, CA Oil sands (mining) 10,799 3% 13% 96 - 118 Ongoing
14 Bobo (OPL 322), NG Nigeria Atlantic Ocean, NG Ultra deepwater 3,074 1% 4% 96 Not disclosed
15 JK (G) (OML 74), NG Nigeria Atlantic Ocean, NG Conventional (land/shelf) 2,141 1% 3% 96 Not disclosed
- Total Top 15 Discoveries - - 58,223 18% 69% - -
- Other projects - - 25,798 8% 31% - -
- Total - - 84,021 26% 100% - -
* company share of capex requiring $95/bbl+ shown only
** market price required for sanction includes $15/bbl contingency on top of project breakeven price
*** as understood based on company disclosures
Questions Arising
1. Should Shell further reduce its oil sands exposure, following the shelving of Pierre River?
2. Will the deep water/ultra-deep water projects being considered by Shell be good value if cost
increase and oil prices don’t rise –can they provide a sensitivity analysis?
3. Does it makes sense to continue to waste capital on the Chuckchi Sea interest?
33 Oil & Gas Majors: Fact Sheets, Carbon Tracker Initiative 2014For further information about Carbon Tracker please visit our website www.carbontracker.org Oil & Gas Majors: Fact Sheets, Carbon Tracker Initiative 2014
You can also read