Company presentation and investment story - Avanza Investor ...
←
→
Page content transcription
If your browser does not render page correctly, please read the page content below
May 2021

Company presentation
and investment story
Overview

    Avanza’s evolution
    since foundation in 1999

2
Overview

    Sweden’s leading platform
    for savings and investments

                                                                           SEK 688 bn
                                                                           in savings
                                                               1,471,900
                     No. 1 long-term target to have the
                                                                           capital
               most satisfied savings customers in Sweden –
                  won for the last 11 consecutive years
                                                              customers

                 526
                                                              market share of the
               employees and
                 eNPS of

                   69
                                                5.8%          Swedish savings market

3
Overview
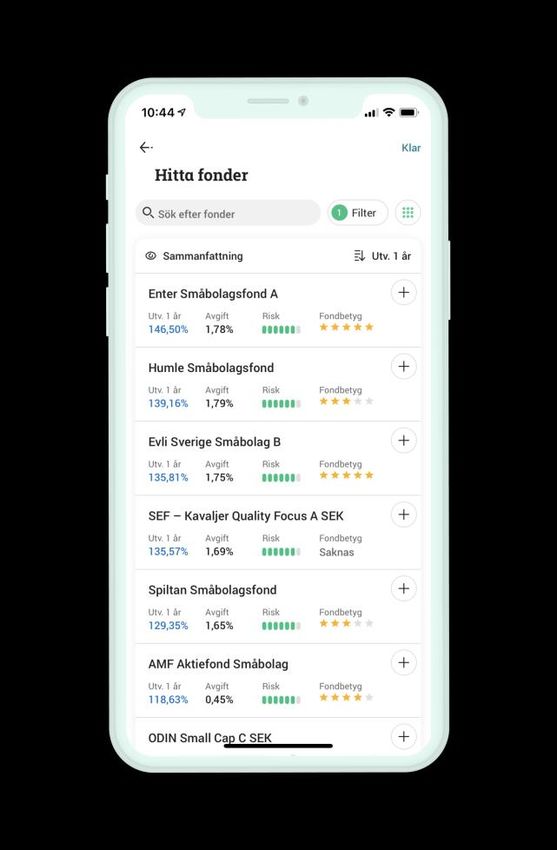
Over 60 000 investment opportunities, together with
decision-making tools, inspiration and education
Securities Mortgages and
trading Retirement plans margin lending
Mutual funds Savings accounts
4
Overview

    We focus on decision-making
    tools for our customers

         o     The Avanza Academy
         o     The Avanza blog, podcasts and Avanza Play
         o     Auto funds
         o     Portfolio generator
         o     Stock generator
         o     Independent news site Placera

5
Overview

    Capital light, fee-based business model

               2020                                         % of
                                                            income
               Net brokerage income                                47                o   Mainly fixed costs, ~70% staff related

               Fund commissions                                    18                o   High scalability

               Net interest income                                 12                o   Self-financed through shareholders’ equity and customer
                                                                                         deposits
               Other income 1)                                     23

               Total                                              100

           1) Mainly currency-related income, but also income from Avanza Markets,
           Corporate Finance, compensation for distribution, advertising sales,
           subscriptions and customer’s ad-on services.

6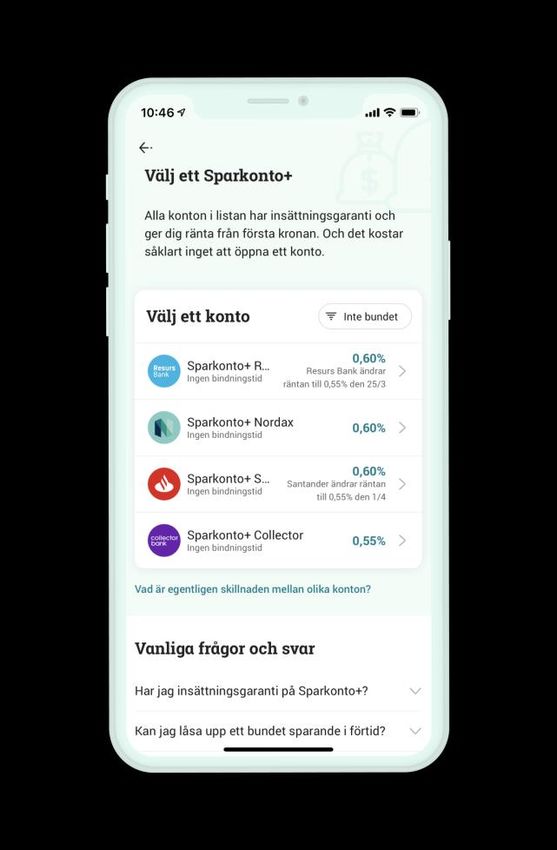
Overview

    Business model built on scale

                      160                                                                                                700 000
                            142

                                                                                                                                   Savings capital, SEK m
                      140                                                                                                600 000
                      120
                                                                                                                         500 000
       Basis points

                      100
                                                                                                                         400 000
                            73
                      80
                                                                                                                    63   300 000
                      60
                                                                                                                         200 000
                      40
                      20                                                                                                 100 000
                                                                                                                    13
                       0                                                                                                 0
                            2004 2005 2006 2007 2008 2009 2010 2011 2012 2013 2014 2015 2016 2017 2018 2019 2020 2021
                                                                                                                  3m
                                      Savings capital         Income/savings capital         Cost/savings capital

7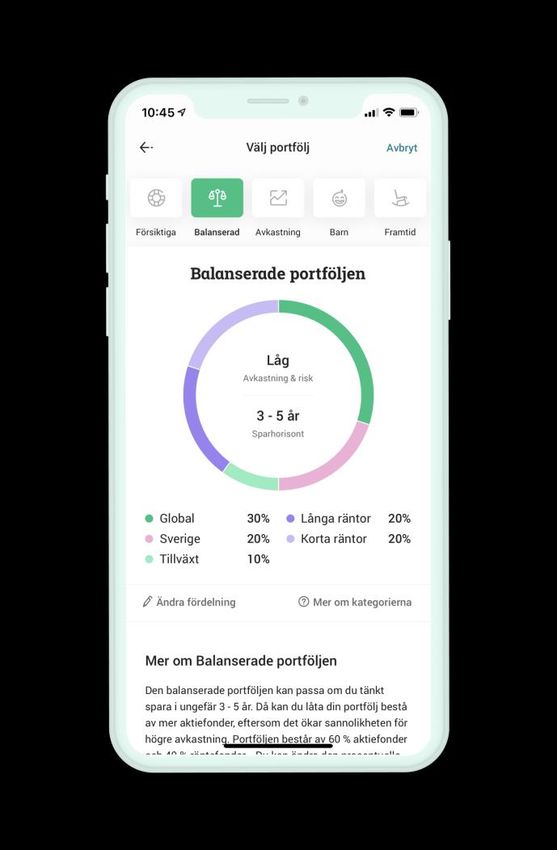
Overview

We focus on what’s best
for the customer
Overview

     A typical Avanza development team,
     where business and IT go hand in hand

                                                                     Product           QA
                                                                    specialist                      Front-end
        o      Full expertise for their respective domain

        o      Innovation, business development and maintenance
                                                                   UX                                    Front-end
               are done within each team

        o      They define their own mission and sets their own                    Product owner

               goals, linked with the overall vision and targets
                                                                        Designer                   Back-end

                                                                                     Back-end

9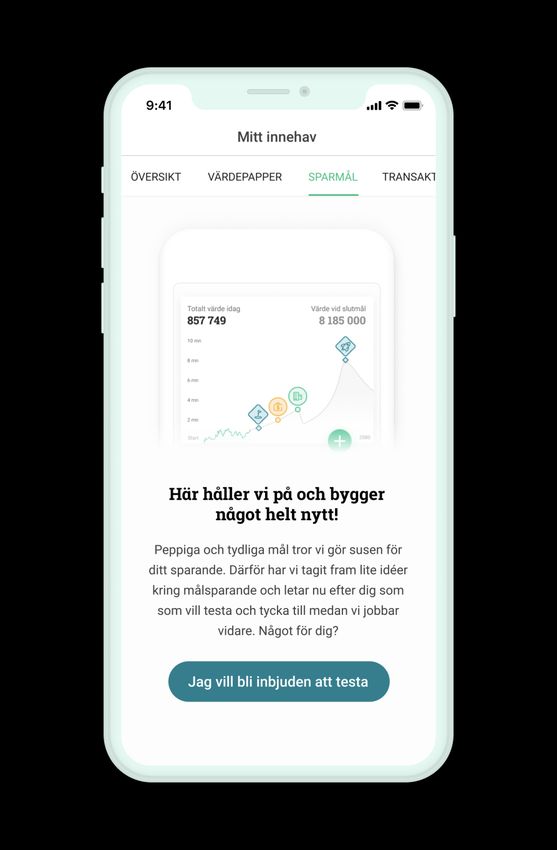
Overview

We innovate together                                          “Feedback Buddy”
                                                           Our feedback system keeps

with our customers                                          our development teams
                                                            close to the customers.

     Customers can sign up as test users to early
     releases of new functionality and provide
     feedback.

     We meet with hundreds of customers for
     interviews and user tests each year.

     And get, tens of thousands of twitter feedback, app
     reviews and customer service messages, which                                  Beta experience
     are also a vital part of the development feedback
                                                                               Customers can sign up for
     to the teams.
                                                                              beta functionality inside the
                                                                              app. This is an example of a
                                                                                beta experience for goal
                                                                                 savings functionality.
Overview
User experience, information and tools
increasingly important
NPS
67
Daily active users 500,000
11Overview
Our superior customer experience, also makes us
the perfect partner for product challengers
Mutual fund platform
Mortgages
Over 1,300 external funds
Our partners deliver low Exchange traded products
on the platform and Third party savings
exclusive cooperations for interest mortgages through Exclusive exchange traded
High yielding savings our interface.
actively managed funds. products with 0 brokerage
accounts with a number of
fees
partner banks.
1213
New customers
Overview
60 000
20 000
40 000
80 000
0
100 000
120 000
140 000
160 000
180 000
Q1-13
Q2-13
Q3-13
Q4-13
Q1-14
Q2-14
Q3-14
Q4-14
Q1-15
Q2-15
Q3-15
Q4-15
Q1-16
Q2-16
Q3-16
Q4-16
Q1-17
Customer inflow
Q2-17
Q3-17
Q4-17
Customer growth drives net inflow
Q1-18
Net inflow
Q2-18
Q3-18
Q4-18
Q1-19
Q2-19
Q3-19
Q4-19
Q1-20
Q2-20
Q3-20
Q4-20
Q1-21
0
5 000
30 000
35 000
10 000
15 000
20 000
25 000
Net inflow, SEK mPosition
Market share of 19.0% rolling 12M of net
savings on the Swedish savings market
30%
Swedish savings market
Net inflow
Net inflow, R12 m
25%
Avanza market share, %
20% Target 2025 to
19.4% reach at least
19.0% 15% R12 m
15%
10%
Target 2025 to
reach nearly 7%
5.8%
5%
1.9%
0%
Q1-13
Q2-13
Q3-13
Q4-13
Q1-14
Q2-14
Q3-14
Q4-14
Q1-15
Q2-15
Q3-15
Q4-15
Q1-16
Q2-16
Q3-16
Q4-16
Q1-17
Q2-17
Q3-17
Q4-17
Q1-18
Q2-18
Q3-18
Q4-18
Q1-19
Q2-19
Q3-19
Q4-19
Q1-20
Q2-20
Q3-20
Q4-20
14Position
Significant growth potential with a 5.8%
market share of the Swedish savings market
Capital on the savings market
SEK 3,573 bn 1) Avanza's share
SEK 2,231 bn o The Swedish savings market
SEK 9,894 bn
o Annual market growth of on
SEK 1,510 bn SEK 1,419 bn
average 8% last ten years
SEK 1,162 bn o An estimated 80% of the
Swedish population saves in
funds and around 20% own
shares
10.3% 1.0% 6.4%
1.0% 3.0% 17.7%
Individual pensions & Occupational pensions & Deposits/savings accounts Mutual funds Shares, bonds and other
insurances insurances securities
1) The occupational pension market can be divided into traditional life and unit-linked insurance. Unit linked amounts for about a third, of which
15 Avanza is active in the portion outside collectively agreed occupational pensions, which is valued at nearly SEK 820 billion.Position
The largest Swedish participant in stock market
transactions and turnover on Nasdaq OMX and First North
o Market share of 20.7% in terms of transactions and 9.2% of turnover in Q1 2021
Transactions Turnover
25 10
9
20 8
7
15 6
Market share, %
5
10 4
3
5 2
1
0 0
Q2-17
Q1-15
Q2-15
Q3-15
Q4-15
Q1-16
Q2-16
Q3-16
Q4-16
Q1-17
Q3-17
Q4-17
Q1-18
Q2-18
Q3-18
Q4-18
Q1-19
Q2-19
Q3-19
Q4-19
Q1-20
Q2-20
Q3-20
Q4-20
Q1-21
Q3-15
Q1-15
Q2-15
Q4-15
Q1-16
Q2-16
Q3-16
Q4-16
Q1-17
Q2-17
Q3-17
Q4-17
Q1-18
Q2-18
Q3-18
Q4-18
Q1-19
Q2-19
Q3-19
Q4-19
Q1-20
Q2-20
Q3-20
Q4-20
Q1-21 Avanza Nordea Swedbank SEB
SHB Carnegie Nordnet SkandiabankenPosition
Age distribution among new customers
Market penetration
4,0
o Total share of Swedish
population: 11.5% as of
3,5 1 November 2020
o ages 20-29: 20.8%
3,0 o ages 30-39: 22.1%
2020 o ages 40-49: 16.5%
Share, %
2,5 2012
2007 o Highest penetration in urban
2,0 areas. Stockholm region,
snapshot (Women/Men) as
of 1 November 2020:
1,5
o ages 20-29: 21%/31%
o ages 30-39: 24%/34%
1,0
o ages 40-49: 18%/27%
o ages 50-59: 15%/20%
0,5
o ages 60-69: 11%/15%
0,0
42
87
0
3
6
9
12
15
18
21
24
27
30
33
36
39
45
48
51
54
57
60
63
66
69
72
75
78
81
84
90
93
96
99
Age
17Growth drivers
Potential in both existing and new customers
o Increasing share of wallet in existing customer base
o Continue to attract young people and keep them happy as wealth grow
by age
o The broad offering makes us relevant for a larger group of people
o Digital onboarding with BankID has removed friction to move
o Increasing digitisation and Open Banking functionality creates more
awareness, simplifies self-directed financial management
o More reasons for customers to take responsibility for their own savings
as public pension and welfare systems are covering fewer needs
o Growing focus on sustainable investments
o TINA in current low interest rate environmentGrowth potential
Savings capital grow by age
4,0% 1,6
3,5% 1,4
Savings capital, SEK m
3,0% 1,2
Customers, %
2,5% 1,0
2,0% 0,8
1,5% 0,6
1,0% 0,4
0,5% 0,2
0,0% 0,0
0 3 6 9 12 15 18 21 24 27 30 33 36 39 42 45 48 51 54 57 60 63 66 69 72 75 78
Age
Savings capital by age Total customer base
1920
0,0%
0,5%
1,0%
3,0%
3,5%
1,5%
2,0%
2,5%
18 years
Growth potential
21 years
24 years
27 years
30 years
33 years
36 years
next generation
39 years
Avanza 38
Median age
42 years
45 years
48 years
Sweden 48
Median age
51 years
54 years
Sweden
57 years
60 years
63 years
Avanza
66 years
69 years
Age distribution Swedish population and Avanza’s customers
72 years
75 years
78 years
81 years
84 years
87 years
90 years
93 years
96 years
Strong potential when wealth is transferred to the
99 yearsGrowth potential
One of the fastest growing pension companies
in Sweden
o Competitiveness with no annual insurance fees and broad investment opportunities
o The strong offer an advantage when the transfer right is improved to the benefit of 1.0 %
the consumer
45 000
40 000
Savings capital, SEK m
35 000
30 000
25 000
20 000
15 000
10 000
Swedish pension market
SEK 3,573 billion1)
5 000
0
2006 2007 2008 2009 2010 2011 2012 2013 2014 2015 2016 2017 2018 2019 2020 2021
Q1
1) The occupational pension market can be divided into traditional life and unit-linked insurance. Unit linked amounts for about a third, of which Avanza is
21 active in the portion outside collectively agreed occupational pensions, which is valued at nearly SEK 820 billion.Growth potential
Enable customers to apply for mortgages
from various external lenders
o Important part of customers economy
o Frees up savings capital with other banks 0.6 %
30 000
25 000
Volume, SEK m
20 000
15 000
10 000
5 000
Swedish mortgage market
0 SEK 3 641 billion
2013 2014 2015 2016 2017 2018 2019 2020 2021 Q1
Avanza Private Banking mortgages External mortgages
22Growth potential
We are prepared to capture new
opportunities in the world of tech…
Mortgages are Credit transfers Payment accounts can be
signed digitally. between banks are aggregated, and payments
made in real-time. initiated, by any interface.
Customers have the
Pension accounts can Data from all financial products
right to data portability.
finally be transferred can be easily shared with third
cheaply parties by customer consent.
23To summarise
Customer satisfaction and employee
engagement create shareholder value over time
Long-term targets Customer proposition
o Customer satisfaction & Employee engagement o Cheaper, better and simpler offering
o Growth in customers and savings capital o High user experience
o Profitability and effective management of the o Broad range of product
balance sheet o Information, education and decision-making tools
Business model Growth potential
o More stable revenues through funds and mortgages
o Strong potential in existing customer base
o High scalability
o Young customers a potential when wealth is transferred
o Cost control vital (top modern IT platform)
o Public pension and welfare systems are covering fewer needsTo summarise
Employee engagement a key
success factor for Avanza
Long-term targets Continuous growth
o Customer satisfaction – keep the No 1 position
o Continuous growth in both number of customers and volume
o Create possibilities for continued strong innovation
Customer satisfaction
Strong innovation
25Appendix
Operations 27
Financials 28-33
Balance sheet data 34-35
Contact details 36
26Targets and fulfillment 2020
Long-term targets Outcome 2020 Comments
Sweden’s most satisfied savers according to the
√ Achieved in 2020 for the eleventh consecutive year
Swedish Quality Index
Engaged employees, eNPS of at least 45, raised to at
69 Record-strong ambassadorship
least 50
Market share of least 15 per cent
R 12M of the total net inflow to the Swedish savings 19% Almost every fifth savings krona ends up on the Avanza platform
market 2025
Market share of 7% 2025 5.8% Well on track to achieve the target
Return on equity of 25-30% 57% Ensures focus on profitability and effective management of the balance sheet
The dividend for 2020 was SEK 0.85 per share, in line with the FSA's recommendation
Dividend of at least 70% 10%
due to the Covid-19 pandemic. The assessment is, there is still room to distribute more
Increased share of capital in sustainable
√ A lot of improvements done during the year to make it easier to save sustainably
investments
Be regarded as the leading sustainable brand and
√ Regarded as the financial company in Sweden with the highest reputation (Kantar Sifo)
the natural choice for sustainable savings
Increase share of new female customers to 50% 39% Not achieved despite record high number on new female customers
Organisation with parity between women and men 47% Measured in Group Management and among employees with personnel responsibility
The year’s emissions amounted to 263 tonnes CO2e and climate offsets for the total
Become climate positive √
emissions was purchased
27Financial overview
Q1 21 Q4 20 ∆% Q1 20 ∆% 2020 2019 ∆%
Operating income, SEK m 957 706 36 542 77 2,349 1,193 97
Operating expenses, SEK m -202 -221 -8 -179 13 -763 -666 15
Operating profit, SEK m 756 486 56 361 109 1,576 520 203
Operating margin, % 79 69 10 67 12 67 44 24
Income to savings capital ratio, % 0.63 0.52 0.10 0.56 0.07 0.51 0.34 0.17
Costs to savings capital ratio, % 0.13 0.16 -0.03 0.18 -0.05 0.17 0.19 -0.02
ROE, % 74 58 16 64 9 57 27 30
EPS, SEK 4.08 2.70 51 1.98 106 8.66 2.94 195
28Long-term revenue development
3 000
2 500
2 286
2 000
Revenue, SEK m
1 500
1 193
975 1 049
1 000 909
500
0
2016 2017 2018 2019 2020
Total income Income from sales of shares in Stabelo Net brokerage income
Income from mutual funds Net interest income Other income
29Income split 3M 2021
SEK m % of
income
Shares, bonds, options 439 46
(transactions)
Mutual funds 150 16
1)
Net interest income 76 8
2)
Other 291 30
Total 957 100
1) Based on deposits.
2) Mainly currency-related income, but also income from Avanza Markets, Corporate Finance, compensation for distribution, advertising sales,
subscriptions and customer’s ad-on services.
30Annual cost development
800
734
700
657
600 594
535
Operating expenses, SEK m
500
443
400
300
200
100
0
2016 2017 2018 2019 2020
Total expenses Non-reccuring items Personnel Marketing Depreciation Other expenses
31Costs 3M 2021
SEK m % of total costs
Personnel -137 68
IT systems and licenses -23 12
External services -19 9
Marketing -9 5
Depreciation -17 8
Other1) 3 -1
Total costs before credit losses -202 100
Credit losses, net2) 1
1) Including one-off reversed write-down of SEK 10 million.
2) Reported credit losses are attributable to calculations of expected credit losses according to IFRS9.
32Operating margin at extreme levels
1 800 100
1 576 90
1 600
1 400 80
Operating profit, SEK m
Operating margin, %
70
1 200
60
1 000
50
800
40
600 520
465 441 30
418
400 20
200 10
0 0
2016 2017 2018 2019 2020
Operating profit Operating margin
33Balance sheet, 31 March 2021
Assets SEK m Liabilities & equity SEK m Comments
Lending to credit 6,547 Deposits 48,765 o Mainly self-financed through
institutions1) shareholders’ equity and
customer deposits
Lending to the public 18,327 Liabilities in insurance 179,688
operations o Surplus-liquidity of SEK 33,213m
invested in covered bonds, at
Bonds 25,087 Other liabilities 1,900 the Riksbank and O/N (including
SEK 1,579m deposits in client
Assets in insurance 179,686 Shareholders’ equity 3,670 fund accounts)
operations
o The value of the insurance
Other assets 4,376 liabilities tracks the value of the
insurance assets since the
Total assets 234,022 Total liabilities and 234,022 policyholders bear the direct
shareholders’ equity investment risk. No products
with guaranteed return is offered
1) Including balances at central banks and treasury bills eligible for refinancing.
34Strong capital position with additional distribution power
after dividend pay-out
31 March 31 December
2021 2020
Total capital requirement, %1) 13.4 13.5
Capital requirement buffer, % 10.5 10.9
Total capital ratio, % 23.9 24.4
Leverage ratio,%2) 4.3 4.9
Additional distribution power for 2020, 2.95 SEK/share, SEK m 457
1) Including external buffers and Pillar 2 requirements.
2) Requirement of 3%, as of June 2021. Q1 results not included.
35Updated 4 May 2021
Historical financial key data 2001 – Q1 2021
is available in Excel at: avanza.se/keydata
sofia.svavar@avanza.se
+46 8-409 420 17
36You can also read


