RISI International Containerboard Conference| 2018 - The European Containerboard Market - Events

Page created by Virgil Allen
 
CONTINUE READING
RISI International Containerboard Conference| 2018 - The European Containerboard Market - Events
RISI
International Containerboard Conference| 2018

The European Containerboard Market
Florian Stockert
November 2018
RISI International Containerboard Conference| 2018 - The European Containerboard Market - Events
Mondi is a global leader in packaging and paper

                                                                           26,000 employees

                                                                           Over   100 operations across more than 30 countries
    The image part with relationship ID rId10 was not found in the file.

                                                                           More than   100,000 solutions for our customers

                                                                           2.4M hectares of forest managed
The image part with relationship ID rId13 was not found in the file.

                                                                           Group offices in Johannesburg, London and Vienna

                                                                           Primary listing on the JSE
                                                                           Limited for Mondi Limited

                                                                           Premium listing on the London
                                                                           Stock Exchange for Mondi plc

                                                                           FTSE4Good Index Series
                                                                           JSE’s Socially Responsible Investment Index

                                                                                                                                 1
RISI International Containerboard Conference| 2018 - The European Containerboard Market - Events
Mondi at a glance
                                         Fibre Packaging2                                              Consumer Packaging                                         Uncoated Fine Paper

                                                 €3,735m                                                              €1,646m                                           €1,832m

      2017
    revenue1                                                                                                                                                            25%
       &                                                    52%
   underlying                                                                                                     23%
     EBITDA
     margin3
                                                   22.3%                                                               13.5%                                             25.3%

     Products

1 Segment revenues, before elimination of inter-segment revenues
2 Packaging Paper and Fibre Packaging were replaced by a single business unit called Fibre Packaging effective from 1 August 2018
3 The Group early adopted the new 'Leases' accounting standard, IFRS 16. All 2017 comparative figures in this presentation have been restated where applicable.                         2
RISI International Containerboard Conference| 2018 - The European Containerboard Market - Events
2017 production statistics
Total market pulp and paper = 5,976 k tonnes

           Containerboard                      Corrugated board and boxes
           2,297 k tonnes                      1,650 million m2

           Kraft paper                         Industrial bags
           1,206 k tonnes                      4,952 million units

           Uncoated fine paper                 Extrusion coatings
           1,644 k tonnes                      1,281 million m2

           Market pulp                         Consumer packaging
           552 k tonnes                        7,437 million m2

           Newsprint
           277 k tonnes

                                                                            3
RISI International Containerboard Conference| 2018 - The European Containerboard Market - Events
Leading market positions
                                      Global                               Europe                Emerging Europe    South Africa
                         Kraft paper                                  Virgin        Uncoated       Containerboard     Uncoated
                                                                  containerboard    fine paper                        fine paper

                                                     Industrial
  #1                                                   bags

                                                                   Commercial
                                                                   release liner

                                                                       Consumer flexible             Corrugated
                                                                          packaging                  packaging

  #3

Please see sources and definitions at the end of this document
                                                                                                                               4
RISI International Containerboard Conference| 2018 - The European Containerboard Market - Events
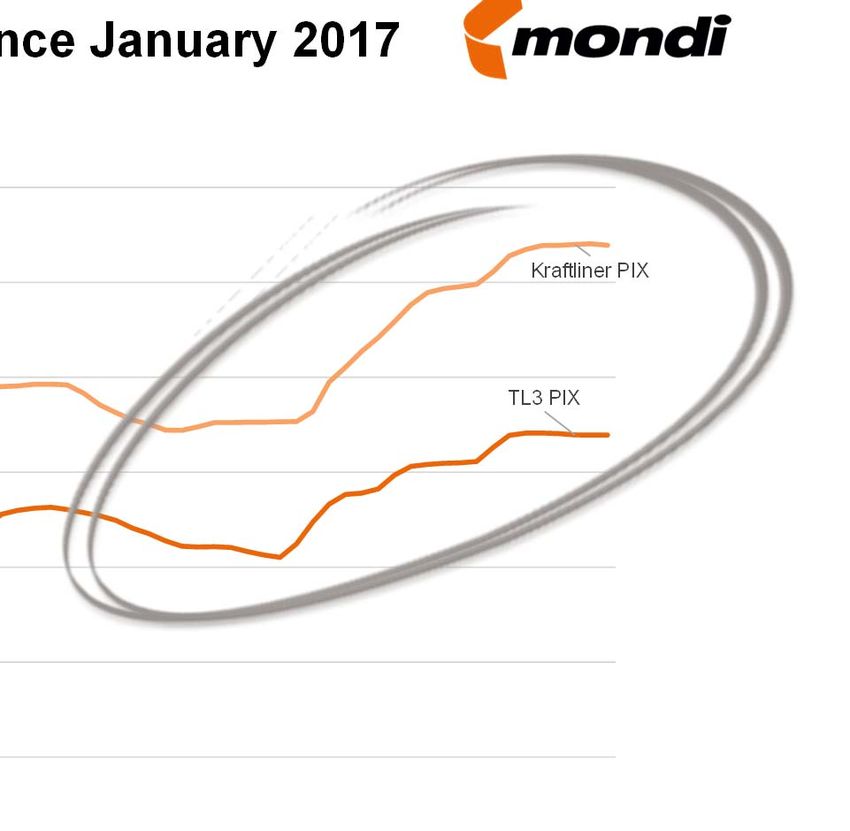
Some issues have not changed since 2010
   Agenda (from 2010)

                Economic crisis                                               Sustainability
                Decreased paper consumption                                   Climate Change and
                Recovered fibre tight supply                                      Environmental Impact
                Exchange rate                                                 Demographics

                           Short                          Medium                          Long
                           Term                            Term                           Term

                                               Substitution
                                               Substance reduction
                                               Wide deckle trend
                                               Recovered fibre avialability
                                               Shift of capacity
                                               Increasing marketing role
                                                   of packaging (WT)

                                                                                  How these trends have been
                                                                                  developing in Europe? What
                                                                                  possibly comes next?

Source: Mondi
                                                                                                               5
RISI International Containerboard Conference| 2018 - The European Containerboard Market - Events
Drivers for containerboard growth 2013-2018

Containerboard market overview

  Recycled containerboard

  Kraft Top Liner

  Kraftliner

  White liners

  Semi-chemical Fluting

                                    6
RISI International Containerboard Conference| 2018 - The European Containerboard Market - Events
Strong fundamentals driving containerboard consumption in Europe
                               15%               EU containerboard demand and its drivers

                                                                                                                 9.9%
                               10%

                               5%     4.3%
                                                                   3.2%
                                                 2.5%                                             2.4%
                                                                                 1.4%

                               0%
                                     Demand    Real GDP        Manufacturing   Consumer        Retail Sales   E-commerce
                                                                               Spending

   2010               2013           2017     2012      2013                            2017

    Source: Numera Analytics                                                                                               7
RISI International Containerboard Conference| 2018 - The European Containerboard Market - Events
E-commerce growth is pulling corrugated

                        EU e-commerce retail sales                                                              Global e-commerce packaging by type
                                                                                                                              (2017)
 200                                                                                           90%            81%

 160                                                                                           75%

                                                                                               60%
 120
                                                                                               45%
 80
                                                                                               30%
                                                                                                                           15%
 40                                                                                            15%
                                                                                                                                        4%               1%
        Index, 2010 = 100
   0                                                                                            0%
       08     09       10      11       12      13       14      15      16   17                           Corrugated    Flexibles   Protective   Protective mailers
                                                                                                                                     packaging

                                       80% of packaging in e-commerce is corrugated
                                               e-commerce growth needs corrugated to grow with it

 This one exceptionally strong increase is partly due to change in reporting standards of Amazon in 2016

 Source: Eurostat, Numera Analytics, Mondi corrugated e-commerce study                                                                                         8
RISI International Containerboard Conference| 2018 - The European Containerboard Market - Events
Central / Eastern Europe with further growth potential

                                                                                            Containerboard consumption per capita
                                                  80

                                                                                                                                                                Average consumption in
                                                  70                                                                                                               Western Europe

                                                  60

                                                  50
                             Annual kg / capita

                                                  40

                                                  30

                                                  20

                                                  10

                                                   0
                                                       Germany   Austria   Poland   Italy      Cz.      France     Croatia   UK     Turkey   Bulgaria Hungary Romania   Russia
                                                                                             Republic

                                                                                                2010             2016        Western European Avg

Source: Containerboard consumption according to RISI, population from public sources                                                                                                     9
Drivers for containerboard growth 2013-2018

Containerboard market overview

  Recycled containerboard

  Kraft Top Liner

  Kraftliner

  White liners

  Semi-chemical Fluting

                                    10
In the last five years, RCB growth in Europe has exceeded new
capacity
                                                                                                                          ● Europe growth according to CEPI / RISI:
RCB demand growth in Europe (CEPI)                      1
                                                                                                                              ○ 2017 RCB consumption: 26-27 mt
                     30,000                                                                                 10%
                                                                                                                              ○ Average market growth for 2013 – 2018:
                                                                                                            9%                                  - 3.5-4% per annum
                     25,000
                                                                                                            8%
                                                                                                                                                - ~4.5mt (~900ktpa)
                                                                                                            7%
                     20,000
                                                                                                                          ● New RCB capacity in Europe absorbed due to strong
Market demand (kt)

                                                                                  5.9%
                                                                                                            6%

                     15,000                                                                                 5%                domestic demand, especially in 2017
                              4.4%
                                                    3.9%                                        3.9%
                                                                                                            4%            ● Over the last 5 years (2013-2018), demand has
                     10,000
                                                                                                            3%
                                      2.3%                                                                                    outstripped new capacity by 1.1mt:
                                                                   1.6%                                     2%
                      5,000
                                                                                                            1%                                               4.8
                                                                                                                                                5.0
                         0                                                                                  0%                                  4.0                     3.7

                                                                                                                               Million tonnes
                              2013    2014          2015           2016          2017          2018
                                                                                              Aug YTD                                           3.0
                                             Growth rate               RCB Europe                                                               2.0
                                                                                                                                                1.0
                                                                                                                                                0.0
                                                                                                                                                          Demand      Capacity

       Source: RISI (2013), CEPI (2014-2018). 2018 based on extrapolated H1 2018 growth. Based on current available information.
                                                                                                                                                                                 11
       1. Europe excluding Russia
Strong increase in average containerboard prices since January 2017

          800

                                                                                                                                                                                          Kraftliner PIX
          700

          600
                                                                                                                                                                                      TL3 PIX

          500
 EUR /t

          400

          300

          200

          100

           0
           1/1/2010   7/1/2010   1/1/2011   7/1/2011 1/1/2012   7/1/2012   1/1/2013 7/1/2013   1/1/2014   7/1/2014 1/1/2015 7/1/2015   1/1/2016 7/1/2016   1/1/2017 7/1/2017   1/1/2018   7/1/2018

   Source: FOEX PIX                                                                                                                                                                                        12
Looking ahead…
● We expect European recycled containerboard to grow at ~3% per annum in the medium term
● We expect demand to be in line supply over the next couple of years
● Post 2020, variables:
  ○ European demand growth and structural drivers (e-commerce, exports)
  ○ Execution of new capacity. Projects may be further delayed or cancelled
  ○ China OCC ban will affect global tradeflows - underpin for net exports from Europe
                                       2018 – 2020                                                      2021 – 2023
                    4.0                                                              4.0
                                                                                                                            4.0
                                                                                                                                     Range of possible
                    3.5                                                              3.5
                                                                                                                            1.2      outcomes depending
                    3.0                                                              3.0                                             on timing capacities
   Million tonnes

                                                                    Million tonnes                                                   materialise
                    2.5                                                              2.5
                    2.0                                                              2.0                         4.0
                                                3.5
                    1.5                                    3.1                       1.5               2.9
                                      2.7                                                                                   2.8
                    1.0     1.8                                                      1.0     2.0
                    0.5                                                              0.5
                    0.0                                                              0.0
                          Base -1%    Base    Base +1%   Capacity                          Base -1%    Base    Base +1%   Capacity

                                     Demand                                                           Demand                                        13
Drivers for containerboard growth 2013-2018

Containerboard market overview

  Recycled containerboard

  Kraft Top Liner

  Kraftliner

  White liners

  Semi-chemical Fluting

                                    14
Strong substitutional shift towards Kraft Top Liner

                                                              Kraft Top Liner production in Europe
                   1400

                   1200                                                                                         625

                                                                                1 119                   1 111
                   1000
                                                                                                 972
                                                          925
 Produced Volume

                    800             844
                                                                                                                         Definition Kraft Top Liner:
                                                                                                                         Recycled fibre based paper
                    600
                                                                                                                601      with a top layer predominantly
                                                                                                                         made from virgin fibre
                    400

                    200

                       0
                                   2013                   2014                   2015            2016   2017    2018 *

                   Source: Cepi Containerboard until H1 2018. H2 2018 based on historic growth                                                     15
Strength, printability, appearance: Kraft Top White

                                                      16
Drivers for containerboard growth 2013-2018

Containerboard market overview

  Recycled containerboard

  Kraft Top Liner

  Kraftliner

  White liners

  Semi-chemical Fluting

                                    17
Kraftliner historic demand growth in Europe and new capacity

         Kraftliner1 deliveries to Europe2 (CEPI)
                                                                                                                                         ● Europe growth according to CEPI / RISI:
                                                                                                                          10%
                                                                                                                                             ○ 2017 kraftliner consumption: 5.2mt
                      5,000
                                                                                                                          8%                 ○ Average market growth for 2013 – 2018:
                      4,000                                                                                               6%                       - 2.1-2.7% per annum
                                                                 4.7%
Market demand (kt)

                                                                                4.0%
                      3,000
                                                                                                                          4%                       - 500-650 kt (~120ktpa)
                                                  2.5%
                                                                                               1.6%                       2%             ● There is no new significant capacity expected in
                      2,000
                                                                                                                          0%
                                                                                                                                             Europe over the next 2-3 years with 3 potential new
                      1,000
                                  -0.5%                  Stora Varkaus                                                                       machines that could come on stream from 2021 on:
                                                         startup                                                          -2%
                                                                                                             -2.3%                           ○ SCA Obbola (400kt)
                          0                                                                                               -4%
                                   2013           2014           2015           2016           2017          2018
                                                                                                            Aug YTD
                                                                                                                                             ○ Stora Enso Oulu (400kt)
                                                           Growth rate              KL Europe
                                                                                                                                             ○ Ilim Ust Ilimsk (400kt) – mostly destined for Chinese
                                                                                                            Supply
                                                                                                            limitations                          market

                     Source: CEPI (2015-2018) and RISI (2013-2014). 2018 based on extrapolated H1 2018 growth. Based on current available information.
                     1. Kraftliner includes all kraftliner including white but excludes kraft top liner                                                                                        18
                     2. Europe excludes Russia
Europe is a importer of unbleached kraftliner, predominantly
from the US
                                                   Historical development of US unbleached KL exports to Europe
                 1,400                                                                                                                                                                                      1.6
                                                                                                                               1.47
                                                                                                                                      1.39          1.39
                                                                                                                        1.37
                                                                                                                                             1.33                 1.33   1.33                               1.4
                 1,200                                                                                                                                     1.29
                                                                                                   1.24   1.25   1.26
                                                   1,053                                                                                                                                             1.19
                                                                                            1.13                                                                                              1.13          1.2
                                                                                                                                                                                1.11   1.11
                 1,000                                                                                                                              953
                                                           921
                                                                                                                                             867
                                             844                       0.92          0.94                                                                  837                                              1
                                                                              0.90                                                                                       803    801    811
                                       776                                                                                                                                                    777
                   800
                                                                                                                                                                  732                                             - 4.2% (34 kt)

                                                                                                                                                                                                                  EUR/USD
                                695
'000 TONNES

                          643                                    642                                                           655                                                                          0.8
                                                                       584                                                            602
                   600
                                                                                                                        535
                                                                                                                                                                                                     514
                                                                              493                                                                                                                           0.6
                                                                                     446
                                                                                            387           405
                                                                                                   375           380
                   400
                                                                                                                                                                                                                            1% of European
                                                                                                                                                                                                            0.4
                                                                                                                                                                                                                               demand

                   200
                                                                                                                                                                                                            0.2

                     0                                                                                                                                                                                      0
                         1993 1994 1995 1996 1997 1998 1999 2000 2001 2002 2003 2004 2005 2006 2007 2008 2009 2010 2011 2012 2013 2014 2015 2016 2017 2018
                                                                                                                                                      Aug
                                                                                                                                                      YTD

                                 2017 US imports were lower than 2016, but in the range of recent years
              Source: US Census, FX rates publicly available                                                                                                                                                                        19
Drivers for containerboard growth 2013-2018

Containerboard market overview

  Recycled containerboard

  Kraft Top Liner

  Kraftliner

  White liners

  Semi-chemical Fluting

                                    20
White liners continue to grow in Europe
                      European production per
                       containerboard grade                                                     European white liners growth
                                     White top
                    Semi-chemical                                                              +5.3%
                                     kraftliner                                        +5.1%                                         +5.1%
                       fluting          5%         White
                         4%                       Recycled                                                        +4.5%
                                                   Liners
                                                    11%

                                                        Brown                                             +2.5%
                                                       kraftliner
                                                          9%                                                                 +1.9%

                                                                                      White Rec. Liners   WT Kraftliners   Total Brown Grades
   Recycled
 containerboard                                                                                            2016    2017
      72%

                               Coated grades represent 10% of white top testliners and 23% of white top kraftliners.

 Source: CEPI Containerboard                                                                                                                 21
Drivers for containerboard growth 2013-2018

Containerboard market overview

  Recycled containerboard

  Kraft Top Liner

  Kraftliner

  White liners

  Semi-chemical Fluting

                                    22
European semi-chemical fluting and Nordic semi-chemical
fluting sales
                                                                     European shipments
                                      800

                                      700   672 kt                                                                      659 kt

                                      600

                                      500
                                                                                                                        438 kt
                       Volume in kt

                                      400   372 kt

                                      300
                                            312 kt                                                                      323 kt

                                      200

                                      100

                                       0
                                            2011             2012       2013     2014           2015             2016   2017
                                                              Western Europe   Eastern Europe          Exports

                       The European market is mature – all growth coming from export markets

 Source: CEPI Containerboard, Annual Production Statistics                                                                       23
Wrap Up

                   ●   Strong economy
                   ●   Strong growth in Eastern Europe
Trends and         ●   E-commerce
Demand Drivers
                   ●   China
                   ●   Plastic ban and demand for paper based solutions

                   ● Strong demand growth
Recycled
                   ● Capacity in line with demand in med. term

                   ● Smaller growth, no significant capacity in mid-term
Kraftliner
                   ● Some meaningful projects under investigation

                   ● Growing market for white liners in Europe
White Top liners
                   ● Stable market for semi-chemical fluting in Europe
Semi-chemical
Fluting            ● Continuous potential for exports globally based on high
                       quality

                                                                               24
Market position sources and definitions
Mondi region definitions
Europe – Europe including Russia and Turkey
Emerging Europe – Albania, Armenia, Azerbaijan, Belarus, Bosnia and Herzegovina, Bulgaria, Croatia, Cyprus, Czech Republic, Estonia, Georgia, Hungary,
Latvia, Lithuania, Macedonia, Malta, Moldova, Montenegro, Poland, Romania, Serbia, Slovakia, Slovenia, Turkey, Ukraine
North America – Canada, Mexico, USA

Sources for market position estimates

Virgin containerboard (Europe) and Containerboard (emerging Europe) based on capacity (including kraft top liner) – Source: RISI European Paper Packaging
Capacity Report and Mondi estimates
Kraft paper (Global) based on capacity – Source: RISI European Paper Packaging Capacity Report, RISI Mill Asset Database, Pöyry Smart Terminal Service and
Mondi estimates
Corrugated packaging (emerging Europe) based on production – Source: Henry Poole Consulting and Mondi estimates
Industrial bags (Global) based on sales volume – Source: Eurosac, Freedonia World Industrial Bags 2016 study and Mondi estimates
Consumer flexible packaging (Europe) based on sales – Source: PCI Wood Mackenzie – Flexible Packaging, European Supply/Demand report, 2017
Commercial release liner (Europe) based on sales volumes – Source: AWA European Release Liner Market Study and Mondi estimates
Uncoated Fine Paper (Europe) based on sales volumes (Ilim JV considered separate from IP) – Source: Euro-Graph delivery statistics, EMGE Woodfree
Forecast, EMGE World Graphic Papers, RISI Mill Asset Database, Eastconsult and Mondi estimates
Uncoated Fine Paper (South Africa) based on Mondi estimates

                                                                                                                                                             25
Forward-looking statements disclaimer
This document includes forward-looking statements. All statements other than statements of historical facts included herein, including, without limitation, those regarding Mondi’s financial position, business strategy, market growth
and developments, expectations of growth and profitability and plans and objectives of management for future operations, are forward-looking statements. Forward-looking statements are sometimes identified by the use of forward-
looking terminology such as ‘believe’, ‘expects’, ‘may’, ‘will’, ‘could’, ‘should’, ‘shall’, ‘risk’, ‘intends’, ‘estimates’, ‘aims’, ‘plans’, ‘predicts’, ‘continues’, ‘assumes’, ‘positioned’ or ‘anticipates’ or the negative thereof, other variations
thereon or comparable terminology. Such forward-looking statements involve known and unknown risks, uncertainties and other factors which may cause the actual results, performance or achievements of Mondi, or industry results,
to be materially different from any future results, performance or achievements expressed or implied by such forward-looking statements. Such forward-looking statements and other statements contained in this document regarding
matters that are not historical facts involve predictions and are based on numerous assumptions regarding Mondi’s present and future business strategies and the environment in which Mondi will operate in the future. These
forward-looking statements speak only as of the date on which they are made.

No assurance can be given that such future results will be achieved; various factors could cause actual future results, performance or events to differ materially from those described in these statements. Such factors include in
particular but without any limitation: (1) operating factors, such as continued success of manufacturing activities and the achievement of efficiencies therein, continued success of product development plans and targets, changes in
the degree of protection created by Mondi’s patents and other intellectual property rights and the availability of capital on acceptable terms; (2) industry conditions, such as strength of product demand, intensity of competition,
prevailing and future global market prices for Mondi’s products and raw materials and the pricing pressures thereto, financial condition of the customers, suppliers and the competitors of Mondi and potential introduction of competing
products and technologies by competitors; and (3) general economic conditions, such as rates of economic growth in Mondi’s principal geographical markets or fluctuations of exchange rates and interest rates.

Mondi expressly disclaims
a)   any warranty or liability as to accuracy or completeness of the information provided herein; and
b)   any obligation or undertaking to review or confirm analysts’ expectations or estimates or to update any forward-looking statements to reflect any change in Mondi’s expectations
     or any events that occur or circumstances that arise after the date of making any forward-looking statements,
unless required to do so by applicable law or any regulatory body applicable to Mondi, including the JSE Limited and the LSE.

                                                                                                                                                                                                                                                            26
You can also read