Renewable Energy Integration Opportunities & Challenges in Chile - system design & management
←
→
Page content transcription
If your browser does not render page correctly, please read the page content below
system design &
management

Renewable Energy Integration
Opportunities & Challenges in Chile

             Jorge Moreno SDM 2011
             Donny Holaschutz SDM 2010
Agenda
• Trends in Wind & Solar Integration in Chile

• Emerging Dynamics in the Power System
   –   Changes in the Net Load
   –   Regionalization of Power System Dynamics
   –   New Modes of Operations of Existing Units
   –   Emerging Socio-Technical Constraints
   –   Real Time Deviations from the Day Ahead Plan
   –   Challenges to Operations of Reserves
   –   The Interactions between Carbon Policy & the Power Market

• Opportunities to Utilize Existing Flexibility & Encourage
  Investment in New Flexibility

                                                                   2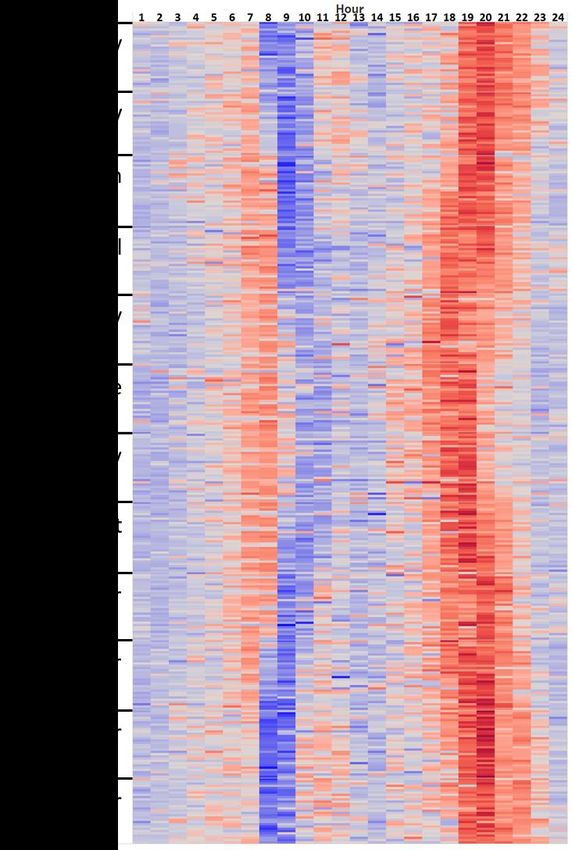
Agenda
• Trends in Wind & Solar Integration in Chile

• Emerging Dynamics in the Power System
   –   Changes in the Net Load
   –   Regionalization of Power System Dynamics
   –   New Modes of Operations of Existing Units
   –   Emerging Socio-Technical Constraints
   –   Real Time Deviations from the Day Ahead Plan
   –   Challenges to Operations of Reserves
   –   The Interactions between Carbon Policy & the Power Market

• Opportunities to Utilize Existing Flexibility & Encourage
  Investment in New Flexibility

                                                                   3
Chile has been a Leader in Integration of
Renewable Energy                                                                Country
                                                                                               % Percentage of Solar
                                                                                                & Wind Generated
                                                                                                      (2016)*
                                                                                Denmark                    44.6%
                   Solar Installed Capacity*
                                                                                Lithuania                  27.3%
     3.00
                                                                                   Spain                   22.8%
                                                                                 Portugal                  22.0%
     2.50                                                    Rest of South        Ireland                  20.2%
                                                              America &         Germany                    17.8%
                                                               Central
                                                                                  Greece                   17.1%
                                                               America
     2.00                                                                                                  14.2%
                                                                                    Italy
                                                                             United Kingdom                14.1%
                                                                                Romania                    13.2%
GW

     1.50
                                                                                 Belgium                   9.9%
                                                                                 Sweden                    9.9%
     1.00                                                                         Austria                  9.2%
                                                                              Netherlands                  8.3%
                                                                Chile           Australia                  7.9%
     0.50
                                                                                  Poland                   7.6%
                                                                                     US                    6.6%
     0.00                                                                         Turkey                   6.3%
            2011      2012   2013    2014      2015   2016                         Chile                   6.3%

                                                                                       *BP Statistical Review of World Energy

                                                                                                                                4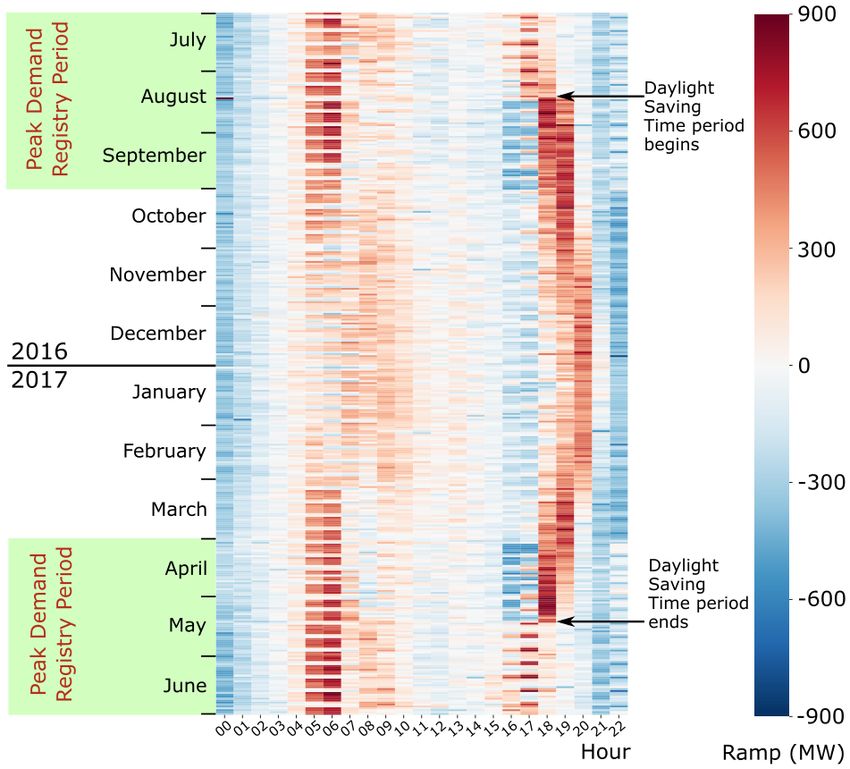
Chile has been a Leader in Integration of
Renewable Energy                                                                                  Country
                                                                                                                 % Percentage of Solar
                                                                                                                  & Wind Generated
                                                                                                                        (2016)*
                                                            2017
                                      14%                                                         Denmark                    44.6%
                                                                                                  Lithuania                  27.3%
                                                                                                     Spain                   22.8%
                                      12%
                                                                                                   Portugal                  22.0%
                                                                                                    Ireland                  20.2%
 % of Wind & Solar Energy Generated

                                      10%                                                                                    17.8%
                                                                                                  Germany
                                                                                                    Greece                   17.1%
                                      8%                                                              Italy                  14.2%
                                                                                               United Kingdom                14.1% Chile Exceded
                                                                                                  Romania                    13.2%      10%
                                      6%                                                                                              in 2017
                                                                                                   Belgium                    9.9%
                                                                                                   Sweden                    9.9%
                                      4%                                                                                     9.2%
                                                                                                    Austria
                                                                                                Netherlands                  8.3%
                                      2%                                                          Australia                  7.9%
                                                                                                    Poland                   7.6%
                                                                                                       US                    6.6%
                                      0%
                                            1   2   3   4   5   6   7   8   9   10   11   12        Turkey                   6.3%
                                                                Month                                                        6.3%
                                                                                                     Chile

                                                                                                         *BP Statistical Review of World Energy

                                                                                                                                                   5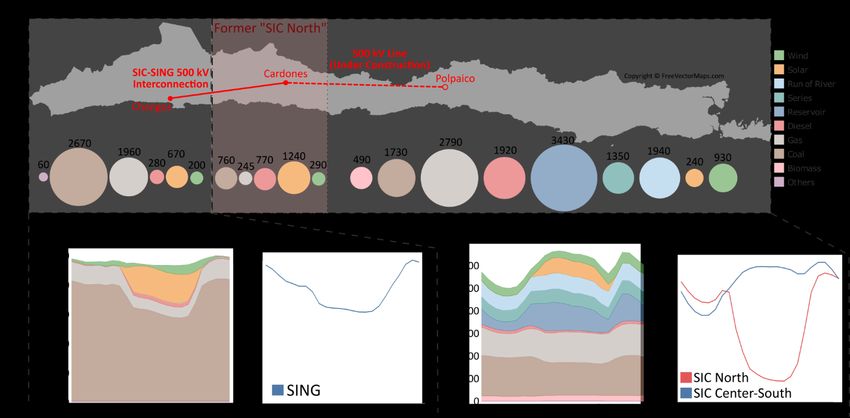
High Energy Prices & Opportunities to Sign
PPAs have Driven Integration
                                                                    Most New Projects
                                                    Block Scheme       Associated
                                                      Introduced   to Winning Bids are
                           14000                                                         160
                                                                      Wind or Solar

                           12000                                                         140

                                                                                               Average Offered Price ($USD/MWh)
                                                                                         120
 Energy Contracted (GWh)

                           10000

                                                                                         100
                           8000
                                                                                         80
                           6000
                                                                                         60

                           4000
                                                                                         40

                           2000                                                          20

                              0                                                          0

                                   Regulated Client Auctions

                                                                                                                                  6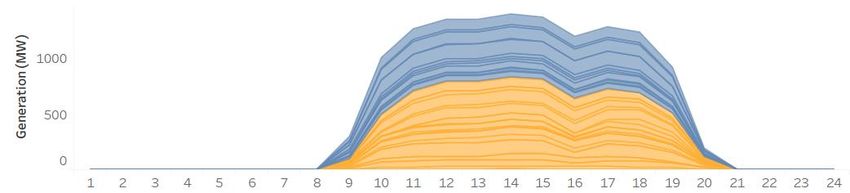
Overview on the Chilean National Electricity
System: Current Regional Dynamics
      Primarily Thermal   Primarily Hydrothermal

                                                   7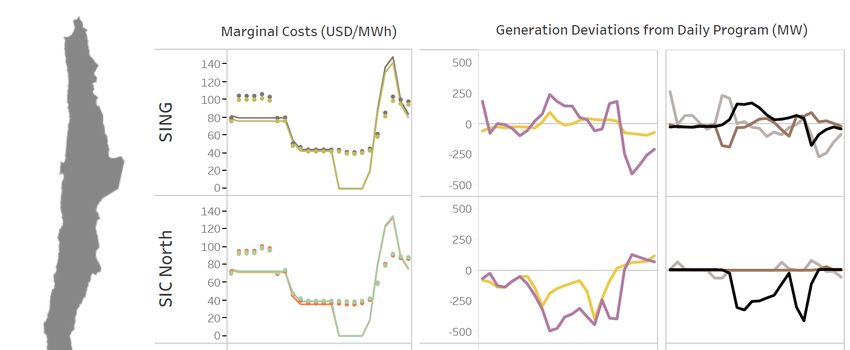
Agenda
• Trends in Wind & Solar Integration in Chile

• Emerging Dynamics in the Power System
   –   Changes in the Net Load
   –   Regionalization of Power System Dynamics
   –   New Modes of Operations of Existing Units
   –   Emerging Socio-Technical Constraints
   –   Real Time Deviations from the Day Ahead Plan
   –   Challenges to Operations of Reserves
   –   The Interactions between Carbon Policy & the Power Market

• Opportunities to Utilize Existing Flexibility & Encourage
  Investment in New Flexibility

                                                                   8
Wind and Solar Integration is Changing the Net Load
                   12000                       Coal
                                               RoR Hydro
                                               Others                                                              March 28th, 2018
                                               Gas                          Approximation of Net Load
                                               Reservoir Hydro
                   10000
                                               Solar
                                               Wind

                   8000
 Generation (MW)

                   6000

                   4000

                   2000

                      0
                           1   2   3   4   5   6   7    8   9    10   11   12   13   14   15   16   17   18   19    20   21   22   23   24
                                                                           Hour

                                                                                                                                             9
One-Hour Net Load Ramps Requirements in the System

                                                     10
The One-Hour Net Load Ramp Requirement in the System
could double by 2021 and triple by 2026
Max 1745 MW/hr Max 2837 MW/hr
2021 Min -1393 MW/hr 2026 Min -2463 MW/hr
2,750
0 MW
-2,750
11The Duck Curve does Not Always Apply to Chile
Dry Scenario (2021) Wet Scenario (2021)
10000 10000
9000 9000
8000 8000
Generation (MW)
Generation (MW)
7000 7000
Winter 6000 6000
5000 5000
Day 4000 4000
3000 Net Load 3000 Net Load
2000 2000
Net Load minus Hydro Reservoir 1000
Net Load minus Hydro Reservoir
1000
Generation Generation
0 0
1 3 5 7 9 11 13 15 17 19 21 23 1 3 5 7 9 11 13 15 17 19 21 23
Hours Hours
10000 10000
9000 9000
8000 8000
Generation (MW)
7000
Generation (MW)
Summer 7000
6000
6000
Day 5000 5000
4000 4000
3000 Net Load 3000 Net load
2000 2000
Net Load minus Hydro Reservoir Net Load minus Hydro Reservoir
1000 1000
Generation Generation
0 0
1 3 5 7 9 11 13 15 17 19 21 23 1 3 5 7 9 11 13 15 17 19 21 23
Hours Hours 12In Chile the (Net Load – Hydro Curve) Looks More
like a Penguin from the Patagonia Swimming
Wet Scenario (2021)
10000
9000
8000
Generation (MW)
7000
6000
Winter 5000
Day 4000
3000 Net Load
2000
1000
Net Load minus Hydro Reservoir
Generation
0
1 3 5 7 9 11 13 15 17 19 21 23
Hours
10000
9000
8000
7000
Generation (MW)
6000
Summer 5000
Day 4000
3000 Net load
2000
Net Load minus Hydro Reservoir
1000
Generation
0
1 3 5 7 9 11 13 15 17 19 21 23
Hours 13Integration of Solar & Wind will Give Rise to
the “Middle Market”
The “Middle Market” has reached 2500 MW and could double o triple in the next ten years
Capacity Needs Are Changing with New Flexibility Needs
14Agenda
• Trends in Wind & Solar Integration in Chile
• Emerging Dynamics in the Power System
– Changes in the Net Load
– Regionalization of Power System Dynamics
– New Modes of Operations of Existing Units
– Emerging Socio-Technical Constraints
– Real Time Deviations from the Day Ahead Plan
– Challenges to Operations of Reserves
– The Interactions between Carbon Policy & the Power Market
• Opportunities to Utilize Existing Flexibility & Encourage
Investment in New Flexibility
15In the North – Wind and Solar Have been
Integrated Rapidly
Feb 27, 2016 Feb 27, 2018
NES-SING and
NES-SIC North
Central Interconnected System (SIC) & Northern Interconnected System (SING)
were connected in November 2017 to create the National Energy System (NES)
16Regional Net- Load Dynamics: In the North the
Duck Will Rapidly Get Chopped
Scenario (2021)
3500
Net Load Solar Wind
Demand - Generation (MW ) 3000 NES-SING and
Winter 2500 NES-SIC North
Day 2000
1500
1000
500
0
1 3 5 7 9 11 13 15 17 19 21 23
3500
Hour of Day
Net Load Solar Wind
Demand - Generation (MW )
3000
2500
Summer
2000
Day
1500
1000
500
0
1 3 5 7 9 11 13 15 17 19 21 23
Hour of Day
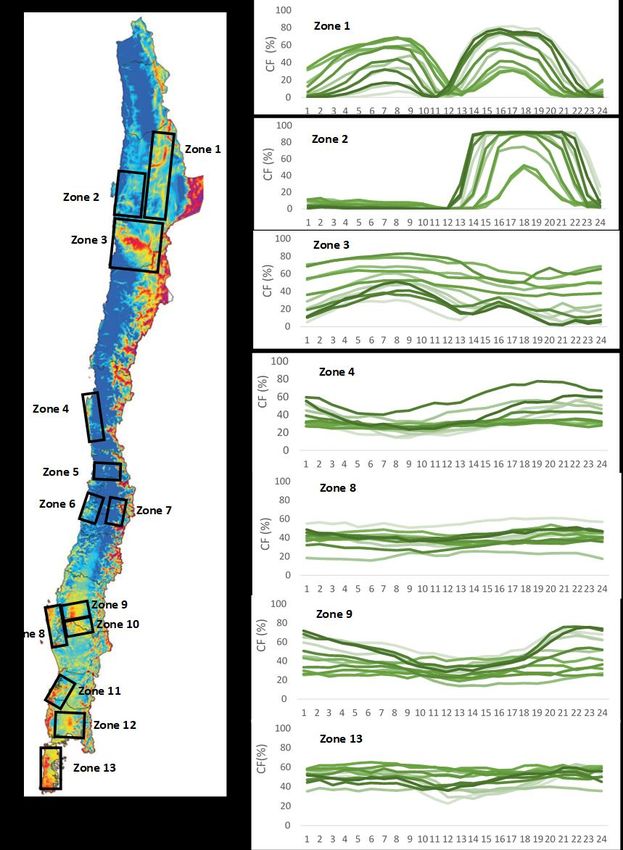
17High wind generation in zone 1 & 2
coincide with the drop in solar PV
production, as well as local peak
demand.
As the integration of wind and solar
generation increases in the north
deviations from the forecasted wind
generation in the north could increase
the stress on the system in real-time
operations.
18Agenda
• Trends in Wind & Solar Integration in Chile
• Emerging Dynamics in the Power System
– Changes in the Net Load
– Regionalization of Power System Dynamics
– New Modes of Operations of Existing Units
– Emerging Socio-Technical Constraints
– Real Time Deviations from the Day Ahead Plan
– Challenges to Operations of Reserves
– The Interactions between Carbon Policy & the Power Market
• Opportunities to Utilize Existing Flexibility & Encourage
Investment in New Flexibility
19Startups Increasing in Gas Units (2017) &
Operations Likely to Continue
Kelar on 11/16/2017
Actual
Day Ahead Plan Actual
20In a 2026 Scenario with a Carbon Tax of 30 USD/ton, Coal
Plants Stay on Cycling to Minimum Load
350
SING SIC
Generation (MW)
300
100 250
200
Time at Minimum Output Level (%)
90
150
80
100
70 50
60 0
50 Hours
40
30 350
Generation (MW)
300
20 250
10 200 Guacolda (SIC North)
150
0
0 20 40 60 80 100 100
50
Capacity Factor (%)
0
Hours
All units in the SING and the north of the SIC are kept either operating between their minimum stable
level and maximum net capacity, or operating constantly at a minimum level to provide reserves.
21High Variable Cost Flexible Units have been
Used more than Planned (Oct 2016 - Sept 2017)
.
22Agenda
• Trends in Wind & Solar Integration in Chile
• Emerging Dynamics in the Power System
– Changes in the Net Load
– Regionalization of Power System Dynamics
– New Modes of Operations of Existing Units
– Emerging Socio-Technical Constraints
– Real Time Deviations from the Day Ahead Plan
– Challenges to Operations of Reserves
– The Interactions between Carbon Policy & the Power Market
• Opportunities to Utilize Existing Flexibility & Encourage
Investment in New Flexibility
23Coal Plants Affected by Effluent Temperature Limitations in
the North under Strong Niño Conditions in the Pacific Ocean
UNIT NOV 2016 DEC 2016 JAN 2017 FEB 2017
NTO2 Unit Day Ahead Plan
Actual
24Effluent Temperature Limitation of Coal Power Plants Coincides
with the Drop of Solar PV Generation and Spinning Reserves
Days with Water
Temperature
Limitations °C
At 19:11 on Feb 20th 2018 the CTM 1
Unit Reports:
• Limitation Due to High
Temperatures at the Discharge
• States that Generation Capacity
Day Ahead Plan
will be Limited to 110 MW
Actual
25Defined Local Emissions Limits Can Affect
Power Market Operations
Emissions Limits for Existing Units
Fuel Particulate Matter Sulfur Dioxide Nitrous Oxide
(MP) mg/Nm3 (SO2) mg/Nm3 (NOx) mg/Nm3
Coal 50 400 500
Liquid 30 30 200
Gas N/A N/A 50
MP & SO2 can exceed the limit 5% of the hours due to (startup, shutdown, and trips)
NOx must meet limit during 70% of the hours operating, including startup periods.
NOx Emissions Measurement of a Gas Unit (CCGT)
150
140 In 2016 gas units exceeded:
Hora Encendido
Startup Hours
130
Continuous
En Regimen Operations
120 • NOx limits for existing units 54%
110 of the time during startup
100 Challenges Meeting the Current Standard
90 At Partial Load & During Startup
mg/Nm3
In 2016 coal units exceeded:
80
70
60 • PM & SO2 limits for existing units
50 23% of the time during startup
40
30 • NOx for existing units 12% of the
20 time during startup
10
0
0 50 100 150 200 250 300 350 400
Generation (MW)
*Ministry of Energy 2017
26Limitations can Affect Power Market Operations
*Ministry of Energy 2017
27Limitations can Affect Power Market Operations
Problems with SO2 mitigations CTTAR Coal Unit – July 11th, 2017
equipment start at 7:44 am At 11:25 am it reports that unit will
shut down for high emissions and
problems with SO2 mitigations Day Ahead Plan
equipment
Actual
*Ministry of Energy 2017
28Agenda
• Trends in Wind & Solar Integration in Chile
• Emerging Dynamics in the Power System
– Changes in the Net Load
– Regionalization of Power System Dynamics
– New Modes of Operations of Existing Units
– Emerging Socio-Technical Constraints
– Real Time Deviations from the Day Ahead Plan
– Challenges to Operations of Reserves
– The Interactions between Carbon Policy & the Power Market
• Opportunities to Utilize Existing Flexibility & Encourage
Investment in New Flexibility
29Dynamics of 3-13-2018 in the North part of
the SEN
Marginal Costs Reached
148 $USD/MWh at 10pm
Planned
Actual
Hour of Day Hour of Day Hour of Day
30Dynamics of 3-13-2018 in the North part of
the SEN
Wind and solar generation Coal generation rapidly deviating
398 MW less than expected at 3pm reaches 414 MW less than expected at
7pm
Planned
Actual
Hour of Day Hour of Day Hour of Day
31Dynamics of 3-13-2018 in the North part of
the SEN Solar Generation SING
Solar Generation
SIC North
1 Hour Ramp Manageable Generation SING
1 Hour Ramp Manageable Generation SIC North
Actual
32Dynamics of 3-13-2018 in the North part of
Marginal Costs
the SEN 148 $USD/MWh
at 10pm in SING
Day Ahead Plan
CTM1 Coal Plant Reports Cooling
Limitation at 9:16pm
Actual
Sierra Gorda Wind Farm
Day Ahead Plan
Actual
Valle de los Vientos Wind Farm
Actual
Day Ahead Plan
33Variations between the Planned Marginal Costs
(Day Ahead) and the Real in the SING
Marginal Cost SING (Crucero Busbar) Marginal Cost SING (Crucero Busbar)
Pre-Interconnection (Jan 2017 – Nov 2017) Post-Interconnection (Nov 2017-Mar 2018)
CMg Real CMg Prog
CMg Real CMg Prog 250
250
200
Marginal Cost (USD/MWh)
200
Marginal Cost (USD/MWh)
150
150
Overestimated
100
100 Marginal Cost
Underestimated
Marginal Cost 50
50
0 0
1
1054
1171
1288
1405
1522
1639
1756
1873
1990
2107
2224
2341
2458
2575
2692
2809
2926
3043
118
235
352
469
586
703
820
937
1
1153
1441
1729
2017
2305
2593
2881
3169
3457
3745
4033
4321
4609
4897
5185
5473
5761
6049
6337
6625
6913
7201
7489
289
577
865
34Dynamics of 3-26-2018 in
Planned the North part of the SEN
Marginal Costs
Overestimated
Actual
Imports from the SIC
provided flexibility &
lowered marginal cost
between 7pm & Midnight
Programed SING to SIC
but flowed from SIC to SING
Hour of Day
Programmed
Real
Hour of Day
35Dynamics of 9-23-2017 SIC (Pre-Interconnection)
Less Renewables than Expected
Reservoir Hydro & Gas provided Flexibility
36Dynamics of 9-23-2017 SIC (Before
Interconnection)
Less Renewables than Expected
Reservoir Hydro & Gas provided Flexibility
37Agenda
• Trends in Wind & Solar Integration in Chile
• Emerging Dynamics in the Power System
– Changes in the Net Load
– Regionalization of Power System Dynamics
– New Modes of Operations of Existing Units
– Emerging Socio-Technical Constraints
– Real Time Deviations from the Day Ahead Plan
– Challenges to Operations of Reserves
– The Interactions between Carbon Policy & the Power Market
• Opportunities to Utilize Existing Flexibility & Encourage
Investment in New Flexibility
38Overview of Planned Reserves for Frequency Regulation:
PFC (Contingency) + PFC (Up Regulation) + SFC (Up)
Case December 2017 (average day)
Recently, the interconnection
1800
(NES-SIC & NES-SING)
1600 NES-SING allowed the reduction of
1400
reserve requirements for PFC
1200
in the system.
1000
MW
800
600
Different reserve providers
400
in the SIC-Center and SIC-
200
South.
0
1 2 3 4 5 6 7 8 9 10 11 12 13 14 15 16 17 18 19 20 21 22 23 24
Hour Competitive advantage of
BESS Gas Coal generators that provide
1800 reserves in different
1600 NES-SIC regions of the NES-SIC.
1400
1200
1000
MW
800
600
PFC: Primary Frequency Control
400
SCF: Secondary Frequency Control
200
0
1 2 3 4 5 6 7 8 9 10 11 12 13 14 15 16 17 18 19 20 21 22 23 24
Hour
Gas Hydro Coal
39Planned Reserves SIC North & SING 3/03/2018
PFC Contingency
Battery Angamos
(MW)
Battery Cochrane
Primary PFC Up Regulation
(MW)
Reserves
PFC Down Regulation
(MW)
40Planned Reserves SIC North & SING 3/03/2018
PFC Contingency
Battery Angamos
(MW)
Battery Cochrane
Primary PFC Up Regulation
(MW)
Reserves
PFC Down Regulation
(MW)
SFC Up Regulation
Coal Over Supply
(MW)
Of Reserves
During the Day
Secondary
Reserves
SFC Down Regulation
(MW)
41Planned Reserves SIC North & SING 3/03/2018
PFC Contingency
Battery Angamos
(MW)
Battery Cochrane
Primary PFC Up Regulation
(MW)
Reserves
When there is renewable curtailment &
PFC Down Regulation
transmission constraints price signal
(MW)
drops to zero.
SFC Up Regulation
Coal Over Supply
(MW)
Of Reserves
During the Day
Secondary
Reserves
SFC Down Regulation
(MW)
42Planned Reserves SIC North & SING 3/03/2018
PFC Contingency
Battery Angamos
(MW)
Battery Cochrane
Primary PFC Up Regulation
(MW)
Reserves
PFC Down Regulation
(MW)
SFC Up Regulation
Reserves Supply
Tightens up
(MW)
After Sun Hours
Secondary
Reserves
SFC Down Regulation
(MW)
43Planned Reserves SIC North & SING 3/03/2018
PFC Contingency
Battery Angamos
(MW)
Battery Cochrane
Primary PFC Up Regulation
(MW)
Reserves
PFC Down Regulation
(MW)
SFC Up Regulation
(MW)
Secondary
Reserves
SFC Down Regulation
Opportunity for
(MW)
Renewables to Provide
SFC Down Regulation
44Use of More Gas and Diesel than Planned in Day
Ahead Coincide with Tightening of Reserve Supply
October 2016 – September 2017 (SING)
25
Cumulative Hourly Deviations (GWh)
20 Gas Diesel
15
10
5
0
-5 1 2 3 4 5 6 7 8 9 10 11 12 13 14 15 16 17 18 19 20 21 22 23 24
-10
Hours
45Increases in Wind Capacity Drives New
Ramping and Reserve Requirements
• Projected Variability will Drive Definitions of Reserves
– Scenario for 20-min variability
– Wind generation developed across Chile
Wind Data: AWS Truepower
46If no new flexible
generation projects are
added, increasing spinning
reserve requirements
increases:
1. VRE Curtailment,
2. CO2 Emissions, and
3. Operational Costs
for Medium Hydrological
Conditions
47Agenda
• Trends in Wind & Solar Integration in Chile
• Emerging Dynamics in the Power System
– Changes in the Net Load
– Regionalization of Power System Dynamics
– New Modes of Operations of Existing Units
– Emerging Socio-Technical Constraints
– Real Time Deviations from the Day Ahead Plan
– Challenges to Operations of Reserves
– The Interactions between Carbon Policy & the Power Market
• Opportunities to Utilize Existing Flexibility & Encourage
Investment in New Flexibility
48Effects of Carbon Policy on the Middle Market
2017 Dry Scenario (2026)
8760 8760 8760
New RoR Projects Get Developed
49Increasing the Carbon Price Does Not Have
the Same Effects on the SIC and the SING
(Dry Scenarios)
SEN SING SEN SIC
Flexibility of reservoir hydro & reservoir hydro’s ability to provide reserves allows CO2 price signal
to be more effective in SIC
50Agenda
• Trends in Wind & Solar Integration in Chile
• Emerging Dynamics in the Power System
– Changes in the Net Load
– Regionalization of Power System Dynamics
– New Modes of Operations of Existing Units
– Emerging Socio-Technical Constraints
– Real Time Deviations from the Day Ahead Plan
– Challenges to Operations of Reserves
– The Interactions between Carbon Policy & the Power Market
• Opportunities to Utilize Existing Flexibility & Encourage
Investment in New Flexibility
51Integration of Solar & Wind will Give Rise to
the “Middle Market”
Capacity requirements are
changing with emerging
flexibility needs
Today, flexibility isn’t being
fully remunerated.
How will Chile keep
integrating more renewable
energy efficiently and
effectively?
Over time, how will Chile
efficiently and effectively
replace its existing
thermoelectric assets with
newer more flexible assets?
Hours
52New Modes of Operation Increase Costs for Existing Units
Creates Opportunities for New Technologies
Total Variable
Time
O&M (VOM)
Type of Unit Case Summary Operating Starts Trips
Cost*
(hrs)
(USD/MWh)
Case 1 – Plant Operating at Full Load with an
Average Time per Cycle of 1875 hrs
7500 Limited 4 2.5
280 MW –
Coal Unit
Case 2 – Daily Cycling between technical
minimum and full load.
7116 Limited 4 2.6
Case 1 - Mostly Full load operating 6000 hrs. 6000 Limited 4 3.2
400 MW - Case 2 - 150 real starts per year from start to 150 Warm
CCGT Unit load following.
4000 8 6.1
Starts
Case 3 - 300 real starts per year from start to 300 Warm
load following.
4000 8 8.8
Starts
53The Policy Levers to Incentivize Investment into New
Flexibility Options for the System are Intertwined
Energy CO2
Long Term Market Policy
Contracts
Environmental
Capacity Regulation Demand Demand
Market Side
Ancillary
Policy
Services TX & Dist
Market Planning
Focusing on just improving the parts of the policy independently will not guarantee
improving the performance of the whole
The performance of the electricity system will depend on how the policy levers fit
together not what they achieve separately
54Key Areas to Observe to Find
Opportunities for Flexibility:
1. Performance of existing thermoelectric
The improvement of facilities
the performance of the 2. Variability & deviations from the planned
Electricity System will
3. Deviations between actual & expected
not be driven by economic performance of the system
pondering about the
4. New constraints which emerge as the system
future, but rather really operates
understanding what is
5. The behavior of the “Middle Market” & its
happening today to find interaction with Environmental restrictions &
opportunities to CO2 Policy
improve the system for 6. Interactions between energy and operating
the long term. reserve services
7. Performance parameters which will be more
relevant to address new challenges such as
satisfying the net-load or improving regional
needs
55Upcoming Related Presentations & Paper
6th International Congress on Presentation of New Methodology to Asses Environmental
Water Management in Mining
2nd International Congress on
Impact Industrial Facilities in Chilean Environmental Impact
Water in Industrial Processes Assessment System
May 9-11, 2018 │ Santiago, Chile Jorge Moreno, Partner at inodú
Donny Holaschutz, Partner at inodu
Teaching Masterclass on Opportunities for Storage in Mexico
Donny Holaschutz, Partner at inodu
NEW MARKET INTERACTIONS IN THE CHILEAN ELECTRICITY
SYSTEM WITH HIGH INTEGRATION OF VARIABLE
RENEWABLE ENERGY
Benjamin Maluenda, Lead Analyst at inodú
Jorge Moreno, Partner at inodú
Donny Holaschutz, Partner at inodú
Esteban Gil, Professor at Universidad Técnica Federico Santa María
Presentation for Opportunities for Renewable Energy in Mining
Jorge Moreno, Partner at inodu
Challenges Complying with Emissions Limits in Chile Caused by
New Modes of Operations and High Levels of Renewable
Energy Integration
Jorge Moreno, Partner at inodú
Donny Holaschutz, Partner at inodu
56system design &
management
Renewable Energy Integration
Opportunities & Challenges in Chile
Jorge Moreno SDM 2011
Donny Holaschutz SDM 2010You can also read