Spring Stabilization Q2 2021 - Urban ...
←
→
Page content transcription
If your browser does not render page correctly, please read the page content below
Q2 2021

  Q2-2021 Edmonton Rental Take

Spring Stabilization
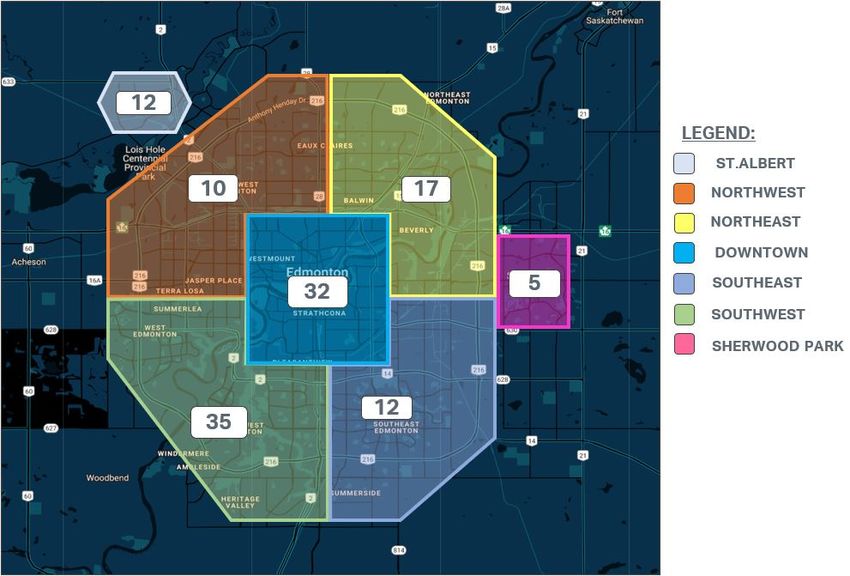
Q2-2021 EDMONTON RENTAL TAKE: SPRING STABILIZATION

  New project launch activity slowed in Edmonton’s purpose-built rental apartment market
  during the second quarter of the year. Just one project with 56 units launched during the
  quarter. This compares to the 18 projects launched during the previous two quarters.
  With less new supply added, the market was able to absorb much of the existing rental
  product. Overall vacancy decreased by three percent when compared to the first quarter
  of the year. The average rent per square foot increased by one percent ($0.02) from $1.64
  per square foot at the end of the first quarter to $1.66 per square foot at the end of Q2-
  2021.
  Urban Analytics (UA) is currently tracking 123 newer purpose-built rental apartment
  projects comprising 16,322 units across seven sub-markets, including St. Albert and
  Sherwood Park. 24 of these projects are actively leasing (under 85 percent leased and
  within the first years of launching a leasing campaign), with the remaining 99 buildings
  having been substantially absorbed and experiencing typical levels of unit turnover.
  UA is currently monitoring 27 newer concrete rental apartment projects (3,883 units), 88
  wood frame rental apartment projects (11,878 units) and eight rental townhome projects
  (628 units) in Edmonton through on-going primary research. The information collected on
  each proposed and actively leasing project is accessible to industry stakeholders through
  UA’s web-based NHSLive data platform on a subscription basis.

 Figure 1

 Q2-2021 EDMONTON RENTAL TAKE: SPRING STABILIZATION                                  2
DECREASE IN VACANCY RATES

 The overall vacancy rate for newer rental projects in Edmonton was 11 percent at the end
 of the second quarter of the year. Vacancy decreased by three percent when compared
 to first quarter and by one percent year-over-year. The decrease in vacancy can be
 attributed to the lower amount of new product introduced to the market during the
 second quarter, as with only 56 new units were added, much of the existing inventory was
 absorbed by the market.

                    AVERAGE VACANCY PER QUARTER
                         STAB ILIZED VS ALL PROJECTS                            14%

                                                             12%
                                                                                          11%

                                                            5%                        5%
                                                                                4%

 Q1       Q2   Q3   Q4     Q1     Q2     Q3      Q4   Q1    Q2        Q3   Q4   Q1    Q2

           2018                     2019                       2020               2021
                                Stabilized Projects    All Projects

Chart 1

 Chart 1 shows the average vacancy rate for stabilized newer purpose-built rental projects
 versus the average vacancy for all the projects across Edmonton. UA considers new
 projects that have less than 85 percent occupancy to be actively leasing, and those with
 more than 85 percent occupancy to be fully leased or stabilized, as this is typically when
 units begin to turn over for the first time. The vacancy is typically lower in stabilized
 projects due to those buildings being in the market for a longer period of time. The
 vacancy for all projects is higher at 11 percent, showing the impact of new project
 launches in recent quarters on overall vacancy rates. There were 24 active projects in the
 market at the end of Q2-2021 with an average vacancy rate of 46 percent, which raises
 the average vacancy for all projects.

Q2-2021 EDMONTON RENTAL TAKE: SPRING STABILIZATION                                    3
AVERAGE VACANCY BY SUBMARKET
32.1%
30%
20%
13.6%
12.2%
8.3%
10%
5.4%
4.4%
4.1%
0%
Downtown No r t h e ast No r t h w e st S o u t h w e st S o u t h e ast Sherwood S t A l be r t
Q2-2020 Q1-2021 Q2-2021 P ar k
Chart 2
All submarkets in Edmonton experienced lower vacancy compared to the first quarter of
the year. Again, this illustrates how new supply introduced during previous quarters is
being absorbed by the market.
The Downtown submarket experienced a four percent decrease when compared to last
quarter; from 36 percent to 32 percent at the end of the second quarter. The high
vacancy is due to the number of buildings that are still in their initial lease-up. The
downtown has 14 of the 24 active projects currently in the market. Those 14 active
projects are reporting an average vacancy rate of 46.7 percent which significantly
increases the average in this submarket.
Sherwood Park and the Southwest submarkets had the lowest vacancy in the second
quarter. This low vacancy can be attributed to the amount of older supply in the two
submarkets. The Southeast experienced the largest decrease in vacancy when compared
to the first quarter of the year, which can be attributed to Edgemont Estates by Carlisle
and Sora Building B by Carrington Communities that launched in Q1-2021 and Q4-2020,
now achieving 45 and 73 percent occupancy, respectively. This demonstrates there is
demand for newer rental apartment projects in these submarkets.
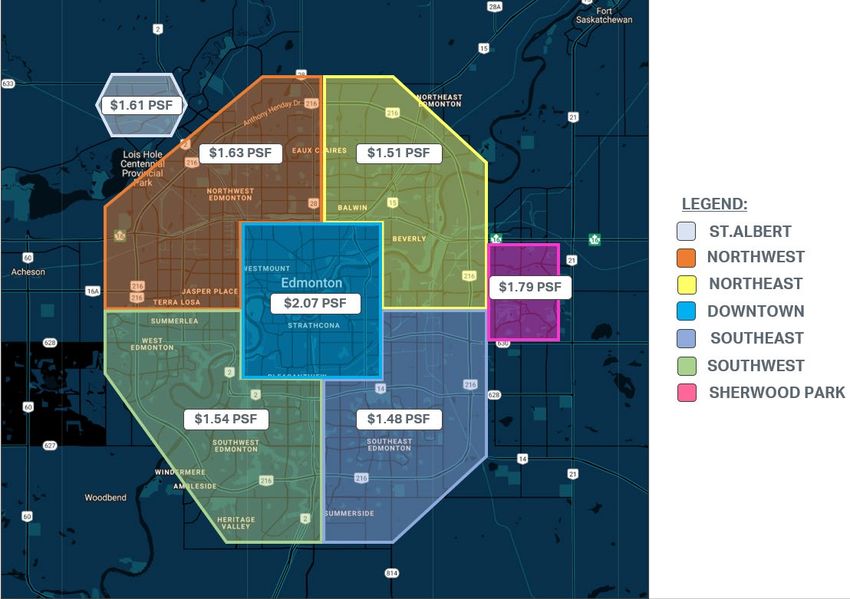
Q2-2021 EDMONTON RENTAL TAKE: SPRING STABILIZATION 4HIGHER RENTS IN Q2-2021 Rents at the end of the second quarter of 2021 were one percent higher on a per square foot basis compared to the previous quarter. This represents a $0.02 increase from $1.64 per square foot in Q1-2021 to $1.66 per square foot. Year-over-year, rents have increased by one percent or $0.02 per square foot. Rents are expected to slowly increase as Alberta continues to relax covid-19 measures and activities such as in-person learning resumes, which will increase demand from students and faculty. Figure 2 illustrates the average per square foot rental rates being sought for newer rental apartment buildings in Edmonton by sub-market. Average list rents in Downtown Edmonton continue to be the highest in the market at $2.07 per square foot. Figure 2 Q2-2021 EDMONTON RENTAL TAKE: SPRING STABILIZATION 5
Current list rents for lease renewals in the second quarter of the year varied slightly
across the market. The majority of turned over units were re-listed at rents lower than
what was originally achieved during the initial lease-up campaign. Chart 3 illustrates the
comparison of asking rates for turned over units in stabilized buildings versus the original
average net rents sought for those unit types during a building’s initial lease-up stage.

            LEASE RENEWAL RENTAL RATE CHANGES

 TH - 3 B D 1 B TH
                                                                    $1,190
                                                                        $1,283

  S TU D I O 1 B TH
                                                                        $1,269
                                                                                  $1,437

     3 B D 2 B TH
                                                                        $1,261
                                                                         $1,288

   2+D EN 2 B TH
                                                                                $1,414
                                                                                    $1,497

   2+D EN 1 B TH
                                                                      $1,223
                                                                       $1,245

     2 B D 2 B TH
                                                                                  $1,451
                                                                                      $1,561

   2 B D 1. 5 B TH
                                                                                  $1,458
                                                                                               $1,881

     2 B D 1 B TH
                                                                       $1,243
                                                                         $1,296

   1+D EN 1 B TH
                                                                                    $1,487
                                                                                      $1,531

     1 B D 2 B TH
                                                                               $1,399
                                                                                   $1,489

     1 B D 1 B TH
                                                                       $1,252
                                                                          $1,311

                      C U R R EN T A V ER A G E R EN T   I N I TI A L A V ER A G E R EN T

     Chart 3

Q2-2021 EDMONTON RENTAL TAKE: SPRING STABILIZATION                                               6
Rents have decreased for all unit types that turned over in Q2-2021;
• Studio units decreased by 12 percent ($168 per month);
• One bed, one bath units decreased by five percent ($59 per month);
• One bed, two bath units decreased by six percent ($90 per month);
• One bed plus den, one bath units decreased by three percent ($44 per month);
• Two bed, one bath units decreased by four percent ($53 per month);
• Two bed, one and a half bath units decreased by 22 percent ($423 per month);
• Two bed, two bath units decreased by seven percent ($110 per month);
• Two bed plus den, one bath units decreased two percent ($22 per month),
• Two bed plus den, two bath units decreased by six percent ($83 per month);
• Three bed, two bath units decreased by two percent ($27 per month);
• Three bed, one bath townhomes decreased by seven percent ($93 per month).
AVAILABLE TURNED OVER UNIT TYPES
198
168
77
50
34 30 28 37
23
6 9
Chart 4
The majority of units turned over in the second quarter of 2021 were one bed and two bed
plans. Two bed units located within inner city neighbourhoods are often rented by
roommates, which leads to a higher turnover rate. Smaller one bed units also have a
higher turnover rate than other unit types because renters eventually leave in search of
more living space as their housing needs mature. In other cases, the unit is occupied by a
couple who have been saving for a down payment on a home and are now able to
purchase.
Q2-2021 EDMONTON RENTAL TAKE: SPRING STABILIZATION 7AVERAGE NET RENT $PSF PER SUB-MARKET
$2.50
$2.07
$1.79
$2.00
$1.63
$1.61
$1.54
$1.51
$1.48
$1.50
$1.00
$0.50
$-
Q2-2020 Q3-2020 Q4-2020 Q1-2021 Q2-2021
Chart 5
Five of the seven submarkets in Edmonton experienced increases in average net rent per
square foot rates when compared to the previous quarter. This compares to just two
submarkets that experienced increases from Q4-2020 to Q1-2021. The largest increase
in rents occurred in the Northeast submarket, which increased by eight percent from
$1.40 to $1.51 per square foot. This increase is due to the new projects that launched
during the past two quarters; Fort Crossing by BCM Developments launched in April and
is achieving a blended net rent of $1.61 per square foot and Arcadia by Carlisle Group,
which launched in Q1-2021 is achieving a blended net rent of $1.49 per square foot. The
downtown submarket increased by one percent when compared to the previous quarter,
from $2.05 to $2.07 per square foot.
St. Albert and Southeast submarkets experienced decreases in average net rents when
compared to the previous quarter. St. Albert experienced a four percent drop in average
rents per square foot, decreasing from $1.69 to $1.61 per square foot while the average
net rent per square foot in the Southeast decreased by two percent ($0.03) to $1.48 per
square foot.
The Southwest and Sherwood Park submarkets both experienced a three percent
increase compared to Q1-2021. The average net rent per square foot in the Southwest
increased by $0.05 to $1.54 per square foot while the average net rent per square foot in
Sherwood Park also increased by $0.05 to $1.79 per square foot.
Q2-2021 EDMONTON RENTAL TAKE: SPRING STABILIZATION 8$1.70 VACANCY VS. NET RENTS $PSF
14% 14%
$1.69
$1.68 11% 12%
12%
$1.67
$1.66 10%
$1.66
8%
$1.65
$1.64 6%
$1.64
$1.64
$1.63
4%
$1.62
2%
$1.61
$1.60 0%
Avg $PSF Avg Occupancy Rate
Chart 7
Chart 7 illustrates the correlation between the average vacancy rate and the average net
rent per square foot in Edmonton’s newer purpose-built rental apartment market. Newer
purpose-built rental projects throughout Calgary experienced higher rents and lower
vacancy rates in the second quarter of the year. Vacancy rates decreased by three
percent and rents increased by one percent ($0.02 per square foot) when compared to
the first quarter of 2021. Vacancy rates decreased by one percent and rents decreased
by one percent ($0.02 per square foot) year-over-year. UA expects this trend to continue
as COVID-19 restrictions are lifted and more renters return to the market.
Q2-2021 EDMONTON RENTAL TAKE: SPRING STABILIZATION 9ACTIVE VS. FULLY LEASED PROJECTS
UA considers new projects that have less than 85 percent occupancy to be actively
leasing, and those with more than 85 percent occupancy to be fully leased or stabilized,
as this is typically when units begin to turn over for the first time. There were 24 projects
considered to be actively leasing in Edmonton at the end of Q2-2021. Two projects
achieved fully leased status during the second quarter; Gill Estates by Gill Built Homes, a
114-unit wood frame building in the northwest leased up within 13 months, and Hampton
Heights by Casa Homes, a 32-unit townhome project located in the southwest that leased
up in nine months.
A few active projects include;
• Capital Building 1 (154 units), leasing for 11 months and currently 32 percent leased.
• The George (50 units), leasing for nine months and currently 82 percent leased.
• Augustana (240 units), leasing for nine months and currently 14 percent leased.
ACTIVE VS FULLY LEASED PROJECTS BY SUB-MARKET
Downtown Northeast Northwest Southwest
12% 10% 6%
44%
56%
88% 90% 94%
Southeast Sherwood Park St. Albert
17% 25%
75%
83% 100%
Fully Leased Active
Chart 8
Q2-2021 EDMONTON RENTAL TAKE: SPRING STABILIZATION 10AVAILABILITY IN Q2-2021
The Downtown submarket continues to have the highest inventory levels of all
submarkets, mostly due to the new projects launched in the area over the past few
quarters that are still being absorbed. There were 1,324 available units in Downtown at
the end of the second quarter. Released inventory decreased across all submarkets when
compared to the first quarter of the year. Total released and available inventory in
Edmonton decreased by 386 units to 2,208 units.
Released and Available Units by Sub-Market
Downtown Northeast Northwest Southwest Southeast Sherwood Park St. Albert
1324 105 95 224 230 28 202
INCENTIVES
Both actively leasing and fully leased newer purpose-built rental buildings continue to
offer a range of incentives. 94 buildings in Edmonton offered some form of rental rate
incentive during the second quarter of the year. 14 of the 29 buildings not offering
incentives were fully leased this quarter. The following is a list of some incentives offered
as of May 2021;
٠ Two months free rent on 12-month lease ٠ Three months half rent
٠ Two months free rent on 14-month lease ٠ Discounted rents
٠ $500 off first months rent ٠ Free Telus for one year
٠ One month free rent on a 12-month lease ٠ $500 VISA gift card
٠ One month free rent on a 13-month lease ٠ Free early move-in
٠ No pet fee ٠ 50% off parking
٠ Reduced security deposit ٠ Six months free parking
٠ 50 percent off for first three months ٠ Free storage locker
٠ Four months half rent
Incentive offerings were reported in projects across all seven sub-markets in Edmonton.
Q2-2021 EDMONTON RENTAL TAKE: SPRING STABILIZATION 11AMENITIES
The newer purpose-built rental buildings UA currently monitors offer a range of
amenities. Projects in the urban sub-markets that feature a comprehensive amenity
package are more likely to achieve full occupancy sooner and have lower turnover than
those projects with limited or no amenities.
The level of amenities offered in newer rental developments generally depends on the
sub-market. Projects in the Downtown sub-market feature a higher level of amenities as
the typical Downtown renter earns a higher salary on average and is willing to pay more
for the added conveniences. A few examples of projects that offer these amenities
include: The MacLaren, which boasts a dog run, fitness area, roof terrace, yoga area and
lounge; and The Mayfair, which offers concierge service, garden plots, a lounge and a
gymnasium.
Rental projects in the outer sub-markets do not offer as many amenities as those in the
Downtown core. Typical renters in the outer markets are more price-sensitive and less
willing and/or able to pay more for a higher-end amenity package. However, UA has
noted a few new projects in suburban neighbourhoods that are improving their
respective amenity offerings. Central Tower in Bearspaw offers residents a common
kitchen area and outdoor patio with BBQ’s, as well as a spin studio, golf simulator,
fitness facility, pool tables, yoga area, parcel delivery system, and a dog wash station.
The following provides a list of typical common amenities offered to renters in the
Edmonton market:
• Roof Terrace • Gymnasium • Car Share
• Roof Garden • Guest suite • Garden plots
• Music Room • Kitchen • Residence manager
• Outdoor Patio • Fitness area • Games Room
• Workshop • BBQ area
• Lounge • Bike storage
• Bike Repair area • Concierge
Q2-2021 EDMONTON RENTAL TAKE: SPRING STABILIZATION 12RENTER DEMOGRAPHIC There is generally a wide range of renter profiles active throughout the various Edmonton sub-markets. The outer sub-markets tend to attract more immigrants, blue- collar workers, young families and retirees. Larger units with more bedrooms is generally an attractive feature for renters in the outer sub-markets. The more urban sub-markets currently attract more students, young and established professionals, downsizers, and young couples. Amenities, and social gathering spaces to counter the smaller units in the inner city have been anecdotally communicated as being very desirable for these renter groups. CONTEMPLATED UA is currently monitoring 125 development permits (23,790 units) that have been submitted to the City of Edmonton. Of those, 34 permits (6,679 units) are currently on hold. 43 projects comprising 10,439 units have been approved by the City and are expected to come to market over the next two to three years. UA anticipates 26 of these buildings will be ready to commence leasing in the next two years, which will add over 4,230 new rental apartment units to the market, LOOKING AHEAD The following are new rental projects that have either recently launched or will be launching a leasing campaign during the next two quarters that UA will be monitoring closely: ٠ 121 West –Regency Developments ٠ Stadium Yards Building 2 - Rohit ٠ Greenstone Park – Abbey Lane Homes ٠ Slate – Kooner Construction ٠ Brickyard off 4th – Cove Properties ٠ CX Grandin - Cantiro Q2-2021 EDMONTON RENTAL TAKE: SPRING STABILIZATION 13
UA has the most current and accurate data on the newer purpose-built rental apartment
markets in Edmonton, Calgary, Metro Vancouver, and Greater Toronto. NHSLive, UA’s
online data platform, provides timely data on the new rental and multi-family home
sectors of the market. With its user-friendly interface and extensive functionality, it has
become an invaluable tool for thousands of industry stakeholders to make better
decisions. Call or email sales@urbananalytics.ca today to schedule a demonstration of
NHSLive.

With the anticipated increased competition in Edmonton’s new purpose-built rental
apartment sector and the ongoing uncertainty in the new condominium and townhome
sectors of the market, it is crucial to ensure your project is appropriately designed and
positioned prior to launching. UA provides comprehensive advisory services to meet your
firm’s specific needs in all markets we service. Call or email today to ask how we can help.

 We appreciate your feedback. Please contact us with any questions regarding this UA
 Take or any of our other periodic publications.

                                URBAN ANALYTICS INC.
                                     (403) 294-0135
                            info-alberta@urbananalytics.ca

Q2-2021 EDMONTON RENTAL TAKE: SPRING STABILIZATION                                  14
You can also read