THE UA TAKE - FIRST QUARTER 2018: Urban Analytics

Page created by Henry Tyler
 
CONTINUE READING
THE UA TAKE - FIRST QUARTER 2018: Urban Analytics
THE UA TAKE – FIRST QUARTER 2018:
                           STRONG SALES IN SPITE OF SPEED BUMPS
Entering the first quarter of 2018, there were several factors new multi‐family home market stakeholders
were monitoring closely. The first quarter of the 2018 saw the implementation of the ‘Stress Test’
mortgage qualification rules as of January 1st, and a series of policies introduced by the provincial
government, primarily in the form of new taxation for foreign buyers, owners of homes valued at over
$3 million and secondary home owners, as part of its budget. The impact of the new stress test rules is
not likely to be felt until the second quarter of the year, given many prospective purchasers with the
intention to enter the housing market prior to the end of 2017 would likely have sought to obtain
mortgage pre‐approvals ahead of the new rules’ implementation.

As for the provincial government’s new taxation policies, it appears
the Finance Minister chose to ignore any input from numerous
stakeholders in the housing industry, or simply failed to make an
effort to understand the complex forces driving the housing
market in Metro Vancouver and elected to introduce measures
targeting demand for housing. There was not a single
acknowledgement of the lack of or slow pace of approvals of new
market‐oriented housing supply into the market. While the
government should be applauded for its intentions to increase the
supply of below market and affordable rental housing supply in the
region (despite serious doubts about how it will find the labour
resources required to meet its ambitious targets for new
affordable housing units), it will in time recognize that none of the demand‐targeted taxation policies it
introduce will have no long‐term impact on the market housing affordability challenges facing Metro
Vancouver.

As the data and analysis that follows illustrates, the new multi‐family home sector of Metro Vancouver’s
housing market continued to achieve strong sales in the first quarter of 2018. This is not to say there
aren’t headwinds ahead for this sector of the market as it confronts growing uncertainty among new
home buyers regarding general conditions in the market here. Unfortunately, as the level of rhetoric
from all sides of the housing issue escalates, some prospective buyers begin to question whether to delay
their purchasing decision to see whether conditions and product prices soften. Stakeholders who
recognize these headwinds and adjust their pricing expectations will continue to experience strong
absorptions relative to historical averages. Stakeholders who don’t recognize the buyer uncertainty
regarding market conditions should budget for longer absorption periods as their projects will take
longer to sell.

Metro Vancouver UA Take – Q1‐2018                                                 urbananalytics.ca
                                                    1
THE UA TAKE - FIRST QUARTER 2018: Urban Analytics
The following provides an analysis of Q1‐2018 sales activity and the inventory status as at the end of the
quarter.
Sales and Inventory Analysis
In spite of the new challenges facing new home purchasers in the form of stricter mortgage qualification
rules, and the added uncertainty caused by the provincial government’s demand‐focused policies
introduced as part of its budget, new multi‐family home sales in the first quarter of 2018 increased by
over 16 percent over the same quarter in 2017.

                                                   QUARTERLY NEW MULTI‐FAMILY HOME SALES
 7,000

 6,000

 5,000                                                                                                                               4,514

 4,000                                                                                                                                   3,557

 3,000

 2,000
                                                                                                                                         957
 1,000

                           0
                               Q1‐2010   Q1‐2011    Q1‐2012        Q1‐2013      Q1‐2014    Q1‐2015         Q1‐2016    Q1‐2017     Q1‐2018

                                                           Total          N. of Fraser      S. of Fraser
 Chart 1

Part of the increase in year‐over‐year sales can be attributed to the 47 percent increase in new
condominium and townhome units released in the first quarter of this year compared to 2017. There
was one fewer project launched in Q1‐2018 as in the same quarter in 2017, meaning the amount of
competitive supply in the market (i.e. the number of actively selling projects competing for buyers at any
given time) remained largely unchanged.

                                           YTD RELEASED PRODUCT AND UNIT SALES
                               7,000                                                                                                40
 # Units Released & Sold

                               6,000                                                                                                35
                                                                                                                                    30
                                                                                                                                                 # Projects Launched

                               5,000
                                                                                                                                    25
                               4,000
                                                                                                                                    20
                               3,000
                                                                                                                                    15
                               2,000
                                                                                                                                    10
                               1,000                                                                                                5
                                   0                                                                                                0
                                         2012       2013           2014             2015     2016            2017         2018

                                                    Units Released            Units Sold      Projects Launched
  Chart 2

Metro Vancouver UA Take – Q1‐2018                                                                                    urbananalytics.ca
                                                                                2
THE UA TAKE - FIRST QUARTER 2018: Urban Analytics
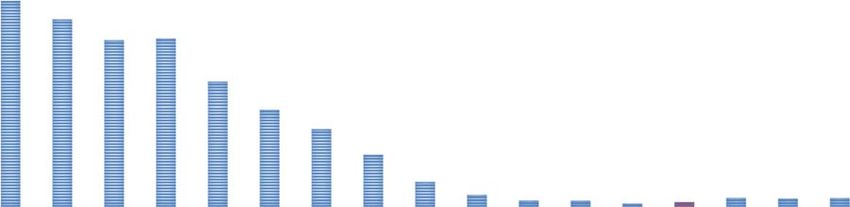
An increase in the number of new concrete condominium units released for sale in the first quarter
helped generate a substantial increase in sales as pent up demand in a number of markets helped absorb
much of the new product released, particularly in Burnaby, New Westminster and Coquitlam.

                                                             QUARTERLY UNIT SALES COMPARISON

                                                 3,544

                                                                 3,153
                                         2,240
                   2,028

                                                         1,844
                                 1,608

                                                                                                                    1,419
                                                                                                                            1,239

                                                                                                                                                                                   1,264

                                                                                                                                                                                                 1,003
           1,073

                                                                                          1,070

                                                                                                              972
                           909

                                                                                                                                                                             878

                                                                                                                                                                                           801
                                                                                                                                                                       807
                                                                                                        789
                                                                                    737

                                                                                                                                                     717
     675

                                                                                                                                                           629
                                                                              616

                                                                                                  588

                                                                                                                                               586

                                                                                                                                                                 533
                                                                                                                                    358
                       CONCRETE                                                           WOOD FRAME                                                       TOWNHOMES
                           Q1‐2010                Q1‐2011                Q1‐2012          Q1‐2013             Q1‐2014                Q1‐2015         Q1‐2016           Q1‐2017              Q1‐2018
 Chart 3

New supply in the townhome sector also helped generate higher year‐over‐year sales. The fact just six
new wood frame condominium projects with a total of 324 units were launched in the first quarter
resulted in a substantial drop in sales in this sector compared the same quarter in 2017.

The spread in the number of new multi‐family homes sold in a quarter and the number of unsold units
at the end of that quarter widened by three percent in Q1‐2018 compared to the previous quarter. There
remains less than two months of supply of new multi‐family units as of the end of the quarter.
                                                 QUARTERLY SALES VS UNSOLD INVENTORY TREND
 10,000

  8,000

  6,000

  4,000
                                                                                                                                                                                             ‐1,911

  2,000

      0

                                                                            Total Sales                        Released Inventory
 Chart 4

Metro Vancouver UA Take – Q1‐2018                                                                                                                            urbananalytics.ca
                                                                                                        3
THE UA TAKE - FIRST QUARTER 2018: Urban Analytics
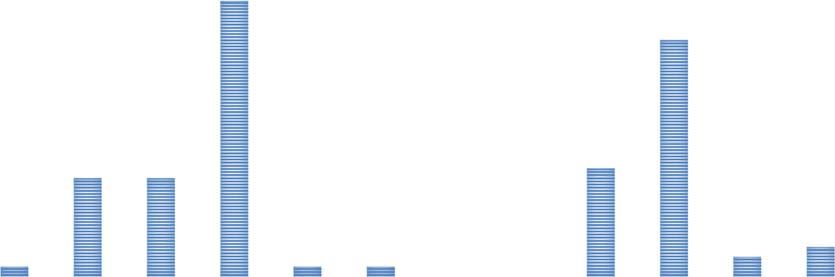
While there was a substantial increase in the amount of new supply released to the Metro Vancouver
market in Q1‐2018, a majority of the new units launched are located in just three municipalities. 67
percent of all new condominium and townhome units were released in Burnaby, New Westminster and
Coquitlam. The number of new multi‐family homes sold in the first quarter exceeded the number of units
released in all sub‐markets except for Burnaby/New Westminster.

                                     QUARTERLY UNIT SALES VS. UNITS RELEASED

                                                       2,199
                                               1,666

                                                                            687
                                                                            655
                                440
                               412

                                                                                                    336

                                                                                                                       338
                                                                                                    310
           174

                                         210
                         164

                                                                                                                     136
                                                                                                             162
          124

                                                                                                                               121
                                        120

                                                                 90

                                                                                    97
                        81

                                                                                                                              65
                                                                 49

                                                                                   70

                                                                                                            22
                                                                                              29
                                                           Units Sold        Units Released   0
 Chart 5

Not surprising given the miniscule amount of new wood frame condominium projects launched in Q1‐
2018, the number of unsold units in this sector dropped by 48 percent. The significant number of
concrete condominium units released during the first quarter led to a 21 percent rise in unsold inventory.
The number of unsold townhomes remained largely unchanged as strong pent‐up demand in the South
of Fraser sub‐markets absorbed much of the new supply released in that sector.

                                     RELEASED INVENTORY COMPARISON
                           5,577
                        4,936
                        4,934
                3,788

                                                                   3,086
             3,084

                                                                   3,061
                                                                2,427

                                                                2,339
                                                               2,193
     2,092

                                      2,028

                                    1,732
                                   1,437

                                                                                                    1,121
                                                                                                   1,010
                                                                                                   1,007

                                                                                                   1,003
                                                  1,000

                                                                                                   932
                                                                                    754

                                                                                                  646

                                                                                                 612
                                                                                                 610
                                                                                   499
                                                                                  259

                                                                                                227

                 CONCRETE                                        WOOD FRAME                             TOWNHOMES
                Q1‐2010 Q1‐2011           Q1‐2012              Q1‐2013 Q1‐2014        Q1‐2015      Q1‐2016 Q1‐2017 Q1‐2018
Chart 6

Metro Vancouver UA Take – Q1‐2018                                                                         urbananalytics.ca
                                                                        4
As expected at the end of 2017, the substantial increase in the number of new projects launched in
Burnaby and New Westminster resulted in that sub‐market experiencing the biggest increase in unsold
inventory. The fact some of these new projects were launched in the second half of the first quarter
contributed to the higher amount of unsold inventory in this sub‐market. While most newly launched
projects continue to achieve strong absorptions, the higher prices some new projects are attempting to
achieve are leading to sales at some of the new project slowing after the initial 60 to 70 percent of the
inventory is sold. Once again, the strong demand in South of Fraser sub‐markets that continues to exceed
supply led to lower inventory levels in the first quarter of the year.

                                                                                           RELEASED INVENTORY COMPARISON
                                        700
                                        600
                                        500
NUMBER OF UNITS

                                        400
                                        300
                                        200
                                        100
                                              0

Chart 7                                                                                                 Q4‐2017                  Q1‐2018

The number of completed and unsold units available to purchase in Metro Vancouver rose slightly from
the last quarter of 2017. There has been fewer than 100 move‐ready units available to purchase in all of
Metro Vancouver for seven consecutive quarters.

                                                                                  STA N D I N G I N V E N TO RY T R E N D
                                                  2,114

                                                          1,922

                                                                          1,726
                                                                  1,708
             Completed and Unsold Inventory

                                                                                   1,282

                                                                                            997

                                                                                                  798

                                                                                                           534

                                                                                                                     255

                                                                                                                           122

                                                                                                                                                          90

                                                                                                                                                                         89
                                                                                                                                                                83
                                                                                                                                     62

                                                                                                                                           61

                                                                                                                                                     50
                                                                                                                                                31

Chart 8

Metro Vancouver UA Take – Q1‐2018                                                                                                                    urbananalytics.ca
                                                                                                                 5
The recent completion of a few smaller projects along the Cambie Corridor resulted in an increase in the
number of move‐in ready unsold units in Vancouver West. New Westminster continues to feature the
highest number of completed and unsold units due to the unsold inventory at The Peninsula project in
the Port Royal neighbourhood. We anticipate a drop in this unsold inventory in Q2‐2018 as the developer
releases the balance of the product in this completed tower.

                                                           STA N D I N G I N V E N TO RY BY S U B ‐ M A R K E T
                               30                                                        28

                                                                                                                                                                                                        24
                               25
 COMLPLETED AND UNSOLD UNITS

                               20

                               15
                                                                                                                                                                                      11
                                                             10           10
                               10

                               5                                                                                                                                                                                           2
                                                                                                                                                                                                                                      3
                                                 1                                                          1                  1
                                      0                                                                                                            0                     0
                               0

                                                                                                                                                                                   Surrey / North
                                                                                      Burnaby / New

                                                                                                                                                 Ridge ‐ Meadows
                                                Van West

                                                                        Richmond/S.

                                                                                                                                                                                                    S. Surrey / White

                                                                                                                                                                                                                        Cloverdale
                                     Downtown

                                                             Van East

                                                                                                           North Shore

                                                                                                                              Tri‐Cities

                                                                                                                                                                        Squamish

                                                                                                                                                                                                                                     Abbotsford
                                                                                                                                                                                                                         Langley /
                                                                            Delta

                                                                                                                                                                                       Delta
                                                                                          West

                                                                                                                                                                                                           Rock
Chart 9

The number of new concrete condominium projects launched in Q1‐2018 led to a 21 percent increase in
number of unsold units in the the pre‐construction phase. Strong demand for townhome product
reduced the number of unsold units ‘under construction’ dropped by 56 percent from Q4‐2017.

                                     INVENTORY BY PRODUCT TYPE & CONSTRUCTION STATUS
                                                           1,571

                                                                                                                                                                                                                        383
                                                                                                                                                                                                       204
                                                                                                                                           156
                                                117

                                                                                                                         83
                                     44

                                                                                                                                                                                       25
                                                                                                      20

                                    CONCRETE CONDOS                                      WOOD FRAME CONDOS                                                                                TOWNHOMES

                                                              Standing                    Under Construction                                                       Pre‐Construction
Chart 10

Metro Vancouver UA Take – Q1‐2018                                                                                                                                                               urbananalytics.ca
                                                                                                                         6
Price Trends
Despite most new projects launched in the first quarter of 2018 achieving higher sale values than
previously released developments, there are indications of some resistance to projects testing the
market with what some prospective buyers might consider excessively higher sale values. This perceived
resistance is very project‐specific and is not causing any concern of a project not selling out or achieving
its presale goal; it’s simply resulting in slower absorptions than would have been achieved a year ago, or
if the developer had been less aggressive with pricing. The desire to achieve higher values is
understandable in some cases given the rising construction costs being experienced in the market. Some
of the higher sale values being sought can be attributed to developers wishing to build in a higher
contingency to allow for higher than anticipated increases in material and labour costs.

While greater uncertainty among prospective new home purchasers result in a flattening in achievable
new multi‐family home prices over the next several months, the continued trickle of new projects being
approved by municipalities throughout the region will limit the amount by which prices will fall through
the balance of 2018. New government policies targeting foreign buyers and secondary home owners
will have little to no impact on housing affordability in Metro Vancouver.

The following provides a summary of average sale values being sought for various product forms in
different Metro Vancouver sub‐markets and neighbourhoods:
      Vancouver West – New concrete condominium product launched along the Cambie Corridor
         during the first quarter is seeking average sale values of $1,500.
      Vancouver East – New concrete condominium product launched in Q1‐2018 achieved an
         average of $1,125 per square foot. Wood frame condominium product launched in Mt. Pleasant
         achieved below market‐average absorptions after seeking higher than anticipated sale values
         averaging over $1,300 per square foot.
      Richmond – Recently launched concrete condominiums are now seeking sale values exceeding
         $1,100 per square foot, while product expected to launch in Q2‐2018 will reportedly seek
         approximately $1,330 per square foot.
      Burnaby – As expected, new concrete condominium product launched in Q1‐2018 in both the
         Metrotown and Brentwood neighbourhoods exceeded average sale values of $1,200 per square
         foot.
      North Shore – Average sale values sought for new wood frame condominium product in North
         Vancouver continues to rise with new product anticipated to launch in Q2‐2018 expected to
         seek over $900 per square foot. New concrete condominium product could break the $1,300
         per square foot threshold. Larger townhome product targeting end users are experiencing
         slower absorptions as buyers are taking longer to sell their existing homes due to softer
         conditions in the detached resale sector of the market.

Metro Vancouver UA Take – Q1‐2018                                                  urbananalytics.ca
                                                     7
   Tri‐Cities – New concrete condominium product launched in Q1‐2018 achieved sale values
        ranging from $900 to $950 per square foot. Townhome product recently launched in Port
        Moody has successfully achieved an average sale value of nearly $711 per square foot.
       Ridge‐Meadows – Wood frame condominium product in this sub‐market is seeking average sale
        values of over $540 per square foot. Recently launched townhome product is seeking average
        sale values of over $380 per square foot.
       Fraser Valley – Concrete condominium product actively marketing in White Rock continues to
        encounter some resistance to product seeking overall average sale values exceeding $1,000 per
        square foot, leading to slower absorptions. Recently launched wood frame condominium
        projects in Surrey sought an average of $504 per square foot.
       New townhome product launched in Fraser Valley sub‐markets in Q1‐2018 is seeking the
        following average values:
            o Surrey/North Delta – $390 to $440 per square foot
            o South Surrey/White Rock – $440 per square foot
            o Langley/Cloverdale – $475 to $495 per square foot

Buyer Trends
The profile of active buyers of new multi‐family purhasers in Metro Vancouver in the first quarter of
2018 remained largely unchanged from previous quarters. Local investors, parents buying or helping
their kids and local end‐users continue to comprise the majority of concrete condominium buyers.
Luxury concrete condominium projects are attracting a primarily local end‐user purchasers along with
secondary purchasers from outside the City attracted to the more exclusive condominium product in
Downtown Vancouver. Absorptions for higher priced condominium product in some Vancouver West
neighbourhoods is expected moderate as downsizers may be reluctant to commit to a purchase without
knowing what they’re able to sell their current home for.
The provincial government’s decision to increase the Foreign Buyers’ tax to 20 percent is expected to
lead to a softening in demand from off‐shore buyers over the next two to three quarters. However, the
fact this segment of buyers generally makes up less than 10 percent of the overall buyer mix will minimize
the impact on the market as a whole.
Strong absorptions at new townhome projects launched in the South of Fraser sub‐markets indicates the
reduction in buying power caused by the implementation of the stress test rules may have led to
increased demand for townhomes from buyers who might have otherwise purchased a detached home.
The same scenario may materialize in the wood frame condominium sector once more of this product
form is released to the market.
With respect to ethnicity, local Asian buyers (primarily Chinese) continue to be the dominant buyer
profile at preselling concrete condominium projects in the urban sub‐markets. There are also indications
of increasing demand among local Korean purchasers. South Asian buyers continue to be active in South
of Fraser sub‐markets.

Metro Vancouver UA Take – Q1‐2018                                                 urbananalytics.ca
                                                    8
Looking Ahead
The announcement of several new demand‐oriented taxes in the provincial government’s budget did
little to ease uncertainty among prospective buyers of new multi‐family home product in Metro
Vancouver. Looking ahead, UA anticipates uncertainty will continue to be a key factor that developers
launching new projects will need to monitor as they attempt to appropriately position that new product
in the market to achieve required absorptions. Some of the more noteworthy projects UA expects to
launch over the next two quarters and will be monitoring closely include:
       Fifteen Fifteen – Downtown Vancouver
       Cambie Gardens – Vancouver West
       8888 Osler – Vancouver West
       Coco Oakridge – Vancouver West
       Winston – Vancouver West
       View Star (Bldg E) – Richmond
       Atmosphere – Richmond
       Hampton Cove – South Delta
       Cirrus @ Solo District – Burnaby
       Bordeaux – Burnaby
       Gilmore Place – Burnaby
       City of Lougheed (Tower 3) – Burnaby
       Crest – North Vancouver
                                                                   Cirrus at Solo District ‐ Appia
       Park West – North Vancouver
       Marine + Fell – North Vancouver
       The Trails – North Vancouver
       Jumar – Squamish
       Squamish by Bosa ‐ Squamish
       Regan West – Coquitlam
       Kentwell – Coquitlam
       Victoria ‐ Coquitlam
       Montrose Square – Port Coquitlam
       The 222 – Ridge‐Meadows
       Linea – Surrey
       Coast at Fraser Heights ‐ Surrey
       Fraser Landmark ‐ Surrey
       La Voda Living ‐ Surrey
       Forest Ridge – South Surrey/White Rock
       Isola – South Surrey/White Rock
       Orchard Park – South Surrey/White Rock

Metro Vancouver UA Take – Q1‐2018                                               urbananalytics.ca
                                                  9
   Union Park – Langley/Cloverdale
       Luxia at Yorkson – Langley/Cloverdale
       Onyx at Mahogany ‐ Abbotsford
       Upper Montrose – Abbotsford

As always, UA looks forward to monitoring the sales progress of these and all other actively selling new
home projects and updating the data as it is collected on nhslive.ca.

In addition to the Multi‐Family Home platform on nhslive.ca, UA also offers subscription access to new
purpose built rental data and land transaction data on NHSLive. Please call for a demonstration of both
these products and to inquire about our advisory services to help you appropriately design and
position your next project.

                                       URBAN ANALYTICS INC.
                                           (604) 569‐3535
                                       info@urbananalytics.ca
                                    nhsrental@urbananalytics.ca
                                     nhsland@urbananalytics.ca

Metro Vancouver UA Take – Q1‐2018                                               urbananalytics.ca
                                                  10
You can also read