UK House Price Index - Hometrack
←
→
Page content transcription
If your browser does not render page correctly, please read the page content below
Research and Insight
                                                                                           July 2020 index
                                                                                           (published 27 August

UK House Price
                                                                                           2020)

Index
 Time to sell falls more than a quarter as homeowners shrug off recession fears

         +2.5%
         UK house price growth
                                           -31%
                                        Time to sell a home since
                                                                                   16 /20
                                                                                  Cities with house price
             % year on year            the lockdown lifted v 2019               growth over 2% per annum

                                 Executive summary
                                 •   Housing market conditions remain unseasonably strong.

                                 •   Supply/demand imbalance supporting headline rate of growth and has
                                     resulted in the time to sell a home falling 31% since the lockdown.

                                 •   Changing buyer requirements see 4/5 bed homes selling faster than flats.

                                 •   More new supply coming from wealthier demographics.
                                 •   House price growth of 2-3% by end of 2020.

                                 •   A major decline in UK house prices is unlikely despite onset of UK recession

“The ‘once in a lifetime’
 re-evaluation of
 housing requirements
 on the back of the
 lockdown is a
 counter-weight to
 the impact of the
 recession on the UK
 housing market.”
 Richard Donnell
 Research and Insight
 Director, Zoopla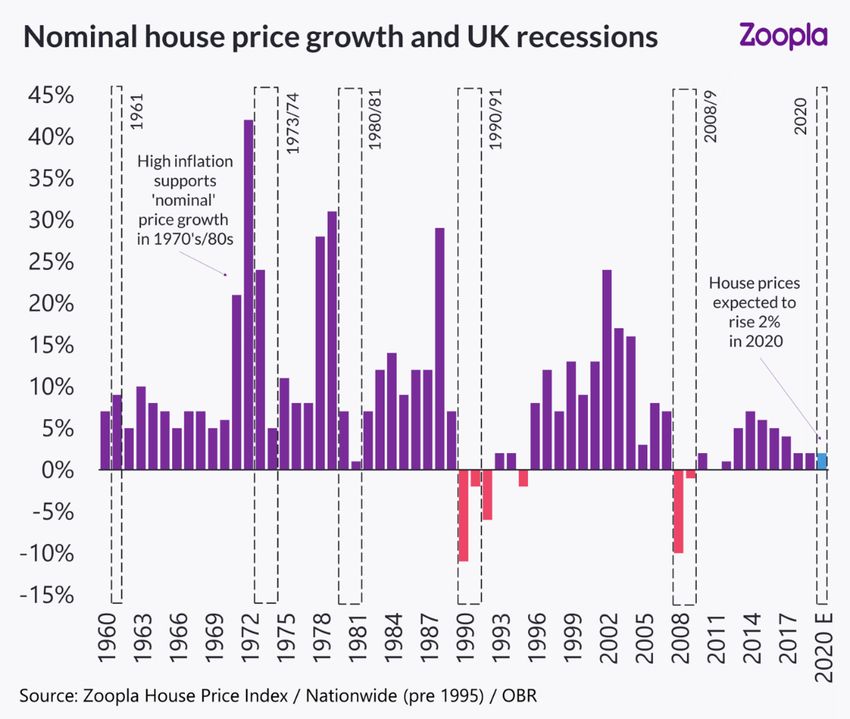
July 2020 | UK House Price Index | Page 2
2.5%
Annual UK house price inflation +2.5%
Housing market activity continues to run at its strongest level for over 5 years
on most measures. The number of new sales agreed per agent in August is 76%
Annual UK house
price growth above the 5-year average with a similar trend in demand while average sales
periods decline.
This is not just pent-up demand returning to the market. It also reflects the
impact of a once in a lifetime reassessment of the nation’s housing needs in the
wake of the 50+ day lockdown. Homeowners and renters are reconsidering
their housing requirements, characterised by a search for more space and
changing expectations for work and commuting patterns.
The strength of demand and sales is supporting the headline rate of UK house
price inflation which slowed to +2.5% in July from +2.7% in June. The 3-month
growth rate peaked at +1.1% in April on sales agreed before the lockdown and
has now almost halved to +0.6%.
UK house price index summary, July 2020
3-month % year Average
change on year price
Feb-2020 0.6% 2.2% £250,100
Mar-2020 0.8% 2.4% £251,000
Apr-2020 1.1% 2.7% £252,000
May-2020 1.0% 2.7% £252,700
Jun-2020 0.9% 2.7% £253,400
Jul-2020 0.6% 2.5% £253,600
House prices to increase over 2020 despite recession
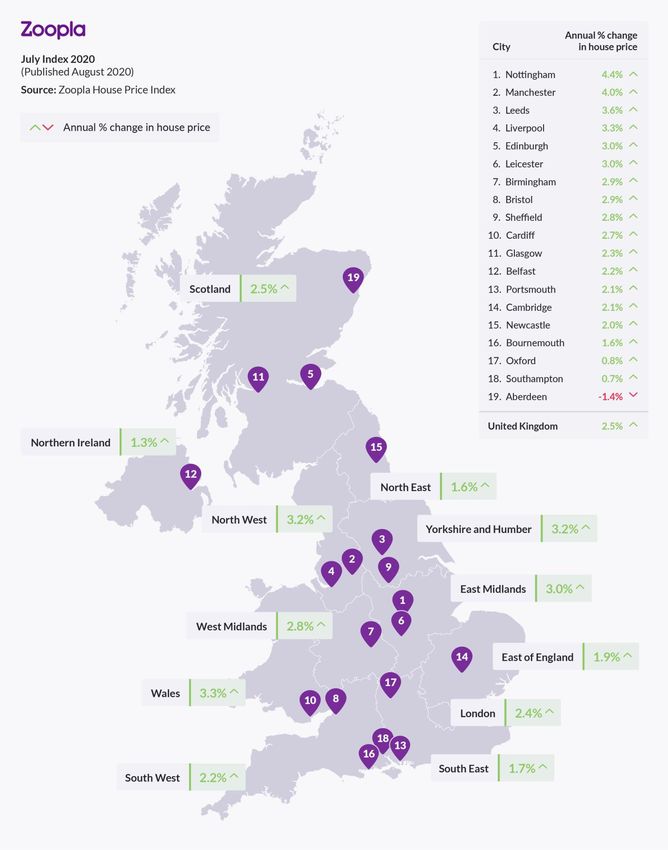
At a city level growth rates are holding steady with average prices rising at over 4%
per annum in Nottingham and Manchester and 16 of the 20 cities recording growth
of 2% or more. There is no sign of any immediate deterioration in price growth
despite the onset of economic recession. Government support for the economy has
been vital in supporting business and consumer confidence.
Looking back over the last 60 years there have been 5 recessions with nominal
house price falls recorded over the last two (1990/91 and 2008/9). These more
recent recessions were deeper and lasted longer than those before. Every recession
has different underlying drivers and the current one is no different. The most
important aspects for UK housing is the impact on household incomes, credit
availability, mortgage rates and unemployment.
While the economy has contracted sharply and unemployment is rising, consumer
spending has rebounded and purchasing manager indices are pointing to a wider
rebound in the economy. This is positive but the unwinding of the furlough scheme
and other Government support is the next challenge that will test the strength of
economic recovery. In the short term we still believe that house prices will end the
year 2% to 3% higher than at the start.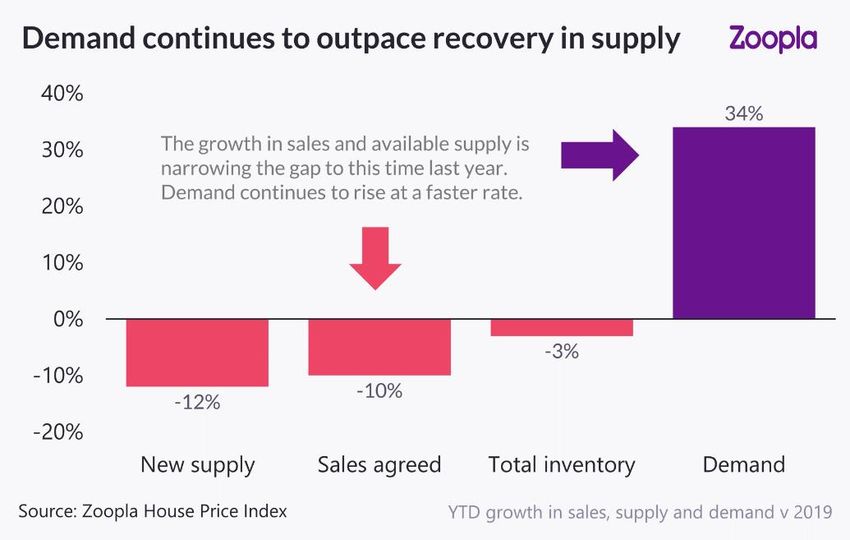
July 2020 | UK House Price Index | Page 3

-31%
Fall in the average time to sell
a home over the 90 days since
lockdown

                                   Market shows little sign of losing momentum
                                   The post lockdown rebound in the housing market shows little signs of slowing.
                                   The cumulative increase in buyer demand since the start of the year is +34%
                                   higher than over the same period in 2019. The growth in housing demand has
                                   moderated noticeably over August as the holiday season starts, but with many
                                   people staying in the UK housing market conditions remain strong.

                                   More demand brings increased numbers of sellers and more homes to the
                                   market. Over the last month the flow of new supply has been 50% faster than
                                   last year but the closure of the market means available inventory per agent
                                   remains 3% lower than a year ago. The supply/demand gap is slowly closing.

                                   Time to sell a home falls 31% post lockdown
                                   Homes are selling at a faster rate across all regions and countries. We calculate
                                   the time to sell from the date first marketed for sale to going under offer or
                                   ‘sold subject to contract’. It takes a further 3 months for a sale to complete and
                                   the buyer to finally move in.
                                   Our standard time to sell measure looks at the average days for homes selling
                                   over a rolling 180-day period. To allow for the market closure we have
                                   analysed the time to sell for homes that have sold over the last 3 months, since
                                   the lockdown lifted.

                                   At a UK level we find that homes are selling in 27 days. This is 31% lower than
                                   the same 3-month period last year, reflects the strength of demand. Homes are
                                   currently selling in less than a month across all regions and countries.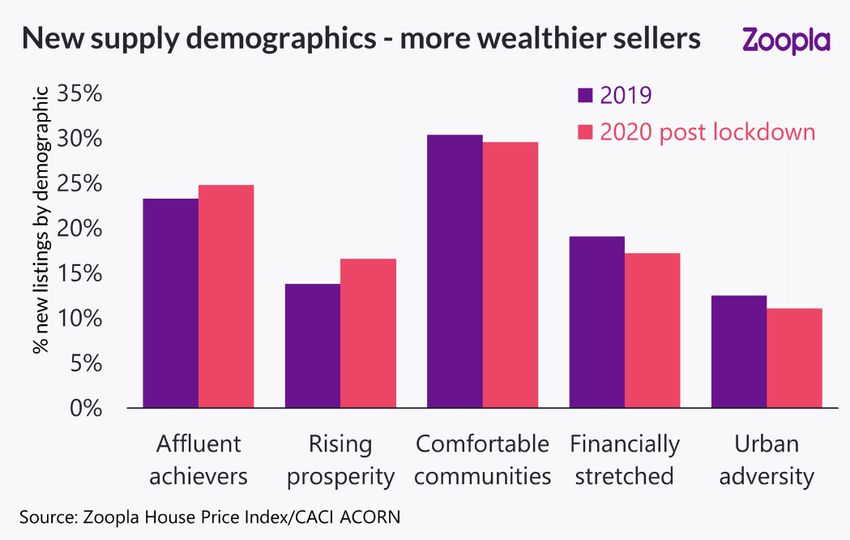
July 2020 | UK House Price Index | Page 4

24 days
                               Changing buyer priorities see houses selling faster than flats
                               The COVID crisis has shifted buyer expectations and requirements and this is
                               reflected in the time to sell between different types and size of home - again
Average time to sell a 3 bed
house since lockdown           focusing on homes sold over the last 90 days.
restrictions lifted            The three-bed house is the mainstay of the UK housing market, accounting for
                               just under half of all housing supply. Three-bed houses remain the fastest
                               selling properties with an average time to sell of just 24 days.

                               Zoopla’s tracking of supply and demand shows the greatest mis-match is for 3
                               bed houses. These are the most in-demand property type, but the proportion of
                               available supply falls short of demand across all parts of the UK.

                               At a regional level there has been noticeable jump in demand for 3 beds in
                               London and the S East of England as households seek out more space. Those
                               looking to buy in London may need to look outside the city to meet their needs.
                               In the West Midlands 60% of all applicant demand is for 3 bed houses.

                               Changing buyer requirements - as households prioritise more space and widen
                               their search criteria to find a home - has resulted in the time to sell 4 and 5 bed
                               houses falling by over a third compared to last year. Four bed houses are now
                               selling faster than the average flat.

                               Flats make up a quarter of homes for sale at present. Sales periods have also
                               declined but less than average resulting in flats having the longest time to sell at
                               an average of 32 days - still quick by historic standards.
                               While housing sales are running 76% ahead of the 5-year average not all homes
                               are flying off the shelves. The health warning with this analysis is that it tells us
                               about the homes that are selling i.e. where the property is well presented and
                               priced in line with demand in the local market. Even with strong market
                               conditions it is important that serious sellers do their research and talk to their
                               agent about pricing their home at the right level in order to achieve a sale.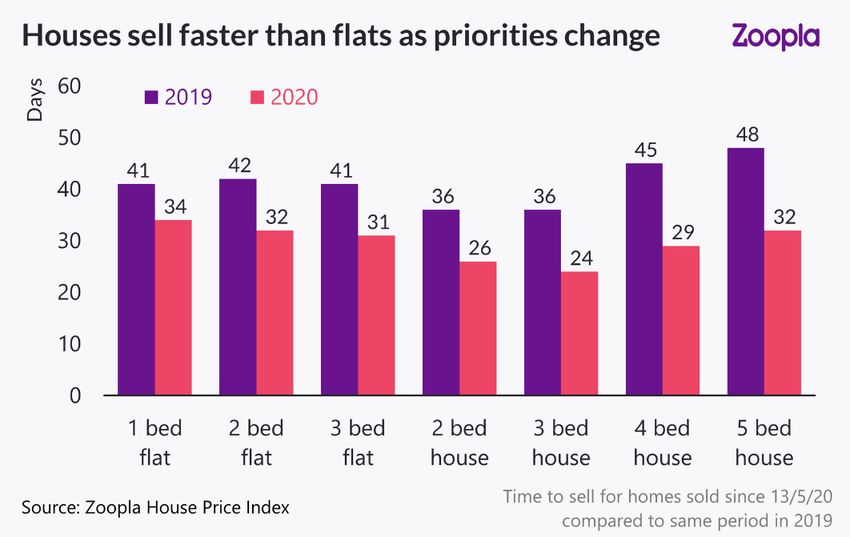
July 2020 | UK House Price Index | Page 5

60%
                              More new supply from wealthier demographics
                              The flow of supply onto the market is an important factor – most sellers are also
                              buyers although many buyers have nothing to sell e.g. first-time buyers.
Buyers in the West Midlands
want a 3 bed home             We have segmented new supply by the headline demographics for the
                              immediate locality of the property using CACI’s ACORN classification. This
                              reveals an increase in sellers in wealthier demographics, compared to 2019.
                              The share of new supply in other demographics has declined slightly. The
                              relative changes may appear small, but they are important in our view.

                              At its simplest level the analysis goes some way to explaining the strength of
                              the housing market at a time of recession and rising unemployment. With half
                              of all homeowners having no mortgage and a large portion of the remainder
                              having considerable equity in their homes, the constraints of affordability and
                              mortgage availability are not spread equally across buyers and sellers.

                              In addition, the demographic profile of households is not uniformly distributed
                              by geography. We believe part of this shift reflects an increase in activity in
                              London and south east England where housing sales volumes in 2019 were up
                              to 20% lower than in 2015. A soft repricing of the housing in these regions over
                              the last 5 years has improved affordability while the recent stamp duty changes
                              will have contributed to more homes coming to the market for sale.

                              Any changes to property taxation will shape market dynamics
                              The COVID crisis has pushed Government debt to an all time high of £2 trillion
                              and tax increases are on the horizon. It is too early to say to what extent the
                              Government consultation on Capital Gains Tax may be encouraging some
                              wealthier homeowners to bring forward decisions to sell. Housing accounts for
                              a large part of household wealth and tax policy related to property is set to be
                              the subject of increasing debate over the next decade. This will have knock on
                              impacts for the functioning of the wider market.
July 2020 | UK House Price Index | Page 6
+2-3%
Outlook – slow return to normality
The next important milestone for the housing market comes in September
when schools fully re-open and the UK starts to get back towards a full
Annual house price growth by
the end of 2020 reopening of the economy.
The near-term economic outlook is important in the context of housing market
activity but the impact of the lockdown on households and their housing
requirements presents a sizable counter-weight to a weakening economy. This
is especially true given the level of equity in the housing market and how many
households are mortgage free.
Mortgage reliant borrowers will be squeezed out at the margins by some
tightening in credit availability but there is a good chance that these buyers are
likely to be replaced by older, more-equity rich households who bring forward
decisions to move in response to the lockdown.
While demand has softened over August, we expect the current momentum in
market activity to continue into 2020Q4.
Recessions tend to hit sales volume more than prices
The impact on housing and house prices from recessions tends to be felt more
on housing sales than levels of pricing. The 1990/91 and 2008/09 recessions
resulted in sales volumes falling by more than 50%. Housing market volumes
are already low by historic standards and we expect sales to be 20% lower in
2020 as a result of the market being closed for almost 2 months.
A COVID recession but without the full bite for housing?
At present we do not foresee any major decline in UK house prices as a result of
the COVID induced recession. There are a range of factors underpinning this
view, including:
1. House prices are rising at low rates by historic standards and a major spike
in forced sellers seems unlikely currently as mortgage payment deferrals
and forbearance support mortgaged households. Credit remains available
for new borrowers not seeking high loan to value mortgages.
2. A portion of households has and will be adversely impacted by the
economic downturn. Unemployment is rising and appears more
concentrated in the younger age bands who tend to be renting rather than
homeowners.
3. The last two recessions have seen house prices bid up excessively ahead of
the downturn. While housing in parts of the country remains expensive,
mortgage regulations introduced from 2004 have restricted the ability of
borrowers to bid up the price of housing in the run up to this latest crisis.
This limits the downside for house prices in our view.July 2020 | UK House Price Index | Page 7 House Price Index – Country, region and city summary Note: The Zoopla house price index is repeat sales-based price index using sold prices, mortgage valuations and data for agreed sales. The index uses more input data than any other and is designed to accurately track the change in pricing for UK housing.
July 2020 | UK House Price Index | Page 8

                      Zoopla UK house price index and 20-city summary – July 2020

                                                    Average           %yoy           %yoy           Monthly              Annual
                                                      price          Jul-20         Jul-19            trend               trend

                       UK                         £217,600             2.6%           0.9%
                       20 city index              £253,600             2.5%           1.0%

                       Nottingham                 £158,500             4.4%           3.2%
                       Manchester                 £174,100             4.0%           3.6%
                       Leeds                      £169,900             3.6%           2.5%
                       Liverpool                  £122,900             3.3%           2.8%
                       Edinburgh                  £229,100             3.0%           4.4%
                       Leicester                  £183,300             3.0%           4.9%
                       Birmingham                 £167,700             2.9%           3.1%
                       Bristol                    £279,900             2.9%           1.3%
                       Sheffield                  £139,000             2.8%           2.3%
                       Cardiff                    £207,900             2.7%           2.8%
                       Glasgow                    £119,200             2.3%           2.4%
                       Belfast                    £137,000             2.2%           2.8%
                       Portsmouth                 £235,400             2.1%           0.4%
                       London                     £475,100             2.1%          -0.9%
                       Cambridge                  £415,400             2.1%          -0.9%
                       Newcastle                  £126,700             2.0%           0.3%
                       Bournemouth                £289,500             1.6%           0.3%
                       Oxford                     £398,700             0.8%          -0.3%
                       Southampton                £224,900             0.7%           0.2%
                       Aberdeen                   £145,100            -1.4%          -3.9%
                      Source: Zoopla House Price Index
                      Sparklines show last 12 months trend in annual and monthly growth rates – red bars are a negative value – each
                      series has its own axis settings providing a more granular view on price development

Contact               If you have any questions about our research please do get in touch.
                      Richard Donnell                                    David Ross
                      Director of Research & Insight                     Managing Director, Hometrack
                      richard.donnell@zoopla.co.uk                       dross@hometrack.com
                      020 3893 8403                                      020 3744 0410

Recent publications   Sign up for all the latest research from Zoopla at
                      advantage.zpg.co.uk
 UK
 Rental
 Market               The information and data in this report was correct at the time of publishing and high standards are
 Report
                      employed to ensure its accuracy. However, no reliance should be placed on the information
 2020 Q1
                      contained in this report and Zoopla Ltd and its group companies make no representation or
                      warranty of any kind regarding the content of this article and accept no responsibility or liability
                      for any decisions made by the reader based on the information and/or data shown here.
You can also read