Private Residential Market - REAL ESTATE DATA TRENDS AND ANALYTICS Q1 2021 - OrangeTee
←
→
Page content transcription
If your browser does not render page correctly, please read the page content below
Private Residential Market
REAL ESTATE DATA TRENDS AND ANALYTICS Q1 2021
▪ The overall price index
for private residential
properties rose by 3.3 per
cent in Q1 2021, the
steepest quarterly
increase since Q2 2018.
▪ Sales of luxury and city
fringe homes increased
significantly due to a few
mega launches in the
Core Central Region and
Rest of Central Region.
▪ Luxury homes hit their
highest quarterly sales in
over three years (since
last quarter Q3 2017) as more ultra-
high net worth individuals
and foreign investors
return.
• Foreign buying activities
rose to a one-year high as
more non-landed private
homes were bought by
non-permanent residents.
Private home purchases
by permanent resident
surged almost 30 per
cent quarter-on-quarter.
• Foreign demand is
expected to return with
more economies re-
opening and prospects of
further price growth.
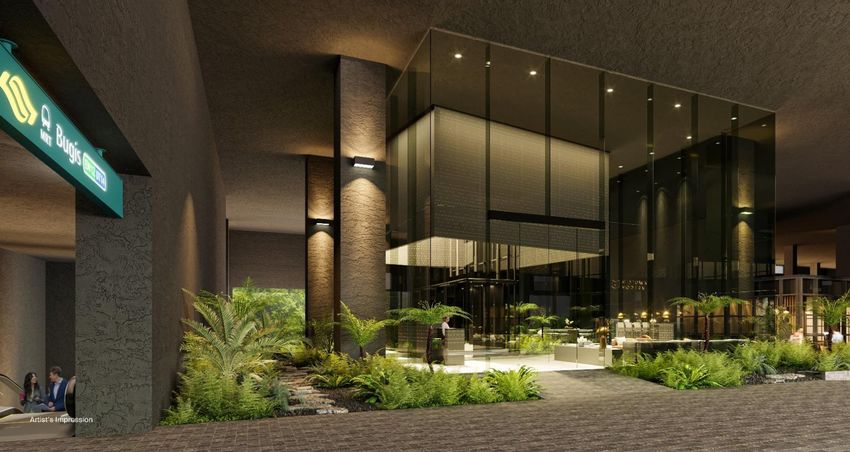
Artist Impression of Irwell Hill Residences
Page | 1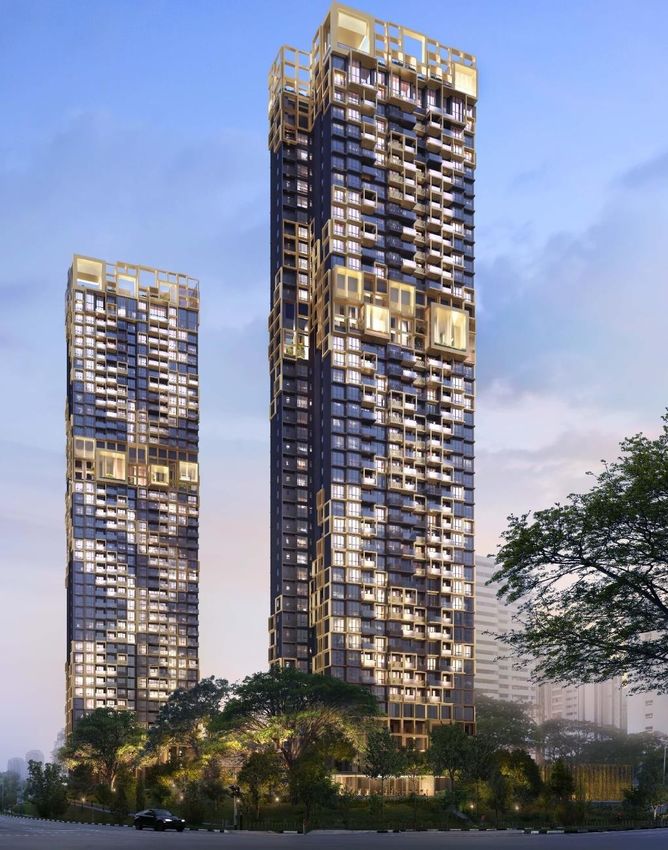
Singapore property prices rising in tandem with the global trend
                        Investors around the world are pouring                               Chart 1 Market summary
               money into the real estate and equity markets in
               hopes of a broad-based economic recovery. Pent-
               up demand bolstered by massive fiscal stimulus
               and still-low mortgage rates is propping up home
               prices worldwide. Property prices are accelerating
               across many countries including Australia, China,
               the U.S., parts of Europe, India and Canada. Home
               prices are hitting new highs in some cities.

                        Prices of private homes in Singapore have
               similarly increased in tandem with the uptrend
               observed globally. A combination of strong
               domestic demand for private homeownership and
               the resurgence of foreign investment demand has
               pushed home prices higher last quarter.

                       The overall price index for private                                   Table 1 Median price of non-landed homes
               residential properties rose by 3.3 per cent, higher                             Market          Type of                                      Q-o-Q %
               than the 2.1 per cent increase in the fourth quarter                           Segment           Sale           Q4 2020            Q1 2021   change
               of 2020, data from the Urban Redevelopment                                       Overall      All                $1,544            $1,682      8.9%
               Authority (URA) showed (Charts 1 & 2). This is the                                            New Sale           $2,703            $2,675     -1.0%
               fourth consecutive price increase and the steepest                                            Resale             $1,772            $1,853      4.5%
                                                                                                  CCR
               quarterly rise since Q2 2018 (3.4 per cent).                                                  Sub Sale           $2,227            $2,553     14.6%
                                                                                                             Overall            $1,974            $2,467     25.0%
                        The price increase in Q1 2021 was mainly                                             New Sale           $2,025            $1,827     -9.8%
                driven by non-landed homes in the Rest of Central                                            Resale             $1,361            $1,416      4.0%
                                                                                                  RCR
                Region (RCR) which rose by 6.1 per cent quarter-                                             Sub Sale           $1,823            $1,845      1.2%
                on-quarter (q-o-q). In contrast, the price increment                                         Overall            $1,704            $1,768      3.8%
                was less significant for the Outside of Central                                              New Sale           $1,632            $1,605     -1.7%
                Region (OCR) at 1.1 per cent while prices rose by                                            Resale             $1,065            $1,082      1.6%
                                                                                                 OCR
                0.5 per cent in the Core Central Region (CCR).                                               Sub Sale           $1,535            $1,605      4.6%
                Prices of non-landed homes in RCR and OCR have                                               Overall            $1,328            $1,290     -2.9%
                reached their record highs last quarter.                                      Source: URA, OrangeTee & Tie Research & Analytics

                                                                                             Chart 2 Prices rose the most in RCR
                        The price increase in Q1 2021 was driven
                by more sales of pricier city fringe
                homes. Normanton Park, which registered the
                highest transaction of 731 units were sold at an
                average price of S$1,765 psf. Further, many
                projects were transacted at an average price of
                S$2,000 psf and above. Among them were The
                Reef at King's Dock sold at an average price of
                S$2,304 psf (341 units), followed by Amber Park
                (S$2,438 psf, 97 units), Avenue South Residence
                (S$2,131 psf, 54 units) and One Pearl Bank
                (S$2,458 psf, 43 units). 8 units at Sky Everton were
                sold at S$2,740 psf while 4 units at Meyer
                Mansion were transacted at S$2,659 psf.

Terms of Use: The reproduction or distribution of this publication without the express consent of the author is prohibited. This publication is
provided for general information only and should not be treated as an invitation or recommendation to buy or sell any specific property or as        Page | 2
sales material. Users of this report should consider this publication as one of the many factors in making their investment decision and should
seek specific investment advice. OrangeTee.com Pte Ltd and the authors of this publication shall not accept and hereby disclaim all
responsibilities and liability to all persons and entities for consequences arising out of any use of this publication.
Copyright © OrangeTee & Tie Pte Ltd. All rights reserved.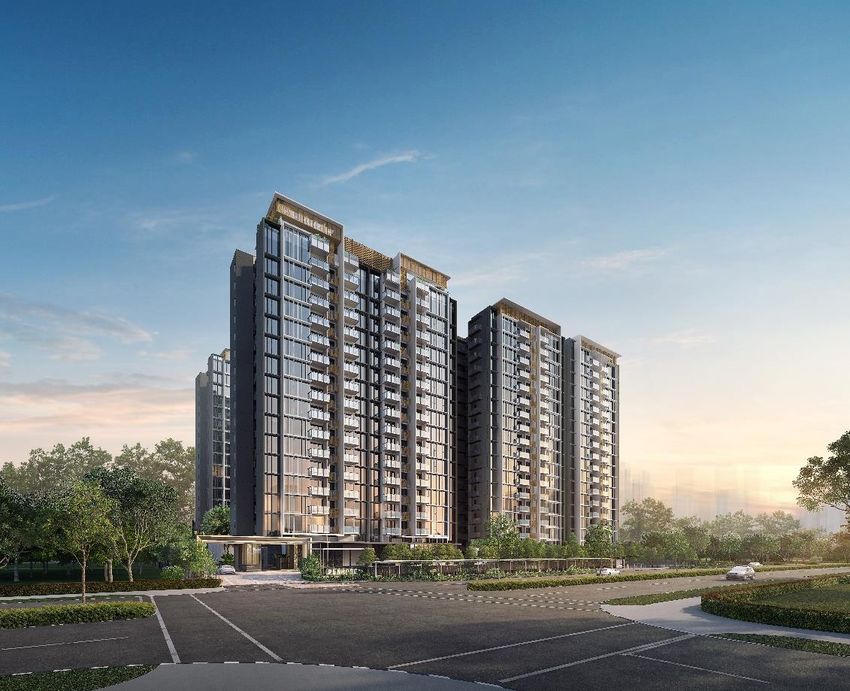
Chart 3 Sales exceeded the pre-pandemic 2019
                                                                                                   According to the quarterly statistics
                                                                                           released by the Urban Redevelopment
                                                                                           Authority (URA), 8,100 private homes excluding
                                                                                           EC were sold in Q1 2021, 16.9 per cent higher
                                                                                           than the 6,929 units transacted in the preceding
                                                                                           quarter (Chart 3).

                                                                                                   New home sales rose 34.2 percent
                                                                                           from 2,603 units in Q4 2020 to 3,493 units last
                                                                                           quarter. The number of resale transactions
                                                                                           increased 6.4 per cent quarter-on-quarter (q-o-
                                                                                           q) from 4,249 units in Q4 2020 to 4,519 units in
                                                                                           Q1 2021.

                                                                                                    Rumours of new cooling measures
                                                                                           sparked some panic buying at the beginning of
                                                                                           the year as some buyers rushed to secure units
                       More luxury new projects were
                                                                                           for fear that their buying eligibility could be
               transacted at an average price of S$2,400 psf.
                                                                                           affected by new measures. This also coincided
               Some of these projects include Midtown
                                                                                           with the launch of the mega projects
               Modern (S$2,774 psf, 366 units), RV Altitude
                                                                                           Normanton Park and the Reef at King’s Dock.
               (S$2,695 psf, 84 units), The M (S$2,637 psf, 36
                                                                                           Sales later slipped in February due to the
               units), Royalgreen (S$2,714 psf, 19 units),
                                                                                           Chinese New Year festivals but picked up
               Leedon Green (S$2,652 psf, 23 units) and The
                                                                                           slightly in March with the launch of the
               Avenir (S$3,039 psf, 18 units).
                                                                                           integrated project Midtown Modern.
             Table 2 Best-selling projects in Q1 2021
                                                                  Average Unit Price
             Project Name                          Units Sold         (SS$PSF)
                                               New Sale
             NORMANTON PARK                              730           $1,766
             MIDTOWN MODERN                              366           $2,774
             THE REEF AT KING'S DOCK                     341           $2,304
             TREASURE AT TAMPINES                        180           $1,385
             KI RESIDENCES AT BROOKVALE                  154           $1,768
             AMBER PARK                                   97           $2,438
             PARC CLEMATIS                                95           $1,656
             RV ALTITUDE                                  84           $2,695
             JADESCAPE                                    74           $1,804
             FORETT AT BUKIT TIMAH                        70           $1,967
             MIDWOOD                                      65           $1,644
             THE FLORENCE RESIDENCES                      62           $1,630
             AVENUE SOUTH RESIDENCE                       54           $2,131
                                                Resale
             REFLECTIONS AT KEPPEL BAY                    22           $1,638
             8 SAINT THOMAS                               22           $2,795
             EDEN                                         20           $5,039
             THE MINTON                                   19           $1,077
             WATERTOWN                                    19           $1,358
             SIMS URBAN OASIS                             19           $1,534
             CARIBBEAN AT KEPPEL BAY                      19           $1,511
             WATERBANK AT DAKOTA                          18           $1,571
             PARC ROSEWOOD                                18           $1,122
             BOTANIQUE AT BARTLEY                         18           $1,533
              Source: URA, OrangeTee & Tie Research & Analytics                                                              Artist’s Impression of The Atelier

Terms of Use: The reproduction or distribution of this publication without the express consent of the author is prohibited. This publication is
provided for general information only and should not be treated as an invitation or recommendation to buy or sell any specific property or as
sales material. Users of this report should consider this publication as one of the many factors in making their investment decision and should   Page | 3
seek specific investment advice. OrangeTee.com Pte Ltd and the authors of this publication shall not accept and hereby disclaim all
responsibilities and liability to all persons and entities for consequences arising out of any use of this publication.
Copyright © OrangeTee & Tie Pte Ltd. All rights reserved.
LUXURY SEGMENT                                                        Chart 4 Highest luxury sales since Q4 2012

               According to URA Realis data, 1,469 luxury
               homes were sold last quarter (Chart 4).
               This is the highest quarterly sales recorded
               since Q4 2012 (1,474 units). Of this
               number, 675 units were new sales and 792
               units were resale homes.

                        The average price of new non-
               landed luxury homes in CCR rose
               marginally by 0.5 per cent from S$2,704
               psf in Q4 2020 to S$2,718 psf in Q1 2021.
               Prices of resale non-landed homes rose at
               a faster pace of 3.9 per cent over the same
               period from S$1,907 psf to S$1,982 psf
               (Chart 5).

                       Last quarter, 675 new luxury                                   Chart 5 Prices rose for both resale and new sale condos
               condominiums were sold, highest since Q4
               2013 (738 units). Midtown Modern
               constituted more than half of the new sales
               inked last quarter with 366 units, followed
               by RV Altitude (84 units), The M (36 units),
               Fourth Avenue Residences (32 units),
               Kopar at Newton (24 units), Leedon Green
               (23 units), Royalgreen (19 units), and The
               Avenir (18 units) (Chart 6).

                       Sales      of     luxury     resale
               condominiums rose slightly. Last quarter,
               resale volume increased 3.3 per cent from
               635 units in Q4 2020 to 656 units. The
               most popular resale luxury project was 8
               Saint Thomas with 22 units transacted at
               an average price of S$2,795 psf, D’Leedon
               with 15 units transacted at S$1,670 psf and
                                                                                        Chart 6 Best-selling new projects in CCR (highest sales volume)
               Marina One Residences with 14 units
               transacted at S$2,556psf. The 20-unit Eden
               was fully sold at S$5,039 psf.

                       Sales of luxury landed properties
               remained robust last quarter. 136 landed
               homes changed hands in Q1 2021, the third
               consecutive quarter with more than 100
               transactions.

Terms of Use: The reproduction or distribution of this publication without the express consent of the author is prohibited. This publication is
provided for general information only and should not be treated as an invitation or recommendation to buy or sell any specific property or as     Page | 4
sales material. Users of this report should consider this publication as one of the many factors in making their investment decision and should
seek specific investment advice. OrangeTee.com Pte Ltd and the authors of this publication shall not accept and hereby disclaim all
responsibilities and liability to all persons and entities for consequences arising out of any use of this publication.
Copyright © OrangeTee & Tie Pte Ltd. All rights reserved.
Chart 7 Sales remained strong for third consecutive quarter                            MID-TIER SEGMENT

                                                                                                    Demand for city fringe homes remained
                                                                                                    strong for the third consecutive quarter.
                                                                                                    According to URA Realis data, 2,981 private
                                                                                                    homes (excluding EC) in RCR were sold, up
                                                                                                    39.7 per cent from the 2,134 units sold in Q4
                                                                                                    2020 (Chart 7).

                                                                                                           The average price of new non-
                                                                                                    landed homes dipped 2.7 per cent from
                                                                                                    S$2,043 psf in Q4 2020 to S$1,988 psf in Q1
                                                                                                    2021 (Chart 8). Conversely, prices of resale
                                                                                                    homes rose 3.5 per cent from S$1,375 psf to
                                                                                                    S$1,423 psf over the same period.

             Chart 8 Resale prices rose 3.5 per cent                                                         Last quarter, the most popular new
                                                                                                    projects were Normanton Park which sold
                                                                                                    730 units at an average price of S$1,766 psf,
                                                                                                    followed by The Reef at King’s Dock (341
                                                                                                    units, S$2,304 psf), Amber Park (97 units,
                                                                                                    S$2,438 psf), Jadescape (74 units, S$1,804
                                                                                                    psf), Forett at Bukit Timah (70 units, S$1,967
                                                                                                    psf) and Avenue South Residence (54 units,
                                                                                                    S$2,131 psf) (Charts 9 and 10).

                                                                                                            The best-selling resale projects
                                                                                                    were Reflections at Keppel Bay (22 units,
                                                                                                    S$1,638 psf), Sims Urban Oasis (19 units,
                                                                                                    S$1,534 psf) and Caribbean at Keppel Bay
                                                                                                    (19 units, S$1,511 psf).

            Chart 9 Best-selling new projects in RCR (highest sales volume) Chart 10 Best-selling new projects in RCR S$psf

Terms of Use: The reproduction or distribution of this publication without the express consent of the author is prohibited. This publication is
provided for general information only and should not be treated as an invitation or recommendation to buy or sell any specific property or as     Page | 5
sales material. Users of this report should consider this publication as one of the many factors in making their investment decision and should
seek specific investment advice. OrangeTee.com Pte Ltd and the authors of this publication shall not accept and hereby disclaim all
responsibilities and liability to all persons and entities for consequences arising out of any use of this publication.
Copyright © OrangeTee & Tie Pte Ltd. All rights reserved.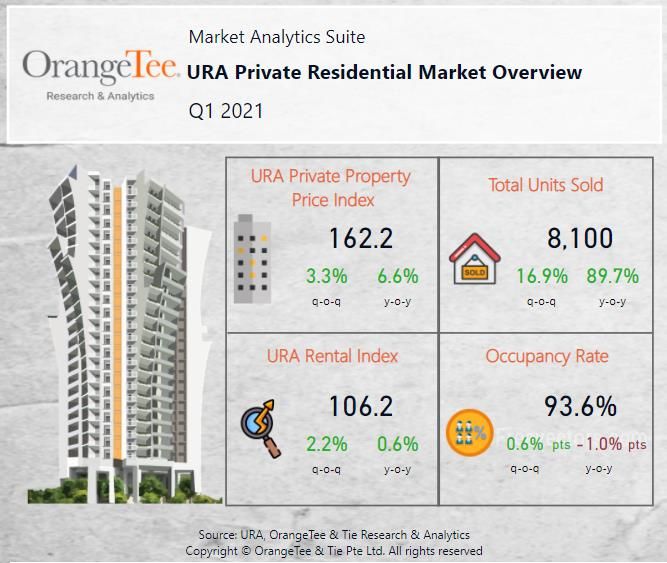
Chart 11 Fewer mass-market homes were sold
              MASS MARKET SEGMENT
              Fewer mass-market private homes
              were sold as there were no new
              launches in OCR last quarter. According
              to URA Realis data, 3,119 private homes
              excluding EC in OCR were sold in Q1
              2021, 18.5 per cent lower than the 3,828
              sold in the preceding quarter (Chart 11).

                       Resale homes formed the
              majority of sales (66.3 per cent, 2,067
              units) in Q1 2021, as opposed to 32.4
              per cent new sales (1,009 units). More
              resale homes were sold as supply of
              new homes in the OCR is dwindling and
              the unsold stock is fast diminishing.                                Chart 12 Prices rose for resale condominiums

                       Last quarter, the best-selling
              resale projects were The Minton (19
              units, S$1,077 psf), Watertown (19
              units, S$1,358 psf), Parc Rosewood (18
              units, S$1,122 psf), and Botanique at
              Bartley (18 units, S$1,533 psf).

                      The most popular new projects
              were Treasure at Tampines which sold
              180 units at an average price of
              S$1,385 psf, followed by Ki Residences
              at Brookvale (154 units, S$1,768 psf),
              Parc Clematis (95 units, S$1,656 psf),
              Midwood (65 units, S$1,644 psf), The
              Florence Residences (62 units, S$1,630
              psf), The Jovell (53 units, S$1,275 psf)
              and Riverfront Residences (46 units,                                 Chart 13 Best-selling new projects in OCR (sales volume)
              S$1,340 psf) (Chart 13).

                      The average price of non-
              landed mass-market new homes
              slipped by 3.0 per cent q-o-q to S$1,572
              psf in Q1 2021 while the average price
              of resale homes rose by 2.3 per cent to
              S$1,099 psf over the same period
              (Chart 12).

                      501 landed properties were
              transacted in OCR last quarter, fewer
              than the 603 units transacted in Q4
              2020.

Terms of Use: The reproduction or distribution of this publication without the express consent of the author is prohibited. This publication is
provided for general information only and should not be treated as an invitation or recommendation to buy or sell any specific property or as     Page | 6
sales material. Users of this report should consider this publication as one of the many factors in making their investment decision and should
seek specific investment advice. OrangeTee.com Pte Ltd and the authors of this publication shall not accept and hereby disclaim all
responsibilities and liability to all persons and entities for consequences arising out of any use of this publication.
Copyright © OrangeTee & Tie Pte Ltd. All rights reserved.
“   Pent-up demand bolstered by
      massive fiscal stimulus and
      still-low mortgage rates are
         propping up home prices
    worldwide. Property prices in
   Singapore are rising in tandem
              with the global trend.
                             ~ Christine Sun

                                                                                                                                                  Artist’s Impression of Penrose

                                                                                                     “

                                                                                                                                       Artist’s Impression of Midtown Modern

Terms of Use: The reproduction or distribution of this publication without the express consent of the author is prohibited. This publication is
provided for general information only and should not be treated as an invitation or recommendation to buy or sell any specific property or as     Page | 7
sales material. Users of this report should consider this publication as one of the many factors in making their investment decision and should
seek specific investment advice. OrangeTee.com Pte Ltd and the authors of this publication shall not accept and hereby disclaim all
responsibilities and liability to all persons and entities for consequences arising out of any use of this publication.
Copyright © OrangeTee & Tie Pte Ltd. All rights reserved.
Chart 14 Rental volume dipped last quarter

                                                                                                           RENTAL
                                                                                                                   According to URA data, rents
                                                                                                           rose higher by 2.2 per cent q-o-q in Q1
                                                                                                           2021 compared with 0.1 per cent in the
                                                                                                           preceding quarter (Chart 15). Fewer
                                                                                                           homes are available for lease in recent
                                                                                                           months and the reduced stock has
                                                                                                           helped prop up rents in recent months.
                                                                                                           Rental volume dipped 3.1 per cent q-o-q
                                                                                                           to 23,123 private homes in Q1 2021 from
                                                                                                           23,854 units in Q4 2020 (Chart 14).
                                                                                                           Compared to a year ago, rental volume
                                                                                                           rose 6.6 per cent y-o-y from 21,684 units
                                                                                                           in Q1 2020.
                 Chart 15 Rents rose last quarter
                                                                                                                     More Singaporeans have shifted
                                                                                                           back from overseas and are currently
                                                                                                           working in Singapore. Many PRs and
                                                                                                           long-term pass holders have also
                                                                                                           returned, which have pushed rental
                                                                                                           demand higher. There seem to be more
                                                                                                           inbound students, work pass holders and
                                                                                                           long-term visit pass holders looking for
                                                                                                           rental units as well. Many of these people
                                                                                                           are looking for accommodation near
                                                                                                           their schools and workplaces, which
                                                                                                           have helped prop up leasing demand for
                                                                                                           HDB resale flats and private homes in the
                                                                                                           city fringe and suburban areas.

                                                                                                                   Many tenants have renewed their
                                                                                                           leases and are staying put in Singapore
                 Chart 16 Overall occupancy rate rose to 93.6 per cent                                     as travel restrictions remain in place for
                                                                                                           many countries. Therefore, occupancy
                                                                                                           rates for private residential properties
                                                                                                           excluding EC remains high at 93.6 per
                                                                                                           cent last quarter (Chart 16).

                                                                                                                    Progressive changes have been
                                                                                                           made to re-open our country for
                                                                                                           international travel. As more travel
                                                                                                           restrictions continue to be lifted, rental
                                                                                                           demand may continue to improve in the
                                                                                                           coming months.

Terms of Use: The reproduction or distribution of this publication without the express consent of the author is prohibited. This publication is
provided for general information only and should not be treated as an invitation or recommendation to buy or sell any specific property or as     Page | 8
sales material. Users of this report should consider this publication as one of the many factors in making their investment decision and should
seek specific investment advice. OrangeTee.com Pte Ltd and the authors of this publication shall not accept and hereby disclaim all
responsibilities and liability to all persons and entities for consequences arising out of any use of this publication.
Copyright © OrangeTee & Tie Pte Ltd. All rights reserved.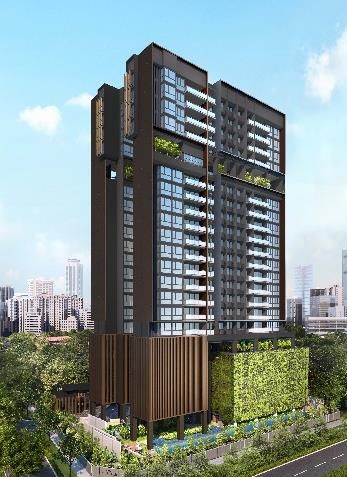
Chart 17 Higher proportion of homes bought by non-PRs and PRs
              NATIONALITY
              Foreign buyers seem to be coming back to
              Singapore. Last quarter, 281 non-landed
              homes (excluding EC) were bought by non-
              permanent residents, higher than the 199
              units transacted in Q4 2020 (Chart 18).
              This is also the highest volume inked since
              Q4 2019 when 284 units were sold then. In
              terms of proportion, the percentage of
              non-landed homes bought by non-PRs
              rose to 4.1 per cent in Q1 2021, from 3.3
              per cent in Q4 2020 and 3.6 per cent in Q3
              2020 (Chart 17).

                       The number of non-landed homes
              bought by PRs increased by 28.2 per cent
              q-o-q from 872 units in Q4 2020 to 1,118                               Chart 18 Foreign buyers are coming back
              units in Q1 2021 (Chart 18). The proportion
              of non-landed homes bought by PRs rose
              to 16.4 per cent last quarter from 14.4 per
              cent in Q4 2020. Consequently, the
              proportion of Singaporean purchases fell
              to 79.3 per cent from 81.9 per cent over
              the same period.

                      Mainland Chinese (Non-PRs and
              PRs) remained as the top foreign buyer.
              They purchased 339 non-landed homes
              in Q1 2021(Chart 19). This is followed by
              buyers from Malaysia (198 units), and
              India (170 units). All these numbers are
              expected to be higher as 398 units are
              still pending reclassification when
              caveats are being lodged and are                                     Chart 19 Americans are now the top 4 foreign buyers
              currently stated as Foreign Unspecified.

                       More Americans are buying
              private homes here and they have
              displaced Indonesians as the top-four
              foreign buyer here. Last quarter, buyers
              from the USA bought 58 non-landed
              homes, more than 45 units in Q4 2020
              and 40 units in Q1 2020. There were also
              more Taiwanese and Korean buyers. The
              number of Taiwanese buyers rose to 31
              units in Q1 2021 from 20 units in Q4 2020
              and 13 units in Q1 2020 and Korean
              buyers to 22 units in Q1 2021 from 20
              units in Q4 2020 and 9 units in Q1 2020.

Terms of Use: The reproduction or distribution of this publication without the express consent of the author is prohibited. This publication is
provided for general information only and should not be treated as an invitation or recommendation to buy or sell any specific property or as
sales material. Users of this report should consider this publication as one of the many factors in making their investment decision and should
                                                                                                                                                  Page | 9
seek specific investment advice. OrangeTee.com Pte Ltd and the authors of this publication shall not accept and hereby disclaim all
responsibilities and liability to all persons and entities for consequences arising out of any use of this publication.
Copyright © OrangeTee & Tie Pte Ltd. All rights reserved.
OUTLOOK
                                                                                                                 Q1 2021
                 Indicators                                          2018             2019         2020                            Projection for 2021
                                                                                                                 (Q-o-Q)
                 Overall
                 URA PPI Price Change                                7.9%             2.7%         2.2%            3.3%                  6% to 9%
                 Sales Volume (excl.EC) (units)                     22,139           19,150       20,909           8,100             23,000 to 26,000
                 New Sale (excl. EC)
                 Price Change                                       10.8%             7.6%         0.7%            8.2%                  6% to 9%
                 Sales Volume (units)                               8,795             9,912        9,982           3,493             10,000 to 11,000
                 Resale (excl. EC)
                 Price Change                                        2.7%             3.6%         -3.8%           5.4%                  6% to 9%
                 Sales volume (units)                               13,009            8,949       10,729           4,519             13,000 to 15,000
                 Rental (excl. EC)
                 URA Rental Index                                    0.6%             1.4%         -0.6%           2.2%                  0% to 2%
                 Leasing volume (units)                             89,904           93,960       92,537          23,123             85,000 to 95,000
                Source: URA, OrangeTee & Tie Research & Analytics

                              A recovering economy and still-low                                       Backed by the prospects of further price
                 mortgage rates may propel demand and prices of                                growth and better leasing environment, foreign
                 private
                Source:      homes
                        Data.gov.sg,      further.& Tie
                                     HDB, OrangeTee    The       rock-bottom
                                                            Research  & Consultancy interest   demand is expected to return stronger in the
                 rates ©may
                Copyright         mitigate
                            OrangeTee             theAll rights
                                       & Tie Pte Ltd.    impact       of property price
                                                                reserved.                      coming months. Countries across the world are
                 increases and keep mortgages affordable for                                   stepping up their coronavirus immunisation drive
                 borrowers. Despite the improving economic                                     and the vaccination regime is paving way for
                 outlook and expectations of higher inflation,                                 more cross-border travels to be restored this year.
                 interest rate hikes are unlikely to occur in the near                         Many countries are having ongoing discussions
                 term. The Fed has reiterated its commitment to                                on the mutual recognition of vaccine certificates
                 keep benchmark interest rates low through 2023.                               and to set up travel corridors for vaccinated
                 The lower interest rates may continue to draw                                 passengers. With the re-opening of global
                 new buyers to the property market.                                            economies, we may see more property buying
                                                                                               and rental activities from foreigners this year.
                         Further,     Singapore’s     economy      is
                 expected to see a strong rebound this year on                                         Barring new cooling measures, overall
                 higher growth prospects for the manufacturing                                 home prices may rise by 6 to 9 per cent in
                 and service sectors. According to the Ministry of                             2021. The supply of new mass-market homes will
                 Trade and Industry (MTI), our GDP growth                                      remain limited. In contrast, more luxury and city
                 forecast is at 4.0 to 6.0 per cent for 2021. Strong                           fringe projects are slated to be launched. The
                 external demand for electronics amid the global                               increased sales of such homes with higher price
                 tech up-cycle and higher pharmaceuticals output                               tags may uplift the overall priced index in the next
                 on surging vaccine roll-out, may sustain our GDP                              few quarters. Buyers looking for affordable
                 growth. The higher economic growth forecast will                              homes may turn to the resale market in the
                 lift buyer sentiment and lend support to                                      suburban regions or selected city fringe areas.
                 Singapore’s property market.                                                  Therefore, this year’s resale volume will likely
                                                                                               surpass the number sold in 2019 and 2020.

                   Please contact us for research inquiries

Terms of Use: The reproduction or distribution of this publication without the express consent of the author is prohibited. This publication is
provided for general information only and should not be treated as an invitation or recommendation to buy or sell any specific property or as
sales material. Users of this report should consider this publication as one of the many factors in making their investment decision and should
                                                                                                                                                  Page | 10
seek specific investment advice. OrangeTee.com Pte Ltd and the authors of this publication shall not accept and hereby disclaim all
responsibilities and liability to all persons and entities for consequences arising out of any use of this publication.
Copyright © OrangeTee & Tie Pte Ltd. All rights reserved.
You can also read