Rightmove House Price Index - The largest monthly sample of residential property prices
←
→
Page content transcription
If your browser does not render page correctly, please read the page content below
Rightmove
House Price Index
The largest monthly sample of
residential property prices

  November 2019
  National edition

   Copyright © 2019, Rightmove plc. Released 18th November. For media enquiries and interviews please
   contact the Rightmove press office: T | 020 7087 0605 M | 07894 255295 or E | amy.murphy@rightmove.co.uk

Under embargo for 00.01 hours, Monday 18 th November 2019

          Looming election deters sellers but cheaper prices tempt buyers

• The price of property coming to market falls by 1.3% (-£3,904) this month, and while drops are usual
  at this time of year it suggests opportunities for buyers to find a winter bargain
• 14.9% fewer new sellers than in the same period a year ago, deterred by lacklustre price growth and
  political uncertainty, the largest year-on-year slump in any month since August 2009
• In contrast, the number of sales agreed falls by just 2.9% compared to this time last year:
     • Larger properties (four bedrooms or more) are the most active sector, with just 1.4% fewer
       sales agreed compared to 2018, as buyers benefit from prices 1.2% cheaper than last year

                                                                National average asking prices
              Month                      Avg. asking price                  Monthly change                      Annual change       Index
         November 2019                        £302,808                              -1.3%                               0.3%        234.1
          October 2019                        £306,712                              +0.6%                              -0.2%        237.1

              Sector                     November 2019                        October 2019                     Monthly change   Annual change
         First-time buyers                    £191,001                           £190,740                               0.1%        1.3%
         Second-steppers                      £273,291                           £276,604                              -1.2%        0.5%
         Top of the ladder                    £525,633                           £543,949                              -3.4%       -1.2%

         Annual % change in new listings

            15%

            10%

             5%

             0%

            -5%

           -10%

           -15%

           -20%

          Rightmove measured 83,759 asking prices this month, circa 95% of the UK market. The properties were put on sale
          by estate agents from 13th October 2019 to 9th November 2019 and advertised on Rightmove.co.uk.

     2
                  Copyright © 2019, Rightmove plc. Released 18th November. For media enquiries and interviews please
                  contact the Rightmove press office: T | 020 7087 0605 M | 07894 255295 or E | amy.murphy@rightmove.co.uk
Overview
The price of property coming to market falls by 1.3% (-£3,904) this month, while the
number of new sellers drops by nearly 15%. Would-be sellers are not only faced with the
usual lower asking prices in the run-up to Christmas, but also a unique autumn combination
of a Brexit deadline followed by a looming general election. These circumstances have
proved to be a negative factor for thousands of prospective sellers, who have postponed
their marketing plans. In contrast, there is positive news for buyers with new seller asking
prices 1.3% cheaper than last month and virtually flat year-on-year, a portent of winter
bargain-hunting opportunities. The number of sales agreed remains resilient, just 2.9%
lower than a year ago, suggesting that there are still many buyers in the market to take
advantage of those opportunities.
Miles Shipside, Rightmove director and housing market analyst comments: “I’ve seen lots
of unusual events affecting the property market in my 40-year career, but a Brexit deadline
followed by a snap general election six weeks later is obviously a new combination for me
and for many thousands of buyers and sellers. Elections normally dampen activity as
uncertainty causes a degree of hesitation, but this one is being called to try to break the
deadlock after three years of uncertainty. A more certain outlook, whatever it may be,
would be a welcome change for those who are contemplating moving.”
14.9% fewer properties have come to market this month compared to the same period a
year ago. It is possible that some would-be sellers, who unlike most first-time buyers will be
liable for stamp duty on their onward purchase, may be waiting to see if whoever wins the
election goes on to reform stamp duty and thus reduce their cost of moving. This is the
largest year-on-year slump in new seller numbers in any month since August 2009. If this
reluctance to sell continues into next year’s spring selling season, the lack of new sellers will
have knock-on effects throughout 2020, potentially reducing housing market activity. In
contrast, the number of sales agreed nationally has fallen by just 2.9% compared to this
time last year, and two regions are up on last year, the North East (+4.2%) and Scotland
(+2.2%).
Shipside notes: “Our monthly poll of the housing market shows a clear swing towards
hesitation for prospective sellers, leading to buyers losing the extra choice that thousands
more newly-marketed properties would bring. In spite of this, buyers are continuing with
their purchasing plans, with the number of sales agreed only marginally down on a year ago.
Many buyers are getting on with their lives and making the most of the better negotiating
opportunities that the distractions of electioneering and the seasonal slowdown in the run-
up to Christmas can bring.”
Larger properties (detached houses with four bedrooms, and all types with five or more
bedrooms) are the most active sales sector at present, with the number of sales agreed
just 1.4% down compared to last year, a sign that demand from buyers due to changes in
everyday life like the need for more space carries on. Buyers in this upper-end bracket are
also benefitting from new seller asking prices 1.2% cheaper than a year ago.
Shipside adds: “With an average price tag of over half a million pounds, those with the
money are potentially in the money when it comes to year-on-year savings. Properties at
the top of the housing ladder have seen new sellers come to market an average of £6,142
cheaper than this time last year. If you are buying and selling in the same market, then what
you gain on the buying swings you may lose on the selling roundabouts. However, it does
seem that some would-be buyers who have hung back in this most expensive bracket are
now seeing an opportunity to engage.”
Miles Shipside, Rightmove director and housing market analyst says: “I’ve seen lots of unusual
events affecting the property market in my 40-year career, but a Brexit deadline followed by a
snap general election six weeks later is obviously a new combination for me and for many
thousands of buyers and sellers.”
3
Copyright © 2019, Rightmove plc. Released 18th November. For media enquiries and interviews please
contact the Rightmove press office: T | 020 7087 0605 M | 07894 255295 or E | amy.murphy@rightmove.co.ukAgents’ views
Glynis Frew, CEO of Hunters, said: “The reality is that the market will continue to
experience the Brexit jitters until the impasse in Westminster comes to an end. Nobody
really knows what’s around the corner so it’s understandable that some buyers have been
sitting tight and sellers haven’t been itching to bring their properties to market. The
general election has now been thrown into the mix too so that will add another layer of
uncertainty, or even opportunity for the more audacious buyers. There are many shrewd
buyers who have been wise enough to bide their time and capitalise on the political
uncertainty which, alongside the inevitable seasonal dip, offers a real opportunity for them
snap up a winter bargain this year. I’m sure the Boxing Day rush is going to be a manic one if
the last few years are anything to go by. The market keeps on ticking over as life goes on.
The family market’s relatively strong performance illustrates that the process of moving
house is one that transcends Brexit. People get married, have children and secure new jobs
all the time. Whilst there is little doubt that the market is facing its challenges, there is no
amount of politics that can stop the desire for people to find new homes.”
Louis Harding, Head of London Residential Sales at Strutt & Parker, said: “The biggest
challenge the London market faces is stock availability and consumer confidence has
played a big part in contemplating whether to sell in the current climate. Brexit and its
shifting deadlines has created uncertainty and this is further fuelled by the upcoming
election. Having said all of that, best-in-class properties are in demand and there is
significant competition amongst the buyers who are active. Despite continued uncertainty,
we are cautiously optimistic about the market in prime Central London; price expectations
between sellers and buyers has aligned and we expect our 2019 transactions numbers to
be comfortably up on the previous year. There is real pent up demand too, which is why the
Rightmove figures suggest that properties are selling faster; low stock is pushing people
who are in a position to move quickly, to make decisions fast and ensure they do not miss
out. We remain cautiously optimistic.”
Martin Platt, Director at Paul Rolfe Estate agents in Stirling and Linlithgow, said: “The Brexit
uncertainty doesn’t seem to have affected sales in our area of Scotland this year, as we’ve
already agreed the same number of sales so far this year as we did for the whole of 2018.
New stock remains tight but no worse than last year, and the properties that are selling the
best are at the top of the ladder, four and five bed family homes up to £450,000.”
4
Copyright © 2019, Rightmove plc. Released 18th November. For media enquiries and interviews please
contact the Rightmove press office: T | 020 7087 0605 M | 07894 255295 or E | amy.murphy@rightmove.co.ukAsking price trends
Five year asking price trend
£320,000
£310,000
£300,000
£290,000
£280,000
£270,000
£260,000
£250,000
£240,000
£230,000
£220,000
Nov-14 May-15 Nov-15 May-16 Nov-16 May-17 Nov-17 May-18 Nov-18 May-19 Nov-19
% monthly change in average asking prices
1.5%
1.1%
1.0%
0.9%
0.7%
0.6%
0.4% 0.4%
0.5% 0.3%
0.0%
-0.5%
-0.2% -0.2%
-1.0%
-1.0%
-1.5% -1.3%
-1.5%
-2.0%
-1.7%
Nov-18 Dec-18 Jan-19 Feb-19 Mar-19 Apr-19 May-19 Jun-19 Jul-19 Aug-19 Sep-19 Oct-19 Nov-19
5
Copyright © 2019, Rightmove plc. Released 18th November. For media enquiries and interviews please
contact the Rightmove press office: T | 020 7087 0605 M | 07894 255295 or E | amy.murphy@rightmove.co.ukAverage time to sell and stock
Average 'time to secure a buyer' (no. of days) - National
85
80 77
75
71
70
70 67
65
64 64
65 63
62 62 62 62
61
60
55
50
45
40
Oct-18 Nov-18 Dec-18 Jan-19 Feb-19 Mar-19 Apr-19 May-19 Jun-19 Jul-19 Aug-19 Sep-19 Oct-19
Average stock per agent (including Under Offer/Sold STC)
60.0
53.3 54.4 53.9 53.6
51.9 51.9 52.8
50.2 49.7
50.0 47.8
45.9 46.3
44.8
40.0
30.0
20.0
10.0
0.0
Oct-18 Nov-18 Dec-18 Jan-19 Feb-19 Mar-19 Apr-19 May-19 Jun-19 Jul-19 Aug-19 Sep-19 Oct-19
6
Copyright © 2019, Rightmove plc. Released 18th November. For media enquiries and interviews please
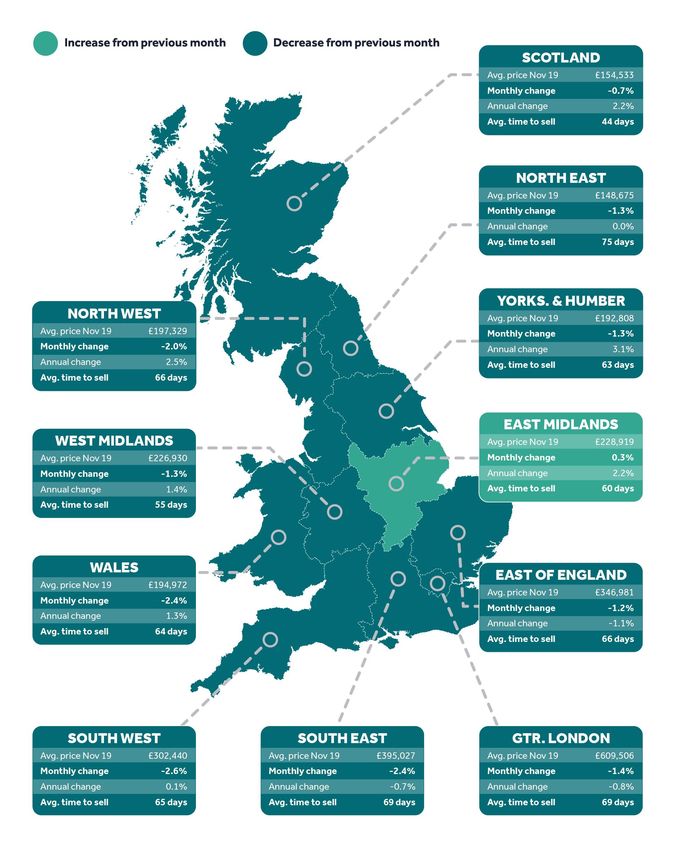
contact the Rightmove press office: T | 020 7087 0605 M | 07894 255295 or E | amy.murphy@rightmove.co.ukRegional trends
7
Copyright © 2019, Rightmove plc. Released 18th November. For media enquiries and interviews please
contact the Rightmove press office: T | 020 7087 0605 M | 07894 255295 or E | amy.murphy@rightmove.co.ukMonthly asking price trend
£320,000
£315,000
£310,000
£305,000
£300,000
£295,000
£290,000
£285,000
London trends
Average 'time to secure a buyer' (no. of days) - London
100
95
89
90
85 82 82
80 78
76
74
75 71 72
68 69 69 69
70 67
65
60
55
50
Oct-18 Nov-18 Dec-18 Jan-19 Feb-19 Mar-19 Apr-19 May-19 Jun-19 Jul-19 Aug-19 Sep-19 Oct-19
8
Copyright © 2019, Rightmove plc. Released 18th November. For media enquiries and interviews please
contact the Rightmove press office: T | 020 7087 0605 M | 07894 255295 or E | amy.murphy@rightmove.co.ukLondon trends
Borough data is based on a three-month rolling average and can be used as an indicator of overall
price trends in each borough over time. It is not directly comparable with the overall London
monthly figures.
Avg. price
Borough Monthly change Annual change
November 2019
Tower Hamlets £592,389 3.8% 3.5%
Southwark £659,973 0.9% 1.6%
Havering £409,678 0.2% 1.1%
Sutton £467,618 -0.3% 1.0%
Waltham Forest £486,268 -0.3% 0.6%
Bexley £411,276 0.4% 0.3%
Hackney £631,455 -2.1% 0.1%
Hillingdon £487,524 1.7% -0.1%
Newham £413,010 -0.4% -0.2%
Bromley £534,535 0.9% -0.2%
Barking and Dagenham £314,691 -0.8% -0.3%
Barnet £633,073 -0.5% -0.3%
Lewisham £455,224 -1.4% -0.4%
Redbridge £457,475 -0.3% -0.5%
Islington £750,333 -0.8% -0.5%
Greenwich £435,273 -1.9% -0.7%
Harrow £550,275 0.3% -1.0%
Hounslow £526,360 -0.7% -1.2%
Croydon £429,503 -1.3% -1.2%
Merton £623,219 -1.0% -1.6%
Ealing £544,339 -1.4% -1.8%
Kensington and Chelsea £1,570,219 -3.1% -1.8%
Haringey £592,041 -3.3% -2.0%
Camden £961,367 0.9% -2.1%
Hammersmith and Fulham £921,297 1.0% -2.2%
Westminster £1,412,920 2.2% -3.4%
Lambeth £612,791 -1.5% -3.6%
Brent £553,215 -2.6% -3.9%
Enfield £440,987 -1.8% -3.9%
Wandsworth £757,895 -1.9% -4.5%
Kingston upon Thames £579,250 -1.5% -5.9%
Richmond upon Thames £802,240 -1.7% -6.1%
9
Copyright © 2019, Rightmove plc. Released 18th November. For media enquiries and interviews please
contact the Rightmove press office: T | 020 7087 0605 M | 07894 255295 or E | amy.murphy@rightmove.co.ukEditor’s notes
About the Index:
The Rightmove House Price Index methodology was updated in January 2018. The report now includes data for
Scotland and a number of measures have been refined. The stock per agent figure now calculates the average based
on the number of properties an agent has on Rightmove each day across the month, rather than the average of the
total number of properties each agent advertised in the month. London asking prices are now broken down into travel
zones. For the purpose of historical comparisons, the historical figures have been restated based on the new
methodology.
The Index includes asking price breakdowns in the housing market to offer trends at three different sectors of the
market: first-time buyer, second-stepper and top of the ladder. Inner London prices have been excluded from this
categorisation as the normal housing ladder is not really applicable.
Advertising property for over 90% of all UK estate agents, Rightmove is in a unique position to identify any immediate
changes in the market. Rightmove’s House Price Index is compiled from the asking prices of properties coming onto
the market via over 13,000 estate agency branches listing on Rightmove.co.uk. Rather than being a survey of opinions
as with some other indices, it is produced from factual data of actual asking prices of properties currently on the
market. The sample includes up to 200,000 homes each month – representing circa 95% of the market, the largest and
most up-to-date monthly sample of any house price indicator in the UK. The Index differs from other house price
indicators in that it reflects asking prices when properties first come onto the market, rather than those recorded by
lenders during the mortgage application process or final sales prices reported to the Land Registry. In essence,
Rightmove’s Index measures prices at the very beginning of the home buying and selling process while other indices
measure prices at points later in the process. Having a large sample size and being very up-to-date, the Rightmove
Index has established itself as a reliable indicator of current and future trends in the housing market.
Rightmove measured 83,759 asking prices this month, circa 95% of the UK market. The properties were put on sale by
estate agents from 13th October 2019 to 9th November 2019 and advertised on Rightmove.co.uk.
Market sectors explained:
First-time buyer: This figure represents the typical property a first-time buyer would purchase, covering all two bed
properties and smaller that come to market (houses and flats).
Second-stepper: This figure represents the typical property of a person moving from their first home, covering all
three and four bed properties that come to market (houses and flats) excluding four bed detached houses.
Top of the ladder: This figure represents asking prices at the top end of the market, covering all five bed properties
and above (houses and flats), as well as four bed detached houses.
About Rightmove.co.uk:
Rightmove.co.uk is the UK’s leading property website, displaying details of homes for sale or rent to the largest online
audience. It is consistently ranked the number one property website in the UK (source: Experian Hitwise). It has circa
95% of all properties for sale and at any time displays a stock of over one million properties to buy or rent. The
Rightmove.co.uk site attracts nearly 141 million visits from home movers each month with time on site averaging 1.1
billion minutes per month (Rightmove data, July 2019).
10
Copyright © 2019, Rightmove plc. Released 18th November. For media enquiries and interviews please
contact the Rightmove press office: T | 020 7087 0605 M | 07894 255295 or E | amy.murphy@rightmove.co.ukYou can also read


