Stock Market Psychology: Using Gann-Chart and LSTM Model
←
→
Page content transcription
If your browser does not render page correctly, please read the page content below
International Research Journal of Engineering and Technology (IRJET)                                        e-ISSN: 2395-0056
          Volume: 08 Issue: 05 | May 2021                 www.irjet.net                                               p-ISSN: 2395-0072

          Stock Market Psychology: Using Gann- Chart and LSTM Model
                           Prasad Bhor1, Vishal Gupta2, Sagar Borate3, Archana Gulati4
       1B.E. Student, Dept. of Computer Engineering, Datta Meghe College of Engineering, Maharashtra, India
      2 B.E. Student, Dept. of Computer Engineering, Datta Meghe College of Engineering, Maharashtra, India
       3B.E. Student, Dept. of Computer Engineering, Datta Meghe College of Engineering, Maharashtra, India
         4Professor, Dept. of Computer Engineering, Datta Meghe College of Engineering, Maharashtra, India

---------------------------------------------------------------------***---------------------------------------------------------------------
Abstract - To understand the psychology of the stock                     selling trend of a particular stock for intraday trading to gain
market is to keep an eye watch on the numbers/prices of the              profit. A user basically can perform three actions at a
stock. The psychology in terms of the stock market is to                 particular given time that is buy a stock, sell a stock and hold
understand what is the best time to buy or sell a particular             a stock. Understanding psychology is to undertake the best
stock. This becomes difficult for the novice crowd entering the          action to gain profit. The selling trend is used by the bear
stock market because of which many times they end up with a
                                                                         cattle i.e., when the market is behaving in a bearish manner
great loss. This paper presents an extensive process that can
be used by both professional as well as novice users to predict          then one should sell the shares. The Buying Trend is used by
the future stock market value of a stock based on historical             the bull cattle i.e., when the market is behaving in a bullish
data. Moreover, our project will also help the user by giving an         manner then one should buy the shares. If the market is
end-to-end insight into the buying trend and the selling trend           constant, i.e., it is behaving in a sideways manner then one
of a particular stock for intraday trading to gain profit. All in        should hold up with the shares.
all, this paper will give you a walkthrough of two powerful
techniques namely the Long Short-Term Memory (LSTM) and                  2. LITERATURE SURVEY
Gann Chart theory which are used to predict future stock
prices. A comparison with respect to accuracy is then
                                                                         The initial focus of our literature review was to explore the
performed against an Arima model.
                                                                         existing systems used for sequence prediction. Subsequently,
Key Words: stock market, buying trend, selling trend,                    we then analyzed all the systems with respect to accuracy.
Long Short-Term Memory, Gann Chart theory                                This helped us to get an overview of existing systems and
                                                                         their drawbacks which we then overcome in our proposed
1.INTRODUCTION                                                           system. The paper” Sentiment Analysis for Effective Stock
                                                                         Market Prediction”, illustrates the correlation between the
Stock market prediction is one of the most debated topics on             stock market values and sentiments in RSS news feeds are
the internet. Today we see researchers and mathematicians                established. This trained model is used for prediction of
are continuously working to predict the future stock price to            stock market rates [1]. The model, which assumes the
yield significant profit. As the craze for the stock market              constancy of the residual term’s variance, is OLS. The
increases more and more people want to trade in the stock                findings based on this model indicate that day of the week
market to make significant gains. Preliminary to investing in            effect is present in the return equation [2]. The paper” Stock
the stock market one has to understand the psychology of                 Market Prediction Using Various Statistical Methods” is
the stock market which will require studying the stock                   concentrated on using several statistical methods for stock
market to a great extent. As we are aware not everyone has               market analysis and prediction. Specifically, the following
enough time and resources to study the stock market and                  methods would be discussed: Exponential Smoothing, Mean
many novice users stay skeptical to invest in the stock                  Square Error (MSE), and Autoregressive Integrated Moving
market. Hence this is where our paper comes in to picture,               Average (ARIMA) [3]. Time series analysis and forecasting is
we have proposed a methodology that one can use to predict               of vital significance; Time series data refers to an ordered
the future price of a stock and avoid losses while trading in            sequence or a set of data points that a variable takes at equal
the stock market. In this paper, we use two methods for                  time intervals [4]. After doing an intensive case study in
understanding the psychology of the market. One is using the             forecasting and analysis to predict the future prices of stock,
Gann-Chart theory and the other is the LSTM model. The                   we can conclude that the Gann theory for intraday trade and
Long Short-Term Memory, or LSTM, network is a special                    LSTM model for future price prediction is most preferable.
type of Recurrent Neural Network designed for sequence
problems. Moreover, our project will also help the user by
giving an end-to-end insight into the buying trend and the
© 2021, IRJET          |    Impact Factor value: 7.529               |    ISO 9001:2008 Certified Journal                 |    Page 4512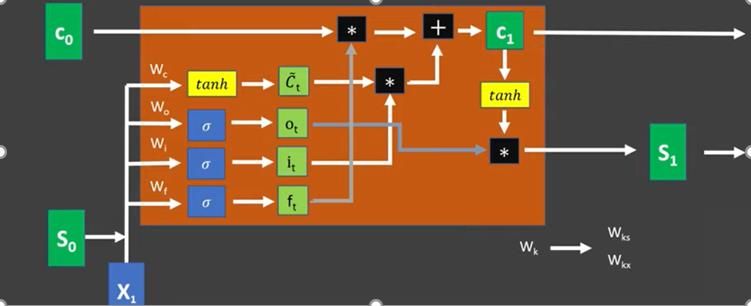
International Research Journal of Engineering and Technology (IRJET) e-ISSN: 2395-0056
Volume: 08 Issue: 05 | May 2021 www.irjet.net p-ISSN: 2395-0072
3. PROPOSED SYSTEM The Long Short-Term Memory, or LSTM, network is a type of
Recurrent Neural Network. Recurrent Neural Networks
We propose an application built on python modules that (RNNs)are a special type of neural network designed for
presents both the prediction by LSTM model and Gann-Chart sequence problems.
for intra-day trading. The prediction is done of one-day
Like RNNs, the LSTMs have recurrent connections so that the
interval.
state from previous activations of the neuron from the
previous time step is used as context for formulating an
3.1 Sequence Prediction Problems output. [ long-short-term-memory-networks-with-python]
The key challenge faced with RNNs is how to train them
Sequence prediction is the attempt to predict data values in effectively. Experiments show how difficult this was where
the sequence on the basis of the preceding data values. the weight update procedure resulted in weight changes that
Learning of sequential data continues to be a fundamental quickly became so small as to have no effect (vanishing
task and a challenge in pattern recognition and machine gradients).
learning. Applications involving sequential data may require
LSTM is an RNN architecture specifically designed to address
prediction of new events, generation of new sequences, or
the vanishing gradient problem. Additionally, LSTMs possess
decision making such as classification of sequences or sub- memory to overcome the issues of long-term temporal
sequences. dependency with input sequences.
- On Prediction Using Variable Order Markov Models, 2004.
LSTM consist of a cell, an input gate, an output gate and
Some of the examples of sequence prediction problems a forget gate. The cell remembers values over arbitrary time
include stock market prediction, weather forecasting, and intervals and the three gates regulate the flow of information
into and out of the cell.
product recommendation
The key to the memory cell is the gates. There are three
3.2 LSTM – an overview gates:
1. Forget Gate: Decides what information to discard
from the cell.
2. Input Gate: Decides which values from the input to
update the memory state.
3. Output Gate: Decides what to output based on
input and the memory of the cell.
The LSTM network decides for how long information about
specific past trends in stock price movement needs to be
retained in order to more accurately predict future trends in
the variation of stock prices.
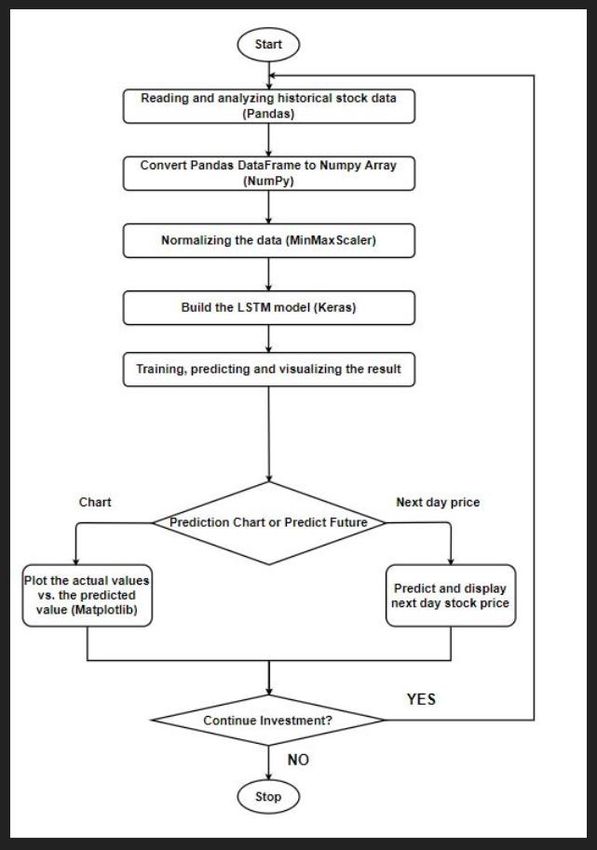
Fig. 1: An LSTM Model 3.3 Stock Prediction Algorithm
1.Start
2.Reading and analyzing historical stock data (Pandas)
3.Convert Pandas DataFrame to NumPy Array (NumPy)
4.Normalizing the data (MinMaxScaler)
5.Build the LSTM model (Keras)
6.Training, predicting, and visualizing the result.
Fig. 2: LSTM model equation 7.Plot the actual values vs the predicted value (Matplotlib)
8.Predict the next day stock price
9.Stop
© 2021, IRJET | Impact Factor value: 7.529 | ISO 9001:2008 Certified Journal | Page 4513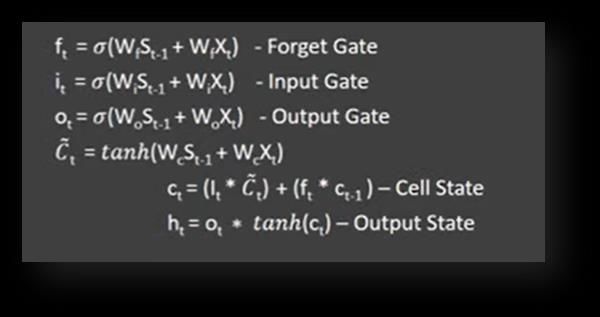
International Research Journal of Engineering and Technology (IRJET)                                e-ISSN: 2395-0056
        Volume: 08 Issue: 05 | May 2021              www.irjet.net                                          p-ISSN: 2395-0072

Stock Prediction Flowchart

                                                                                Fig. 4: ReLU (Rectified Linear Unit)

                                                                    Number of Layers
                                                                    In our proposed project, the LSTM model will contain four
                                                                    layers, two hidden layers, and two dense layers. The output
                                                                    of the first hidden layer is connected to another hidden layer
                                                                    which is further connected to a dense layer and that dense
                                                                    layer is lastly connected to another dense layer.

                                                                    Batch size: the number of samples that must be processed
                                                                    by the model before updating the weights of the parameters.
                                                                    In our project, we use batch size of 25.

                                                                    Dense layer: A dense layer is a densely connected Neural
                                                                    Network layer, where a dense layer connects each cell to
                                                                    another in the next layer. In our project, we use two dense
                                                                    layers.

                                                                    Number of Epochs: An epoch is when the whole training
                                                                    data has been passed through the network, hence one epoch
                                                                    is one iteration of the whole training data being passed
                                                                    through the network. In our project we use 50 epochs.

                                                                    Error Calculation:

        Fig. 3: Stock prediction algorithm (LSTM)                   Root Mean Square Error (RMSE): the measure of the
                                                                    difference between predicted values by a model and the true
3.4 Terminologies Used                                              values observed.

Training set: subsection of the original data that is used to
train the neural network model for predicting the output
values

Test set: part of the original data that is used to make            Where,
predictions of the output value, which are then compared            n = number of samples
with the actual values to evaluate the performance of the           f = predicted values
model                                                               o = true values
                                                                    Note - Smaller the RMSE value, greater the accuracy of the
Activation function: Here, ReLU (Rectified Linear Unit)             model.
activation function is tested to optimize the prediction            In our project we use the NumPy library (np) to find the
model.                                                              RMSE value,
ReLU stands for rectified linear unit                               np.sqrt(np.mean(((pred- y_test) **2)))
Mathematically, it is defined as y = max (0, x).                    Where, y is the testing data and pred is the predictions made
Below is given the visual representation of ReLU:                   by the model.

                                                                    Mean Absolute Percentage Error (MAPE) is a statistical
                                                                    measure used to measure the predictive accuracy of
                                                                    machine learning models.

© 2021, IRJET        |    Impact Factor value: 7.529            |    ISO 9001:2008 Certified Journal            |   Page 4514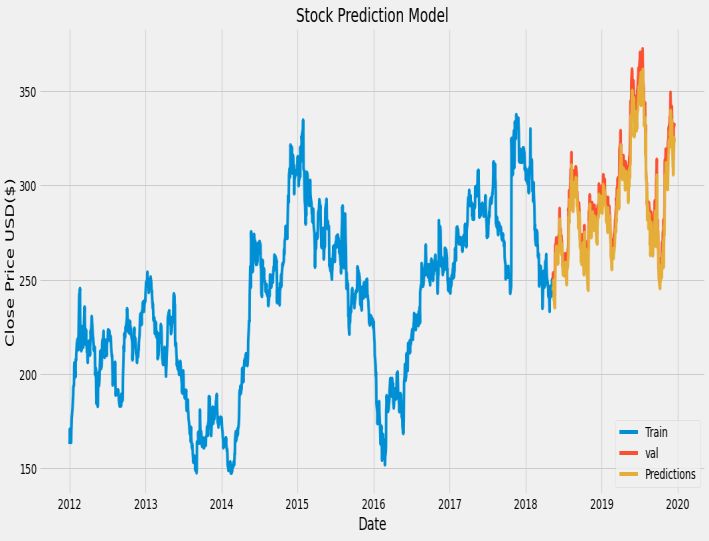
International Research Journal of Engineering and Technology (IRJET)                              e-ISSN: 2395-0056
        Volume: 08 Issue: 05 | May 2021              www.irjet.net                                        p-ISSN: 2395-0072

                                                                    Predicted stock Price:

Where,
A = Actual value                                                    Actual stock price
F = Forecast Value
Lower the MAPE, better fit is the model.

3.5 VISUALIZATION OF RESULTS
In the below-given graph, we have plotted the actual and the
predicted closing stock price of the State Bank of India
                                                                    As we observe the actual stock price is 326.95 and the
(SBIN.NS) from the date “2012-01-01” to “2019-12-17”. The
model was trained with a batch size of 25 and 50 epochs, and        predicted stock price value is 325.28. Hence, we can
the predictions made closely matched the actual stock prices,       conclude that the difference between the actual and
as observed in the graph.                                           predicted stock price is very minimal and our model
                                                                    gives the finest result.

                                                                    3.6 COMPARISON OF LSTM WITH ARIMA

                                                                    The performance of our proposed stock prediction system,
                                                                    which uses an LSTM model, was compared with ARIMA
                                                                    model on two different stocks.
                                                                    The two data sets that we used to make the predictions were
                                                                    “Nifty 50(^NSEI) “and “State Bank of India (SBIN.NS)”. In
                                                                    both the data sets we have considered 8 years of data
                                                                    starting from “2012-01-01” to “2019-12-17”. We extract data
                                                                    from ‘yahoo’ using the pandas-data reader library.
               Fig. 5: LSTM Prediction Graph                        We now check which model is more accurate by comparing
                                                                    the RMSE and MAPE values that we obtain after a successful
Calculating Error function                                          prediction of both models on the same dataset.
   Table 1: Error calculation for SBI.NS dataset (LSTM)                     Table 2: Nifty50 dataset (LSTM vs Arima)

                                                                            Table 3: SBI.NS dataset (LSTM vs Arima)

Calculating Future Price
Let us predict the stock price for “2019-12-18” which is
not present in the testing data and then compare it to
actual(true) value.
                                                                    As mentioned in the above tables, we see observation for
                                                                    two following data set:

© 2021, IRJET        |    Impact Factor value: 7.529            |    ISO 9001:2008 Certified Journal          |   Page 4515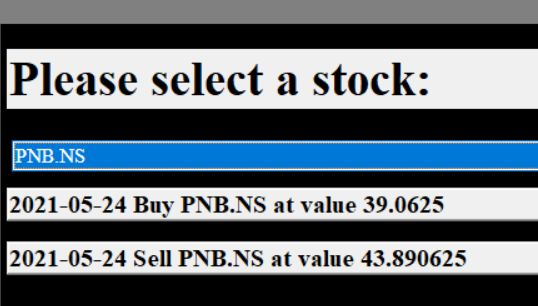
International Research Journal of Engineering and Technology (IRJET) e-ISSN: 2395-0056
Volume: 08 Issue: 05 | May 2021 www.irjet.net p-ISSN: 2395-0072
Considering the Nifty 50(^NSEI) data set, the LSTM gave a Then each number is divided by 8 and the value is
MAPE value of 0.0078 whereas the ARIMA model returned a written below it. (1/8 = 0.125).
MAPE value of 0.0633. For data set
Considering the State Bank of India (SBIN.NS) data set, the
LSTM gave a MAPE value of 0.0078 whereas the ARIMA
model returned a MAPE value of 0.0633.
For Data set, in both the cases we observe that LSTM gave a
lesser MAPE value compared to ARIMA and as we know
lower the MAPE value, the better fit is the model. Hence, we Figure 7
can conclude that LSTM model predicted better than ARIMA
model. Each integer value is summed to the produced
3.7 Gann–Theory: Introduction answer from above and is squared to generate the
table values. ((0+0 =0) ^2) = 0, ((0+0.125) ^2)
William Delbert Gann, an American trader, and market =0.01563
theorist developed Gann trading theory in 1935. The theory
given by him are popular and reliable among the trader. In
fact, most of the traders take their position by looking at the
price and rely on the Gann angles.
Gann theory predicts the movement of stocks after taking
into account the past, present and future of the markets. By Figure 8
analysing and assessing the information of the different
period including the short-term market highs and long-term Flowchart of Gann-Theory
market highs, angles are drawn to determine the future
market trend.
He invented the Gann Fan, are a form of geometric technical
analysis based on the assumption that markets are cyclical in
nature. The Gann fan theory describes that it has 9 angles
which are upon 360 degrees. And angles are based on 45
degrees it’s also known as 1:1 angle and Gann believe the 45-
degree angle is important and trends above it are strongly
bullish and trends below it is strongly bearish.
The 9 angles are: 0, 45, 90, 135, 180, 225, 270, 315, 360.
By Using these 9 angles as a Quadrants along with integers
numbering from 0 to 450, calculate the values. (450 is our
assumption you can calculate as many as you want).
3.8 Generating Gann-Chart using Gann-Theory
All Quadrants are substituted by numbers starting
from 0 to 8.
Figure 6 Figure9: Buy and Sell Trend Flowchart
© 2021, IRJET | Impact Factor value: 7.529 | ISO 9001:2008 Certified Journal | Page 4516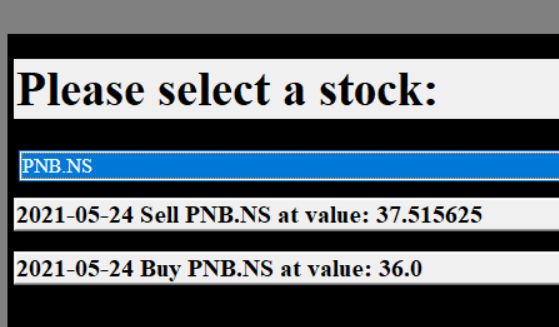
International Research Journal of Engineering and Technology (IRJET)                                    e-ISSN: 2395-0056
         Volume: 08 Issue: 05 | May 2021              www.irjet.net                                            p-ISSN: 2395-0072

3.9 Calculating the Buying Trend                                      particular stock. All in all, using this system will benefit the
                                                                      investors to invest in the stock market without any
Buying Trend refers to the bullish behavior of the stock              hesitation about financial loss and also get a statistic about
market. When the investor wants to know buying trend of a             stock movement.
particular stock then the system will generate two values i.e.,
“Buy Value” and “Sell Value”. In order to gain profit, the user       REFERENCES
is expected to buy the stock at Buy Value and sell the stock at
Sell Value.                                                           [1]   Sentiment Analysis for Effective Stock Market Prediction
                                                                            (March 2017) - Shri Bharathi.Sv
Buying Trend:                                                         [2]   JOURNAL OF ECONOMICS AND FINANCE • The Day of
                                                                            the Week - Hakan Berument and Halil Kiymaz
                                                                      [3]   Stock Market Prediction Using Various Statistical
                                                                            Methods - Karim Elbahloul (New Jersey City University)
                                                                      [4]   A Prediction Approach for Stock Market Volatility Based
                                                                            on Time Series Data - Sheikh Mohammad Idrees
                                                                      [5]   Long Short-Term Memory Networks with Python -
                                                                            Develop Sequence Prediction Models with Deep
                                                                            Learning -Jason Brownlee
                                                                      [6]   Stock Price Prediction Using the ARIMA Model –
                                                                            (Ayodele A. Adebiyi, Aderemi O. Adewumi, Charles K.
                                                                            Ayo)

                  Figure 10: Buying Trend

3.10 Calculating the Selling Trend

Selling Trend refers to the bearish behavior of the stock
market. When the investor wants to know the selling trend
of a particular stock then the system will generate two
values i.e., “Buy Value” and “Sell Value”. In order to avoid
loss, the user is expected to sell the stock at higher value
(Sell Value) and buy the stock at lower value (Buy Value).

Selling Trend:

                 Figure 11: Selling Trend

4. CONCLUSIONS

We implement the application “Stock Market Psychology”
that can be used by both novice investors as well as
intermediate traders to predict the future price of a stock on
the basis of historical data. The main aim of this application
is to figure out what is the best time to buy or sell a

© 2021, IRJET        |    Impact Factor value: 7.529              |    ISO 9001:2008 Certified Journal              |   Page 4517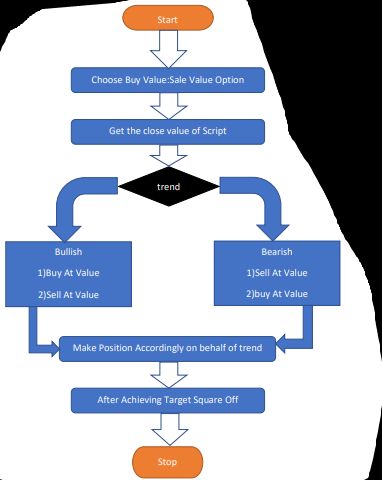
You can also read