SERAPHIM SPACETECH VENTURE CAPITAL INDEX
←
→
Page content transcription
If your browser does not render page correctly, please read the page content below

Q42020

Seraphim SpaceTech
Venture Capital Index

Welcome

Q
         4 was a landmark quarter in what has turned            With two special purpose acquisition companies
         out to be a landmark year for the SpaceTech            (SPACs) announcing during the quarter that they had
         investment market.                                     struck deals to merge with two Spacetech companies
                                                                (Momentus, and Seraphim portfolio company AST &
From the COVID-induced gloom of the first half of 2020          Science), 2021 is already shaping up to be yet another
where many (including us) were concerned that the               record year for Spacetech investment.
macro-economic headwinds might precipitate a ‘flight
from risk’ from many investors, 2020 ended with the             We anticipate many more companies over the
funding environment for SpaceTech companies having              forthcoming year will look to use SPACs as a means
never looked so healthy.                                        of attracting large capital raises and expediting their
                                                                pathway to becoming public companies.
2020 saw an incredible 70% increase in overall investment
levels to hit a record-breaking $7.7bn. Recognising             This is an exciting moment for the SpaceTech ecosystem,
Space’s credentials as a huge, long-term growth market,         and we look forward to reporting on yet more positive
investors doubled-down on the emerging category                 developments next quarter.
leaders, with SpaceX very much to the fore.

Alongside private investor’s unprecedented appetite
for Spacetech, Q4 also saw public market investors
                                                                    Mark Boggett          James Bruegger        Josephine Millward
recognising the sector’s potential.
                                                                        CEO                    CIO              Head of Research

Highlights                                                      COVID-19 Impact:
                                                                Q2-Q4 2019 vs 2020 (% Change)
$2.6bn
invested in Q4 ($2.8bn in Q3)
                                                                		Build

62
deals closed vested in Q4 (vs.48 in Q3)
                                                                        Launch

                                                                            DATA

233
record level of Seraphim Index
                                                                     Downlink

                                                                		Analyse

$850m
                                                                		Product

                                                                Beyond Earth
biggest deal closed in Q4 (OneWeb)                              		Drones

$7.7bn
record invested in 2020
                                                                  -100%            0%           100%          200%           300%

70%
growth in investment in 2020
                                                                The sector’s resilience to the impact of COVID-19 on the wider

                                                                macro-economic environment was reinforced in Q4 20. Comparing

221
deals closed in 2020 (vs. 219 2019)
                                                                the last three quarters of 2020 since COVID-19 hit with the same

                                                                period in 2019 shows overall investment levels up a remarkable 115%.

                                                                Upstream categories relating to Space-based infrastructure all

$45m
                                                                exhibit very strong growth trajectories; rockets (Launch), satellites

                                                                (Data) and Space exploration/exploitation (Beyond Earth) each grew
average deal size in 2020 (vs. $27m 2019)                       between 100-300%.

                                                            2
Q4 2020 Deals

                                                        Late Stage
                                            Early
                                            Stage
                                                                                   Early
                                                                                   Stage                               Q4 2020 Deals
                                                                                                                       Activity (# Deals)
                   Early
                   Stage

                                                    Downlink
                                                                                                                       Q4 2020 saw a significant increase in deal
                                                                                Launch
                               Analyse                                                                                 volumes with a total of 62 deals closed
                                                                                                       Late            versus 48 in Q3 2020.
                                                                                                      Stage

                                       Downstream                                                                      Upstream (dark blue) accounted for

                                                                                                                       63% of deal volumes, up from 53% in the

                                                                                                                       previous quarter.
                                                                             Upstream
                 Product                                                                                 Early
   Early
   Stage                                                                                                 Stage         Early stage transactions (seed through to
                                                                                           Data                        Series B) continued to account for more

                                                                                                                       than 80% of all deals.

                                                                                                                       The increase in quarterly deal volumes
                                  Beyond
                                   Earth                                                                               was fairly evenly distributed between the
                           e                                                                   Late
                         ag                                          Build                    Stage                    Build, Launch, Beyond Earth (upstream) and
                       St
                  te
               La                                                                                                      Product (downstream) categories.
                               Early
                               Stage
                                                                     Early
                                                                     Stage

Q4 2020 Top Deals
Building on the positive momentum from the previous quarter,                                  constellations (Chang Guang, Galaxy Space) raising multi $hundred

Q4 2020 had another slew of ‘mega rounds’ of more than $50m.                                  million rounds. The later builds on two equivalent rounds for
The quarter was marked by Bharti and the UK Government                                        Chinese rocket companies in Q3, which taken together are a strong

injecting $850m into OneWeb, two rocket companies (Relativity,                                indication of China’s quest to challenge the West for dominance in

Isar Aerospace) raising big rounds, and two Chinese satellite                                 the New Space ecosystem.

  Company                              Country                          Data Lifecycle	           Sub Category                 Stage	Amount

  OneWeb                               UK                               Data                      Satcoms                      Growth                  $850m

  Relativity Space                     US                               Launch                    Rockets                      Series D                $500m

  Chang Guang                          China                            Data                      Earth Observation            Series C                $376m

  GalaxySpace                          China                            Data                      Earth Observation            Series C                $300m

  Isar Aerospace                       Germany                          Launch                    Rockets                      Series B                $91m

  Joby Aviation                        US                               Launch                    Flight & Delivery            Growth                  $75m

  Astroscale                           Japan                            Beyond Earth              Space Infrastructure         Series E                $51m

  Percepto                             Israel                           Data                      Drones                       Series B                $45m

  Astranis                             US                               Data                      Satcoms                      Series C                $42m

  Kymeta                               US                               Downlink                  Ground Terminals             Growth                  $30m

                                                                                         3
Overall Investment Activity

Seraphim Trailing 12 Months Investment Activity Index (Q1 2018 = 100)

      225

   200                                $ bn
                                      # Deals
      175

      150

      125

      100

       75
             Q1 18       Q2 18        Q3 18       Q4 18        Q1 19        Q2 19        Q3 19       Q4 19       Q1 20        Q2 20       Q3 20        Q4 20

The Seraphim Space Index is a barometer of investment activity,                     (+33% on previous quarter). Once again, it has been a handful of ‘mega

showing the global volume and value of venture capital deals within the             deals’ that have continued to drive up deal values, whilst deal volumes

Space sector on a 12 month trailing basis, indexed against Q1 2018.                 remain steady.

Q3 2020 saw a notable divergence within the index between deal                      We expect this trend to continue over forthcoming quarters, powered

volumes (largely flat) and deal values (up 40 points in the quarter).               in part by several sizeable pre-IPO funding rounds (AST&Science,

This trend has continued apace in Q4 2020, with the deal value index                Momentus) announced in Q4 2020 but which will close in Q1 2021.

breaching the 200 point mark for the first time to reach a record 233

Seraphim Quarterly                                                                  Seraphim Annual
Investment Tracker ($bn Invested)                                                   Investment Tracker ($bn Invested)
  3                                                                     9            8                                                                 2020
                   Quarterly Investment                                 8
                   12 Month Trailing                                    7
                                                                                     6
  2                                                                     6
                                                                        5                                                                              2019
                                                                                     4
                                                                        4                                                                              2018
  1                                                                     3                                                                              2017
                                                                        2            2

                                                                        1
 0                                                                      0            0
        Q1 Q2 Q3 Q4 Q1 Q2 Q3 Q4 Q1 Q2 Q3 Q4                                                  Q1                Q2                 Q3                Q4
        18 18 18 18 19 19 19 19 20 20 20 20

Investment in Q4 2020 was slightly down on Q3’s record-breaking                     Q4 2020 closed out yet another record year for investing in SpaceTech.

levels, with a total of $2.63bn invested vs. $2.85bn in Q3. It should               Having surpassed 2019’s total by Q3, 2020 ended with $7.7bn of total

however be noted that even at this level, Q4 still represented the                  investment, 70% up year-on-year. We expect 2021 to shape up to

second highest quarter ever.                                                        be yet another record year, albeit this will likely be driven in part by

                                                                                    public markets given $1.34bn of investment in Space-related SPAC

                                                                                    transactions has already been announced.

                                                                             4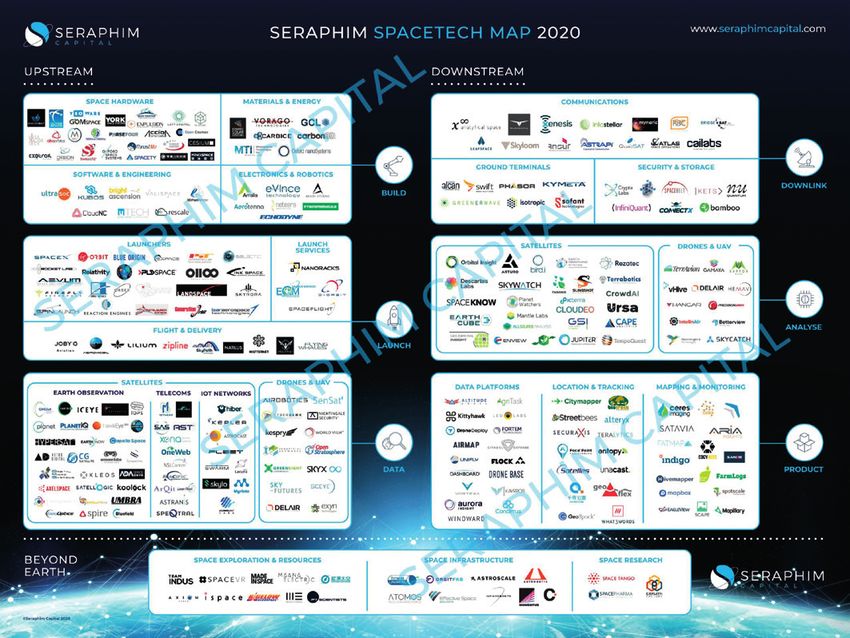
Seraphim Data Lifecyle                                                                         ■   Drones          ■   Downlink
                                                                                               ■   Beyond Earth    ■   Data
                                                                                               ■   Product         ■   Launch
                                                                                               ■   Analyse         ■   Build

Annual Investment ($bn)                                                     Last 12 Months Investment ($bn)
  8                                                                           8

  7                                                                           7

  6                                                                           6

  5                                                                           5

  4                                                                           4

  3                                                                           3

  2                                                                           2

   1                                                                           1

  0                                                                           0
         2017             2018            2019              2020                       Q4 2018           Q4 2019           Q4 2020

With the ‘mega deals’ that have powered record investment                   Most categories saw double digit year-on-year growth in 2020.

levels having been dominated by rocket launchers and smallsat               Launch (up 76%) and Data (up 39%) had the biggest gains thanks

constellations, it is no surprise that taken together, the Launch and       to the impact of ‘mega deals’. Downstream investment levels

Data category (which includes constellations) accounted for 85%             were more muted, with the Analyse and Product categories

of the growth in 2020. As the more capital-intensive, infrastructure-       respectively flat and down substantially. As new datasets from the

like elements of the ecosystem, we would expect this trend to               constellations start to come online, we would expect to start to see

continue in 2021.                                                           an uptick in downstream investment levels.

Number of Deals                                                             Average Deal Size ($m)
100%                                                                          180

                                                                              160
 80%                                                                          140

                                                                              120
 60%
                                                                              100

                                                                               80
 40%
                                                                               60

 20%                                                                           40

                                                                               20
  0%                                                                               0
              2017             2018       2019           2020                          2017          2018          2019           2020

The number of deals closed in 2020 (221) was consistent with                A combination in capital intensity and large investment rounds into

2019 (219). There was however substantial growth in deal volumes            the maturing category leaders has seen average deal sizes in Launch

in several categories. Analyse was up 53% to 23 companies, and              and Data grow very significantly during 2020. Average deal size in

Build up 32% to 29 companies. We believe the former is a positive           Data was $164m, skewed by the SpaceX and OneWeb capital raises.

lead indicator for the exploitation of Space data, and the later a          Recent growth in average transaction size in Launch ($69m) has

sign of the continued innovation that is driving new capabilities for       been driven by a broader array of companies raising growth rounds.

satellites and drones alike.

                                                                        5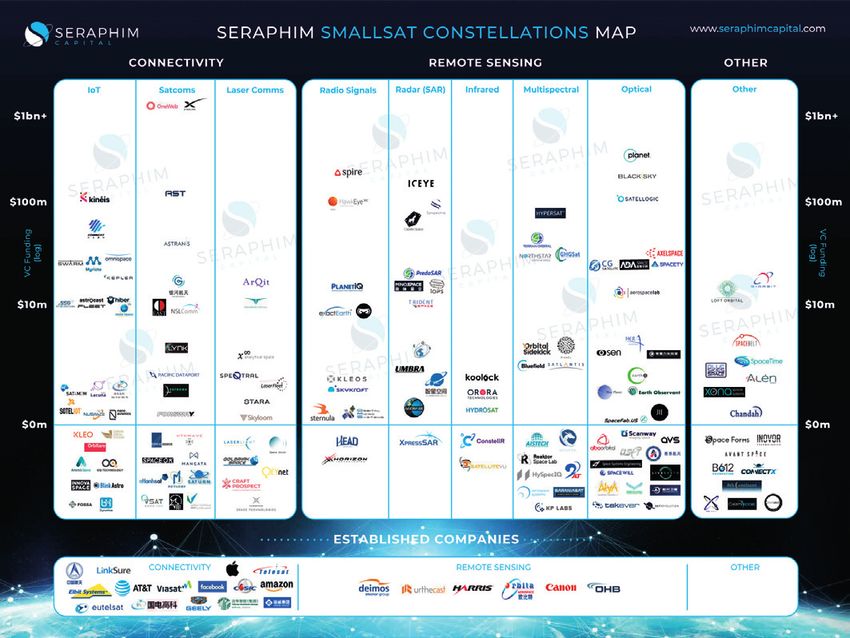
Geographic Analysis

No. Deals Last 12 Months Investment                                           Investment By Region ($)

140                                                                             5

120                                                                                       ■   North America
                                                                                4         ■   Europe
                                                     ■ 2018                               ■   Asia
100
                                                     ■ 2019                               ■   RoW
 80                                                  ■ 2020                     3

 60                                                                             2
 40
                                                                                1
 20

  0                                                                             0
             North        Europe         Asia          RoW                               2017           2018            2019            2020
            America
Given overall deal volumes were flat in 2020, it is no surprise that at       North American remained the dominant region in 2020 in terms of

a regional level there was likewise no material changes. A modest             investment amounts. Powered by SpaceX’s fundraising exploits,

increase in North American deals was offset by commensurate                   investment grew by 90% in 2020 to $4.6bn. Notwithstanding

slight decreases in Asia and Europe. The UK continued to be the               OneWeb’s own huge funding round closed in Q4, overall investment

primary market in Europe, accounting for 42% of all European deals,           levels in Europe were flat in 2020 ($1.6bn, up 3% y.o.y). Investment

as it had done in 2019. RoW grew 36% in the year, albeit from a low           in Asia grew by more than 175% to $1.4bn, due almost entirely to a

base.                                                                         handful of very large financing rounds closed by Chinese companies

                                                                              in the second half of the year.

Average Deal Size By Region ($m)                                              US vs. RoW Investment Activity (LTM)
   70                                                                         # Deals                                            Investment ($bn)
                           N. America
   60                                                                         140                                                                     5
                           Europe
                           Asia                                                120
   50                                                                                                                                                 4
                                                                              100
   40
                                                                                                                                                      3
                                                                               80
   30
                                                                               60                                                                     2
   20
                                                                               40
                                                                                                                                                      1
    10
                                                                                20

      0                                                                          0                                                                    0
               2017          2018          2019          2020                                   2018            2019             2020
                                                                                          ■ RoW Deals                   RoW Investment
                                                                                          ■ US Deals                    US Investment

The surge in ‘mega deals’ in 2020 drove up average deal sizes across          Both the number and proportion of US vs. RoW investments in 2020 were

all three key regions. North America increased 92%, Europe 18% and            broadly flat on 2019’s figures. Whilst RoW continues to account for

Asia 152%. Average deal sizes in Asia have now surpassed those                c.55% of deals done, the US was very much in the ascendency in 2020

within Europe. With Europe lagging behind North American and Asia             in terms of dollars invested. Thanks largely to SpaceX, US investment

in terms of companies that have been raising very large rounds, we            increased 88% in 2020, compared to 49% in the RoW, resulting in the US

would expect this gap to continue to grow in 2021.                            accounting for 59% of all capital invested (up from 47% in 2019).

                                                                          6
Investment Stage
Deals in Q4 2020 No. Deals Last 12 Months
Investment ($bn) # Deals
2.0 35 100
■ $ Investment
30 ■ 2018
# Deals 80
1.5 ■ 2019
25 ■ 2020
20 60
1.0
15
40
10
0.5
20
5
0 0 0
Seed Series Series Series Series Seed Series Series Series Series
A B C D+ A B C D+
Q4 saw a substantial increase (+48%) over the previous quarter in 2020 saw a marked trend of growth in later stage deals. Series
the number of Seed and Series A deals closed. This is hopefully a B and C deals both grew by more than 50% year-on-year. We
sign that investors have rediscovered their appetite for earlier stage believe this is a good indicator of a maturing ecosystem. Series
risk. The distribution of amounts invested was broadly consistent A deals declined by 22% in 2020 which we would attribute to
with the previous quarter, with growth stage deals account for c.3/4 COVID; investors have either been writing small cheques into seed
of all investment. companies, or making big commitments to later stage companies.
Average Deal Size ($m) $ Invested By Stage ($bn)
300 100%
250 ■ Series D+
■ Series C 80%
■ Series B ■ Series D+
200 ■ Series A ■ Series C
■ Seed 60% ■ Series B
■ Series A
150 ■ Seed
40%
100
20%
50
0 0%
2017 2018 2019 2020 2017 2018 2019 2020
Coupled to the growth in the number of later stage deals being Fuelled by the growth in both the volume and size of Series C and
closed, the average size of these deals also increased significantly. Series D+ stage transactions, growth stage deals accounted
Series B and C average deal sizes both grew by more than 100% for more than 75% of the value of all investments in 2020. This
in 2020, with Series D+ also growing by nearly 40%. Contrastingly, continued the trend of 2019 which also saw a marked increase in
Seed and Series A average deals sizes were little changed on 2019. growth stage investing which had previously accounted for c.50% of
all deal value.
7About Seraphim
VC Funds + Accelerator + Angel Platform + Research
Our Model: Inception to exit Our focus: Businesses collecting
support powered by smart capital & communicating data from above
Seraphim is the world’s leading specialist We are focused exclusively on the multi $trillion
investor in SpaceTech. SpaceTech investment market.
Powered by smart capital from leading Space We believe SpaceTech is at the nexus of mega-
companies and government agencies, we have trends that will define societal change over
a unique model combining investment funds, forthcoming decades and has a unique role to
accelerators, and an angel investor platform. play in addressing the world’s most pressing
problems.
We use our panoptic view of the SpaceTech
ecosystem to provide inception to exit support Radical advances in the Space sector mean
to the sector’s most ambitious and fearless a data and connectivity tsunami is about to
entrepreneurs as they aspire to harness the transform the world as we know it, driving the
infinite potential of Space to help push the next major paradigm shift in the global economy.
boundaries of what is currently possible by
turning science fiction into science fact. We invest in companies that are enabling,
generating and exploiting data being collected
and communicated from above.
SATEllites
100km
UAVS
1000m
DRONES
100m
BUILD LAUNCH data DOWNLINK ANALYZE PRODUCT
8Our Portfolio
Current Portfolio
We are the most prolific investor in SpaceTech globally. Across our different activities, we currently
have a portfolio of more than 50 of the world’s leading SpaceTech start-ups.
Fund
Accelerator
Portfolio News
Seraphim Portfolio Companies At Heart Of SpaceX’s Record Breaking Launch
AST & Science to go public via SPAC merger
D-Orbit makes history with inaugural ‘Space-Taxi’ mission
Altitude Angel launches world’s first ‘sky corridor’ for autonomous drones
Iceye announces record $87m Series C funding round
LeoLabs partners with SpaceX to track Starlink satellite deployments
9Methodology / Further Research
Methodology & Taxonomy Further Research
We use a wide range of different data sources We routinely publish our own research and
to compile our investment tracker. This includes insights on our website with a view to helping
proprietary, off-market information from our other investors share our excitement for the
deal flow and network, deal databases such multi-decade transformational potential of
as Crunchbase, industry news sources such Spacetech. Key periodic research we publish
as SpaceNews and Techcrunch, and public includes our widely recognised SpaceTech
announcements from companies themselves. We Ecosystem and Smallsat Constellation market
only include third party capital invested on an maps.
arm’s length basis and therefore do not include
personal investment that the likes of Jeff Bezos
may make in their own space initiatives.
Build
• Building & selling satellites, drones,
components, sub-systems, complete systems
• Hardware (sensors), software (i.e. control
system), hybrid (i.e. machine vision)
launch
• Building & launching rockets
• Launch-related services
• Deliver (i.e. air taxis, drone delivery)
Space Tech Map
data Global VC backed emerging leaders per category DOWNLOAD
• Any data collection / space platform (i.e.
smallsat, drone, HAPs)
• Multi-modal: look, listen, communicate
downlink
• Facilitate transmission of data from space /
aerial platform back down to earth
• Satcoms & terrestrial comms networks
• Data storage, processing, security
analyze
• Analysis of data from space / aerial platforms
• A.I / machine learning enabled analytics
product Smallsat Constellation Map
• Packaging of different data streams (space & Every company planning a smallsat constellation DOWNLOAD
non space)
• Tailored to specific use cases in specific verticals
• Location, monitoring, insight, mapping www.seraphim.vc/researchYou can also read