Mapping and change analysis of mangrove forest by using Landsat imagery in Mandeh Bay, West Sumatra, Indonesia
←
→
Page content transcription
If your browser does not render page correctly, please read the page content below
Mapping and change analysis of mangrove forest
by using Landsat imagery in Mandeh Bay, West
Sumatra, Indonesia
Adityo Raynaldo, Erizal Mukhtar, Wilson Novarino

Department of Biology, Faculty of Mathematics and Natural Sciences, Andalas University,
     Padang 25163, West Sumatra, Indonesia. Corresponding author: E. Mukhtar,
                            erizalmukhtar@sci.unand.ac.id

       Abstract. Mapping mangrove vegetation using Landsat Satellite Imagery data is used as an accurate
       way to determine the distribution of mangrove vegetation areas and decadal changes in the Mandeh
       mangrove forest area. This study aims to map mangrove vegetation using Landsat imagery over the last
       three decades from 1988 to 2019 to determine changes in the area and classify mangrove vegetation at
       low, medium and tight densities. The ground control points (GCP) were determined in the field
       purposively through a false-color composite of Landsat imagery. Field data collection was carried out at
       20 locations and aerial photography at 7 locations, mangrove area classified using support vector
       machine algortihm. Mangrove map has 79.71% overall accuracy and 0.549 Kappa coefficient. The overall
       distribution of mangroves vegetation was increasing in the area, but we found several damaged areas in
       the location from change detection analysis. Damage was caused by road construction, dock contruction
       and logging. From this study, mangrove gain through colonization and growth are seen, but loss of
       mangrove vegetation must be considered.
       Key Words: Landsat imagery, Mandeh Bay, mapping mangrove, support vector machine.

Introduction. Mandeh Bay is located on the west coast of Sumatra, Pesisir Selatan
District, West Sumatra Province, Indonesia, and it has an area of around 18,000 ha with
six coastal villages and small islands included. This area was planned into an integrated
tourism area by the West Sumatra regional government and included in the national
tourism development area (West Sumatra Development Planning Agency 2018).
        In the development of Mandeh Bay as coastal area tourism, it should be based on
the right consideration of ecological aspects, especially in terms of preventing potential
disasters such as tidal waves and storms surges. Mangrove forests form a natural
protective barrier against these as well as providing an ecotourism-based destination or a
site for educational ecological tours. Such activities can support mangrove conservation
and biodiversity management programs.
        Mandeh Bay has existing mangrove forests but the development of the region and
the supporting infrastructure such as roads and residential expansion could negatively
impact these and lead to an impairment of ecology of the region. The extent to which this
is the case can be monitored using satellite imagery. Mapping has been conducted using
Landsat satellite imagery over last the last three decades from 1988 until 2019 to
determine changes in the area and to classify mangrove vegetation with low, medium,
and tight density. Mukhtar et al (2017) reported nine mangrove species from 6 families
found from three observation points in the Mandeh area. In another study, Yanti (2017)
reported that aerial imagery indicated that 4,074 ha of mangrove vegetation had been
damaged in the Mandeh area, at two observations points by logging and roads and docks
constructions. A thorough observation of the mangrove cover of the Mandeh area was
needed to estimate the current mangrove cover area and the recent changes. Three
decades of Landsat satellite imagery data has been used to do this.

AACL Bioflux, 2020, Volume 13, Issue 4.
http://www.bioflux.com.ro/aacl
                                                    2144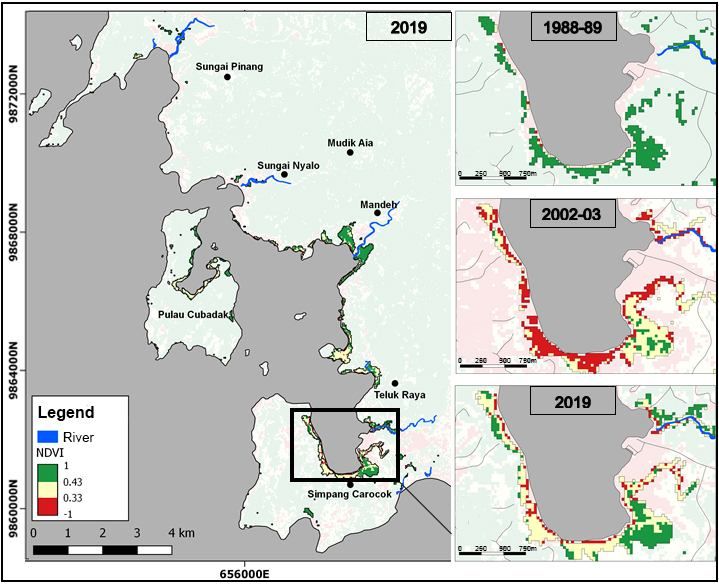
Material and Method
Description of the study sites. The area of Mandeh is approximately 18,000 ha
(Ridwan et al 2015), and includes 6 villages; Simpang Carocok, Mandeh, Sungai Nyalo,
Mudiak Aia, Sungai Pinang, Teluk Raya, and several small islands (Regional Development
Agency of Pesisir Selatan 2015). The study was conducted for approximately three
months, from April to June 2019 focusing on the mangrove forest of the Mandeh Bay,
Koto XI Tarusan District, Pesisir Selatan Regency, West Sumatra, Indonesia. Sampling
and aerial photo-taking were carried out in 3 villages (Sungai Nyalo, Mandeh, and
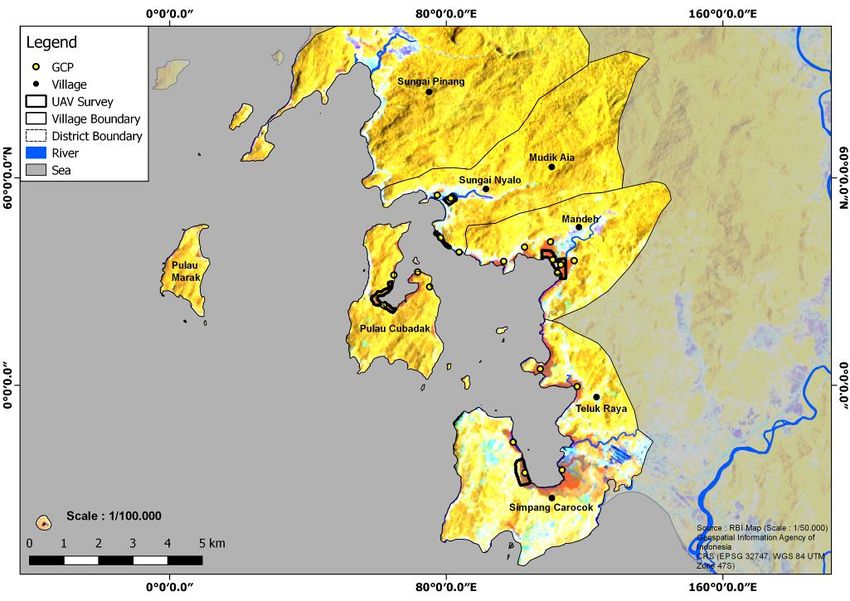
Simpang Carocok) and one island (Cubadak Island) in the Mandeh area (Figure 1).
Figure 1. Sampling distribution map at the study site. Scale: 1/100,000 (the contrasting brownish-
red color of other vegetation in the image indicates the presence of mangrove vegetation).
Downloading and pre-processing satellite image data. The study uses L1 Terrain
satellite imagery data (USGS 2019) that has been radiometrically and geometrically
corrected (on paths 127 rows 061 with three types of data; Landsat 8 OLI, Landsat 7
ETM+ and Landsat 5 TM) (Table 1).
Table 1
Landsat data used in analysis
Period Data Acquisition date
2019 Landsat 8 March 06 2019
May 25 2019
June 10 2019
2002-2003 Landsat 7 May 18 2002
May 5 2003
May 21 2003
1988-1989 Landsat 5 June 20 1988
August 07 1988
July 25 1989
AACL Bioflux, 2020, Volume 13, Issue 4.
http://www.bioflux.com.ro/aacl
2145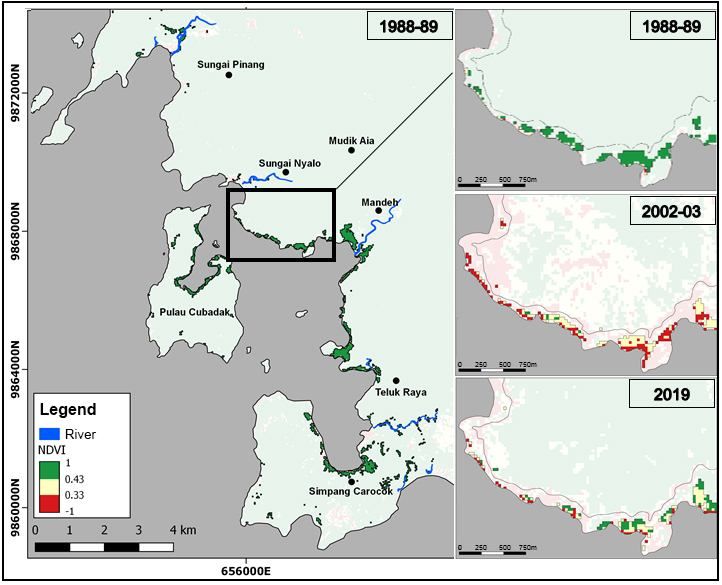
This research consists of several steps; Downloading and Preprocessing, Field
Survey, Classification, overlay, and data analysis (Figure 2). Pre-processing is carried to
calibrate the data according to standards, consisting by checking geometric corrections
and radiometric corrections to Geospatial Information Agency (GIA) of Indonesia data.
(Head of GIA of Indonesia Regulation number 3 2014).

                                          Figure 2. Research flowchart.

Field survey. Sampling at the study site was carried out at 20 locations chosen
purposively from the analysis of Landsat 2019 imagery (6 March 2019 acquisition) and
aerial photographs collection with an area of 70.71 ha. Determination of the ground
checkpoint (GCP) and field data collection was based on indication of the presence of
mangroves from the false-color composite Landsat images. The false-color RGB
composite in combination with the RGB 564 bands in Landsat 8 and 453 in Landsat 7 and
5 produces a contrasting brownish-red color for mangrove vegetation that distinguishes it
from other objects (Winarso & Purwanto 2014; National Institute of Aeronautics and
Space of Indonesia 2015). GPS data points, validation of mangroves, and field
photographs were taken in these selected areas.

Mangrove classification. Classification is carried out to separate mangrove and non-
mangrove vegetation using the support vector machine (SVM) supervised classification
algorithm by creating a Region of Interest (ROI) at the location that has been confirmed
in the field survey. The determination of the training site / ROI is based on observations
of the image through certain RGB false-color composites that can separate mangrove
vegetation, through aerial photographs and through field survey. Classification of the
three image data is carried out using the same ROI, ROI is determined on the three
acquisition dates based on the 2019 acquisition data, field survey and aerial photograph
in 2019. The ROI that has been determined is then narrowed to be able to generalize all
three image data with all acquisition data and reveals the presence of mangrove
vegetation through false-color composites. A number of 26 ROI for mangroves (31.68 ha
out of 46.29 ha of aerial photograph observations) and 20 ROI for non-mangroves (1,687
ha) were determined.

AACL Bioflux, 2020, Volume 13, Issue 4.
http://www.bioflux.com.ro/aacl
                                                     2146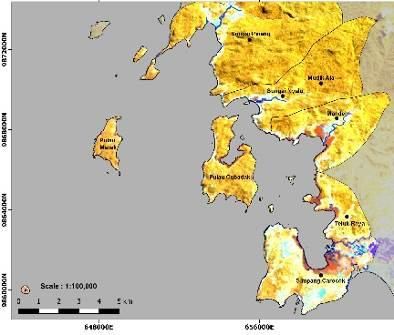
Post-processing. The classification results are processed further by separating the parts
that are not included in the mangrove vegetation criteria, and this process was done to
improve the accuracy in the classification results. The separation process is carried out by
masking based on the Indonesian Marine-Aquatic Research Center data (2011) for
separating Indonesian marine area, and TerraSAR-X add-on data for Digital Elevation
Measurements (TanDEM-X 90m DEM) (Geoservice 2016) for separating mangroves non-
habitat (elevation of more than 30 meters above sea level which were clearly not
mangrove habitat).

Canopy density map. Critically level of mangrove vegetation can be classified based on
canopy density (Forestry Department of Indonesia 2005; Yusandi et al 2018):
   1) tight canopy density (70-100%, or 0.43 ≤ NDVI ≤ 1.00);
   2) medium canopy density (50-69%, or 0.33 ≤ NDVI ≤ 0.42);
   3) low canopy density (< 50%, or -1.0 ≤ NDVI ≤ 0.32).
Canopy density classification was analyzed using the NDVI maximum value algorithm
from 3 image data in each period (Table 1).

Change detection. Change detection compared mangrove and non-mangrove
classification results in 1988 and 2003, 1988 and 2019, 2003 and 2019 classifying
changes in three classes, i.e. (+) changes, no changes, and (-) changes, threshold values
between -1 and 1.

Statistical analysis. Mapping validation is carried out to determine the accuracy of the
mapping classification, based on the Overall Accuracy value and Kappa coefficient
(Congalton & Green 2008). A mangrove classification map can be accepted if it has an
overall accuracy of more than 70% (National Institute of Aeronautics and Space of
Indonesia 2015).

where:
K    = Kappa coefficient;
     = Total proportion of the main diagonal of the observation frequency;
     = The total marginal proportion of the frequency of observations.

Results. Analysis and classification of Landsat imagery revealed that the extent of
mangroves in the Mandeh area grew from 191.43 ha in 1988 to 250.83 ha in 2003 and
261.90 ha in 2019. The distribution of dominant mangroves was spread throughout the
coastal areas of the villages in Mandeh Bay and on the Kapo-kapo Bay of Cubadak Island
(Figure 3). True mangroves found from a ground check were Avicennia marina,
Rhizophora apiculata, and Scyphiphora hydrophylacea. The overall accuracy value of the
2019 acquisition data was 79.71% and kappa coefficient 0.549.

Mangrove vegetation distribution. The distribution of mangroves in each period is
grouped based on canopy density, and high canopy density is represented in green,
medium canopy density is being represented in yellow, and low canopy density is
represented in red (Figures 4 and 5). These figures show the mangrove distribution on
the coast of the Sungai Nyalo and Mandeh villages. A loss of mangrove vegetation is
evident in part of Figure 4 with reduction of density in the period 1988 and 2003 and an
absence of mangroves in 2019. Figure 5 of the coast of Simpang Carocok village (Bukit
Emas) indicates a visible increase in mangrove forest. Areas classified as non-mangrove
in the 1988 period were classified as mangrove in the 2003 and 2019 periods.

AACL Bioflux, 2020, Volume 13, Issue 4.
http://www.bioflux.com.ro/aacl
                                           2147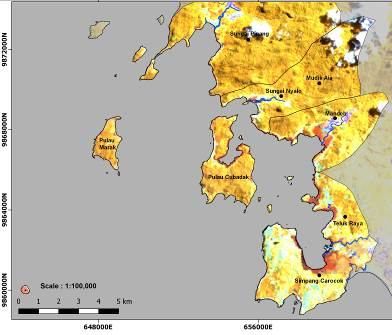
a                                  b                        c

       d                                  e                        f

 Figure 3. RGB composite map of Landsat image (NIR-SWIR-Red) and supervised classification of
 mangrove area in 1988-2019. Scale: 1/100,000 (a-c represent the composite images of 1988 (a),
   2003 (b) and 2019 (c), d-f represent the results of the classification of mangrove vegetation
                          (green) in 1988 (d), 2003 (e) and 2019 (f).

    Figure 4. NDVI map and supervised classification in coastal area of Sungai Nyalo and Mandeh
                             villages in 1988-2019. Scale 1: 12,500.

The Figure 4 above represents the map of mangrove distribution on the coast of the
Sungai Nyalo and Mandeh villages which shows the detection of losing mangrove
vegetation in the area. In the Figure 4 we can see a reduction in the parts detected by
mangroves in the period 1988 and 2003, and not classified as mangroves in the 2019
period.
AACL Bioflux, 2020, Volume 13, Issue 4.
http://www.bioflux.com.ro/aacl
                                              2148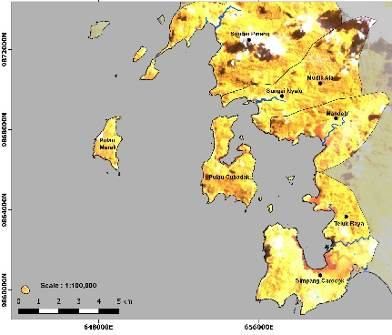
e

   Figure 5. NDVI map and supervised classification in coastal area of Simpang Carocok village in
                                  1988-2019. Scale 1: 12,500.

The Figure 5 above represents the map of mangrove distribution on the coast of Simpang
Carocok village (Bukit Emas) which shows the detection of an increase in area that is
quite visible. There is an increase in the undetected parts of mangroves in the 1988
period and mangrove classification in the 2003 and 2019 periods.

Change detection. Table 2 shows losses and gains detected between each period. Gain
is detected as an increase in the number of pixels that can be classified as mangroves by
an algorithm from one period to the next while is a decrease because the algorithm no
longer detects and classifies pixels as mangroves 2019 data were compared with the
1988 and 2003 period data. The extent projection is the result of an area in the previous
period with an increase in area in the next period that occurs, assuming there is no
reduction in the area during that period.

                                                                                           Table 2
                             Change detection in mangrove vegetation area

                Extent at            Loss       Loss
                                                         Gain (from   Gain (from        Extent
  Period         onset of           (from      (from
                                                           1988)        2003)         projection
                  period            1988)      2003)
   1988         191.43 ha              -          -           -            -          191.43 ha
   2003         250.83 ha          39.15 ha       -       98.55 ha         -          289.98 ha
   2019         261.90 ha          44.91 ha   40.50 ha   115.38 ha     51.57 ha       306.81 ha

Discussion. The results showed a smaller mangrove area than reports from Ridwan et al
(2015), mangrove area reported of 325 ha in 2010, and Geospatial Information Agency
of Indonesia (2019) data of 284.04 ha in 2013. This is due to the medium spatial
resolution of the Landsat imagery, so that there are parts that cannot be detected as
mangroves, although in that area there was found mangrove vegetation from field
observations. Previous research results in the Mandeh Bay found 6 to 9 true mangrove
species, including Acrostichum aureum, Bruguiera gymnorrhiza, Ceriops tagal,

AACL Bioflux, 2020, Volume 13, Issue 4.
http://www.bioflux.com.ro/aacl
                                                 2149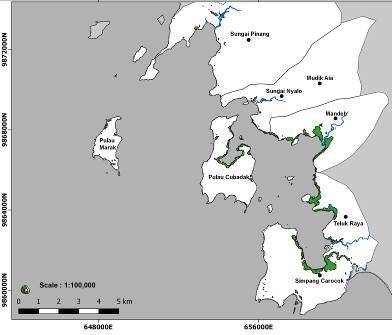
Lumnitzera littorea, Rhizophora apiculata, R. mucronata, S. hydrophyllacea, Sonneratia
alba, Xylocarpus granatum (Mukhtar et al 2017).
        The area of mangrove forest on the coastal area of Sungai Nyalo and Mandeh
villages was found to be 17.01 ha in 1988, 21.42 ha in 2003 and 17.46 ha in 2019
(Figure 4). The reduction in the area covered by mangroves in 1988 was detected in this
segment to be 6.75 ha by 2019. Mukhtar et al (2017) recorded aerial photographs in this
part of the area which showed mangrove forests accounting for 12.41 ha and forest area
damaged from 5 observation points totaling 2.73 ha. This damage is caused by road
construction, dock construction, and sedimentation.
        According to the study results, the area of mangrove in Simpang Carocok village
was 64.89 ha in the 2019 period, 64.26 ha in the 2003 period and 35.82 ha in 1988
(Figure 5). The detection of reduction in the area of mangroves in this segment
amounted to 7.47 ha from the period 1988 to 2019. This area has minimal disruption,
and no damaged parts were found at the time of data collection. Detection of mangrove
reduction was found in the area around the dock and settlement, according to Okdianto
(2015); in this area there were found logged-over areas, Lumnitzera littorea and
Xylocarpus granatum used as charcoal and firewood by surrounding residents. Gained of
mangrove vegetation is also dominant in this area. This is presumably because some of
the mangrove areas are difficult to reach by land, with a high slope, so that mangrove
colonization is quite visible in this area.
        Loss and gain in mangrove area in 2019 was detected by comparing with the 1988
and 2003 periods. The extent projection is the result of an area in the previous period
with an increase in area in the next period that occurs, assuming there is no reduction in
area during that period. The results of the classification are limited to the spatial
resolution of 30 m Landsat imagery, color detection and reflection of the band can only
read pixel images that have dominant mangrove vegetation, so that in the 1988 period
there were parts that could not be detected and classified as mangroves by the
algorithm. This is then classified as a growing mangrove area in the next period. The
reduction in area is detected as the number of pixels reduced due to the degradation of
some or all of the mangrove vegetation in each pixel.

Conclusions. From this study, we found that the distribution of mangrove vegetation in
Mandeh Bay is spread in coastal areas of all villages, also mangrove vegetation can be
found in several small islands in Mandeh Bay. Mangrove areas increased from 1988 to
2019, but from change detection analysis we found damaged area from several locations.

Acknowledgements. This study was supported by Directorate General of Higher
Education, Ministry of Research and Technology Republic of Indonesia Fiscal Year 2019
(Grant Number 051/SP2H/LT/DRPM/2019) and by contract with Andalas University
(T/44/UN.16.17/PT.01.03/PKR-PP/2019). We also thank to IDEA WILD for equipment
support. We are also thankful to the anonymous reviewers for their valuable suggestions
and comments on the paper. The authors would like to thank Miss. Fay Farley, guest
lecturer from New Zealand at Language Centre of Andalas University, for proofreading
and constructive criticism of the manuscript.

References

Congalton R., Green K., 2008 Assessing the accuracy of remotely sensed data: principles
     and practices. 2nd edition, CRC Press, Boca Raton (US), 200 pp.
Forestry Department of Indonesia, 2005 [Guidelines for inventory and identification of
     mangrove critical land]. Directorate General of Land Rehabilitation and Social
     Forestry, Jakarta, 13 pp. [in Indonesian]
Geoservice       E.,     2016       TanDEM-X        90m      DEM.    Available      at:
     https://download.geoservice.dlr.de/TDM90/. Accessed: February 2019.
Geospatial Information Agency of Indonesia, 2019 Indonesia Geospatial Portal. Available
     at: http://tanahair.indonesia.go.id. Accessed: February 2019.

AACL Bioflux, 2020, Volume 13, Issue 4.
http://www.bioflux.com.ro/aacl
                                          2150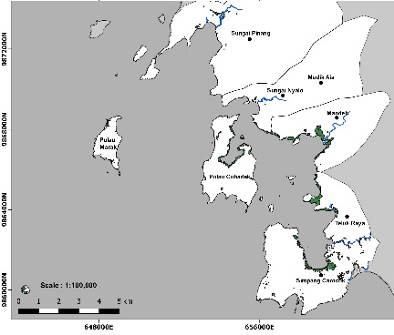
Head of GIA of Indonesia Regulation number 3, 2014 [Pedoman teknis pengumpulan dan
     pengolahan data geospasial mangrove]. Jakarta, 47 pp. [in Indonesian]
Indonesian Marine-Aquatic Research Center, 2011 Indonesian territorial waters. Available
     at: http://pusriskel.litbang.kkp.go.id/. Accessed: February 2019.
Mukhtar E., Rahmi F., Okdianto I., 2017 Ecological study of mangrove forest in Mandeh
     Bay, West Sumatra, Indonesia: I. Structure and composition of true mangrove.
     Research Journal of Pharmaceutical, Biological and Chemical Sciences 8(2):107-
     111.
National Institute of Aeronautics and Space of Indonesia, 2015 Pedoman pengolahan
     data penginderaan jauh Landsat 8 untuk mangrove. LAPAN, Jakarta, 14 pp. [in
     Indonesian]
Okdianto I., 2015 Analisis vegetasi mangrove di Carocok Tarusan Kawasan Wisata
     Mandeh Kabupaten Pesisir Selatan. Thesis, Andalas University, 47 pp. [in
     Indonesian]
Regional Development Agency of Pesisir Selatan, 2015 Revisi perencanaan objek wisata
     kawasan Mandeh (Masterplan Mandeh). Pesisir Selatan Government, Pesisir
     Selatan, 59 pp. [in Indonesian]
Ridwan N., Kusumah G., Husrin S., Kepel T., 2015 [Kapal Karam MV Boelongan
     Nederland di Kawasan Mandeh, Lingkungan Laut Sekitarnya, dan Kemungkinan
     Pengembangannya]. In: Karakteristik sumberdaya laut dan pesisir, Pusat Penelitian
     dan Pengembangan Sumberdaya Laut dan Pesisir, Jakarta, pp. 84-133. [in
     Indonesian]
USGS, 2019 Retrieved from USGS: http://earthexplorer.usgs.gov/
West Sumatra Development Planning Agency, 2018 RPJMD Sumbar Tahun 2016 hingga
     2021. Indonesian Government, Padang, 401 pp. [in Indonesian]
Winarso G., Purwanto A. D., 2014 Evaluation of mangrove damage level based on
     Landsat 8 image. International Journal of Remote Sensing and Earth Sciences
     11(2):105-116.
Yanti N. R. P., 2017 Estimasi kehilangan cadangan karbon pada hutan mangrove di
     kawasan Mandeh Sumatera Barat. Thesis, Andalas University, 67 pp. [in
     Indonesian]
Yusandi S., Jaya I. S., Mulia F., 2018 Biomass estimation model for mangrove forest
     using medium-resolution imageries in BSN Co Ltd consession area, West
     Kalimantan. International Journal of Remote Sensing and Earth Sciences 15(1):37-
     50.

Received: 17 March 2020. Accepted: 19 May 2020. Published online: 17 August 2020.
Authors:
Adityo Raynaldo, Department of Biology, Faculty of Mathematics and Natural Sciences, Andalas University,
Padang 25163, West Sumatra, Indonesia, e-mail: adityoraynaldo@gmail.com
Erizal Mukhtar, Department of Biology, Faculty of Mathematics and Natural Sciences, Andalas University,
Padang 25163, West Sumatra, Indonesia, e-mail: erizal@fmipa.unand.ac.id
Wilson Novarino, Department of Biology, Faculty of Mathematics and Natural Sciences, Andalas University,
Padang 25163, West Sumatra, Indonesia, e-mail: wilson_n_id@yahoo.com
This is an open-access article distributed under the terms of the Creative Commons Attribution License, which
permits unrestricted use, distribution and reproduction in any medium, provided the original author and source
are credited.
How to cite this article:
Raynaldo A., Mukhtar E., Novarino W., 2020 Mapping and change analysis of mangrove forest by using Landsat
imagery in Mandeh Bay, West Sumatra, Indonesia. AACL Bioflux 13(4):2144-2151.

AACL Bioflux, 2020, Volume 13, Issue 4.
http://www.bioflux.com.ro/aacl
                                                    2151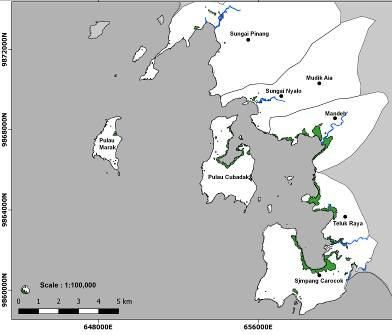
You can also read