CCG improvement and assessment framework 2018/19: Methodology Manual - NHS England
←
→
Page content transcription
If your browser does not render page correctly, please read the page content below
CCG improvement and
assessment framework
2018/19: Methodology Manual

 NHS England and NHS Improvement
CCG improvement and assessment framework methodology manual 2018/19

Publication Approval Number: 000844
Version number: 1.0
First published: 11 July 2019
Prepared by: NHS England
Classification: OFFICIAL

This document can be made available in alternative formats, such as easy read or large print,
and may be available in alternative languages, upon request. Please contact the Performance
Analysis IAF Team at nhs.oversightframework@nhs.net
Contents
 Purpose ......................................................................................... 2
 Introduction .................................................................................... 3
 Indicators ....................................................................................... 4
 Time period ........................................................................................................... 4
 Frequency ............................................................................................................. 4
 Timeliness ............................................................................................................. 4
 Standardisation and risk adjustment ..................................................................... 5
 Assurance ............................................................................................................. 5
 Indicator banding ........................................................................... 6
 Measures of deviation ........................................................................................... 6
 Transformation and z scores ................................................................................. 6
 Over-dispersion ..................................................................................................... 7
 Scores and thresholds ........................................................................................... 8
 Missing data .......................................................................................................... 9
 Extreme values.................................................................................................... 10
 Aggregation of domain-weighted scores ...................................... 11
 Aggregation and weighting .................................................................................. 11
 Assessment ratings ............................................................................................. 11
 Choice of thresholds ............................................................................................ 12
 Presentation and visualisation ..................................................... 13
 MyNHS ................................................................................................................ 13
 Data tool .............................................................................................................. 13
 Underlying data ................................................................................................... 13
 Disclosure control ................................................................................................ 13
 Revisions ............................................................................................................. 14
 Annex A: Overview of process ..................................................... 15
 Annex B: Indicator specification ................................................... 16

1 | Contents
Purpose
 To summarise the methods used in the production of indicators and ratings in the
 CCG Improvement and Assessment Framework.

2 | Purpose
Introduction
 The CCG Improvement and Assessment Framework (CCG IAF) assists
 improvement alongside the statutory assessment function of NHS England (NHSE).
 It aligns with NHSE’s Mandate and planning guidance, with the aim of unlocking
 change and improvement in a number of key areas. This approach aims to reach
 beyond CCGs, enabling local health systems and communities to assess their own
 progress from ratings published online.

 The 2018/19 Framework includes a set of 58 indicators and, at the end of the
 financial year, there is a process to derive an overall year-end assessment for each
 CCG. A high-level summary of the process can be found in Annex A.

3 | Introduction
Indicators
 The list of indicators used is in the spreadsheet in Annex B. Further detail about the
 indicators is in the “Technical annex 2018/19” document available at:

 https://www.england.nhs.uk/commissioning/ccg-assess/

 The main considerations when selecting and defining indicators were:

 Time period
 In deciding what time period should be used for an indicator, the aim was to provide
 denominators large enough to reliably identify statistically significant differences in
 performance.

 For example, for an indicator with an average CCG proportion of 0.4 (40%) based
 on an average of about 400 individuals per year, the standard error of a typical
 CCG’s value based on 3 months’ data is estimated as √((0.4 x (1-0.4))/100) =
 0.048. This would allow a difference of about 10 percentage points from a
 reference indicator value (e.g. a standard) to be identified as statistically significant.

 If opinion was that a difference of 5 percentage points from standard was the
 minimum material difference and there was a need to identify such differences, then
 indicator values based on a quarter’s data would not meet the need, as many
 CCGs would have values which were materially but not statistically significantly
 different from the standard. In such circumstances, use of 12 months’ rather than 3
 months’ data was considered, as this would halve the estimated standard error, and
 allow such differences to be identified. If quarterly results were important, then use
 of a rolling twelve months’ data recalculated every 3 months was considered.

 Frequency
 Once the required time period has been identified, the frequency was chosen to
 meet business needs, with the use of rolling data periods where needed.

 Timeliness
 The most recent available data were used and indicators were aligned as closely as
 possible with the 2018/19 financial year. The exact time periods used for each
 indicator are provided in the table at Annex B.

4 | Indicators
Standardisation and risk adjustment
 Where needed, indicators were standardised or risk adjusted to provide a fair
 assessment of CCGs.

 Assurance
 The NHS Digital document below was used as a guide to ensure indicators
 selected for the framework were fit for purpose:

 https://files.digital.nhs.uk/B2/D99FE9/Application%20Guidance.docx

5 | Indicators
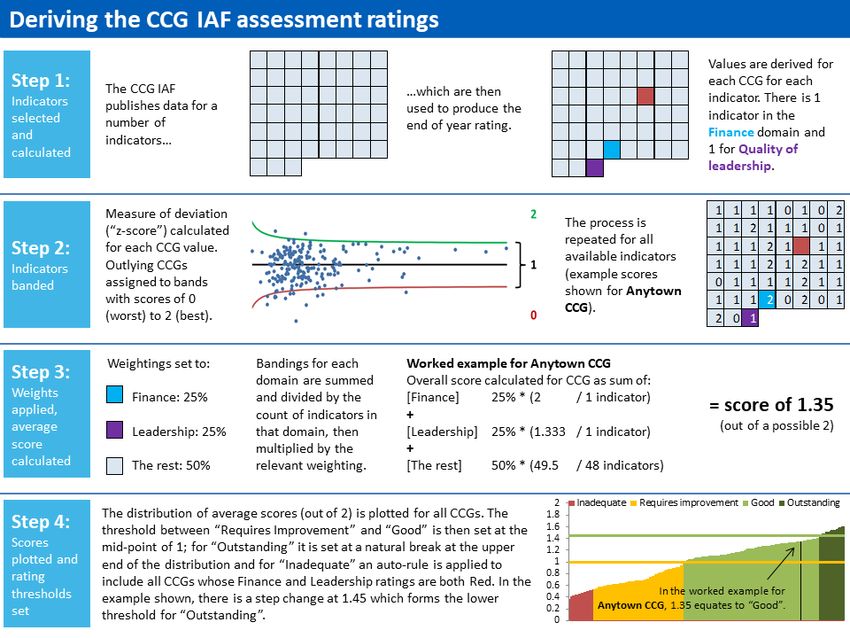
Indicator banding
 The general approach to indicator banding is set out below. Annex B contains
 specifics for each indicator. All scores were calculated on a scale of 0 (bad) to 2
 (good).

 Measures of deviation
 Where there was an agreed national standard, target, ambition or trajectory (as
 detailed in Table 1), deviation was measured relative to the standard, target,
 ambition or trajectory value. Otherwise, deviation from the England mean value was
 measured.

 In most cases, the England mean value for a given indicator was calculated as ∑(r)
 / ∑(n) where r was the indicator numerator and n was the indicator denominator. In
 isolated cases (104a Injuries from falls in people aged 65 and over, 106a Inequality
 in unplanned hospitalisation for chronic ambulatory care sensitive and urgent care
 sensitive conditions, 127b Emergency admissions for urgent care sensitive
 conditions, and 127f Population use of hospital beds following emergency
 admission), the England mean value was provided alongside CCG-level data and
 deviation from this value was measured.

 Transformation and z scores
 z scores were calculated for most indicators where this was possible, using
 transformation where necessary to stabilise the variance.

 • For proportions (equivalently percentages), the arcsin√ transformation
 was used:
 z = 2√ (arcsin√ / - arcsin√ )
 where the observed proportion had numerator r and denominator n, and p
 was the England mean proportion, or the value of the standard. The
 standard error in this case was:
 s = 1⁄
 (2√ )
 • For rates, the √ transformation was used:
 z = 2(√ - √ )
 where O was the observed count and E was the expected count if the
 England mean rate was applied. The standard error in this case was:

6 | Indicator banding
s = 1⁄
 (2√ )
 • Otherwise, where available, the value of the standard error s was used, or
 an estimate:
 ( − )
 s= ⁄(2 × 1.96)

 where and were the upper and lower 95% confidence limits,
 respectively. Here, z was the deviation from the England mean or standard,
 divided by s.
 • Where z scoring was unsuitable, bandings were derived directly on the
 same 0-2 scale:
 – RAG ratings: Red = 0, Amber = 1, Green = 2 (or Red = 0, Amber = 0.67,
 Green = 1.33, Green star = 2 where there was a four point scale).
 – Y/N ratings (where Y was good) were scored Y = 2, N = 0.
 – A direct relationship with “good”/“bad” was used where possible – e.g. a
 percentage based on a score of 0-15, where below 10 was “bad”, would
 have scored 0% to 66.7% as 0, between 66.7% and 83.3% as 1, and
 above 83.3% as 2.
 – Otherwise, quartiles or deciles were used, with the lowest scored 0, the
 highest 2, and others 1.

 Over-dispersion
 For most indicators where z scores were used, over-dispersion corrections were
 applied1. A random effects model was used, whereby excess variation in the CCG
 indicator values was assumed to be due to shortcomings in the risk adjustment
 processes. In calculating the over-dispersion parameter 2 , 10% of the CCG data
 values were winsorised (their values reset to the 10th or 90th percentile values) at
 each end of the distribution. z scores were then rescaled by multiplying by
 √ 2 ⁄( 2 + 2 ) where s was the standard error of the data point.

 Over-dispersion corrections were not applied to indicators where there were agreed
 standards or targets (listed in the table below) as CCGs were expected to meet
 these irrespective of variation which might form part of a risk adjustment process.
 Corrections were applied, however, where there were national ambitions or
 trajectories which applied primarily at the national level, rather than being expected
 to be met by each CCG regardless.

 1The calculation and application of the over dispersion parameter used the method described in
 Spiegelhalter, D.J (2005) [Funnel plots for comparing institutional performance. Statistics in
 Medicine 24:1185-1202].

7 | Indicator banding
For a small number of indicators, over-dispersion corrections were not applied due
 to the fact that the data needed to calculate them were unavailable.

 Scores and thresholds
 Where z-scores were available, they were converted to scores as follows:

 • If z
122a Cancers diagnosed at early stage 53.5% (trajectory)

 122b People with urgent GP referral having first definitive 85% (standard)
 treatment for cancer within 62 days of referral

 122c One-year survival from all cancers 75% (ambition)

 123a Improving Access to Psychological Therapies – 50% (standard)
 recovery

 123c People with first episode of psychosis starting 53% (standard)
 treatment with a NICE-recommended package of
 care treated within 2 weeks of referral

 125d Maternal smoking at delivery 6% (trajectory)

 126a Estimated diagnosis rate for people with dementia 66.7% (standard)

 127c Percentage of patients admitted, transferred or 95% (standard)
 discharged from A&E within 4 hours

 129a Patients waiting 18 weeks or less from referral to 92% (standard)
 hospital treatment

 131a Percentage of NHS Continuing Healthcare full 15% (target)
 assessments taking place in an acute hospital
 setting

 133a Percentage of patients waiting 6 weeks or more for 1% (standard)
 a diagnostic test

 Missing data
 Indicators were only used in the assessment if values for the majority of CCGs were
 available. Three indicators, 123d Children and young people’s mental health
 services transformation, 123h Cardio metabolic assessment in mental health
 environments, and 105c Percentage of deaths with three or more emergency
 admissions in the last three months of life, were excluded because data was not
 available at the time of assessment.

9 | Indicator banding
In cases where there were missing or seriously incomplete data for individual CCGs
 and these represented a failing on the part of the CCG (for example, a failure to
 encourage adequate participation in the diabetes clinical audit), CCGs were given a
 banding of 0 for the indicator(s) in question. Otherwise, they were given a central
 banding of 1.

 Extreme values
 Extreme values were checked and, if found to be errors, treated as missing (as
 detailed above). Then, all indicators were checked visually using funnel plots, to
 ensure calculations had not been skewed by any remaining extreme values. Note
 that if over-dispersion corrections were used as part of a z-scoring process for the
 indicator, such values were included in the portion of the distribution which was
 winsorised prior to calculating the corrections.

10 | Indicator banding
Aggregation of domain-
 weighted scores
 Once each indicator had been banded for each CCG on the 0-2 scale, they were
 aggregated at CCG level into three separate “domains” (listed below), which were
 each weighted. These “domain-weighted scores” formed the basis for application of
 thresholds between final rating categories. Note that the scores themselves are not
 made public as this would imply a “league table”, which is a more subtle
 classification than is justified by the data.

 Aggregation and weighting
 The three domains and their weights are listed below. The table at Annex B details
 the domain to which each indicator was assigned.

 • Quality of leadership (indicator 165a): 25%
 • Finance (indicator 141b): 25%
 • The remaining performance and outcomes measures: 50%
 For each CCG, the aggregated score was constructed as:
 = ∑ ( ⁄ )
 where the weighting for the domain to which the indicator belonged was ,
 the CCG banding for the indicator was (a value between 0 and 2), and
 was the denominator, i.e. the overall count of indicators in the weighting
 domain (this was 1 for Leadership, 1 for Finance, and 55 for the
 remainder2). A worked example is provided at Step 3 of Annex A.

 Assessment ratings
 CCGs were ranked by their overall scores and divided into four distinct categories:

 • Outstanding
 • Good
 • Requires improvement

 2 Three indicators, 123d Children and young people’s mental health services transformation, 123h
 Cardio metabolic assessment in mental health environments, and 105c Percentage of deaths with
 three or more emergency admissions in the last three months of life, were excluded because data
 was not available at the time of assessment.

11 | Aggregation of domain-weighted scores
• Inadequate

 Choice of thresholds
 The thresholds between categories were defined such that they would, where
 possible, separate CCGs with meaningful differences in their overall scores. In
 addition, unless there were compelling reasons otherwise, it was expected that
 there would be more CCGs in the middle two categories than in the two extremes.

 The following overarching principles were applied:

 • Between Requires improvement and Good:. If a CCG was performing
 relatively well overall, their weighted score would be expected to be greater
 than 1. If every indicator value for every CCG were within a mid-range of
 values, not significantly different from its set reference point, each indicator
 for that CCG would be scored as 1, resulting in an average (mean)
 weighted score of 1. This was therefore selected as an appropriate
 threshold between the two middle categories “good” and “requires
 improvement”.
 • Between Good and Outstanding: The 50% weighting afforded to the
 Finance and Leadership indicators, which are both discrete (with 3 and 4
 categories, respectively), resulted in a series of natural breaks in the
 distribution. In examining the 2018/19 scoring distribution, a natural break
 was identified at 1.45. This was therefore selected as the threshold
 between the top and second categories.
 • Between Inadequate and Requires improvement: CCGs were rated in
 the bottom category if they were rated “Red” on both the Finance and
 Leadership indicators.

12 | Aggregation of domain-weighted scores
Presentation and
 visualisation
 MyNHS
 The indicator set, including the end-of-year ratings is published on MyNHS at:

 https://www.nhs.uk/service-search/performance-indicators/organisations/ccg-better-
 care

 The indicators are presented by theme (Better Health, Better Care, Sustainability
 and Leadership) and area. The published CCG IAF is refreshed quarterly, although
 not all individual indicators are updated. The overall assessment scores are
 updated annually.

 Data tool
 NHS England and CCGs are able to interrogate indicators in detail using the
 interactive Tableau CCG IAF dashboard, which is updated by NHS England
 alongside each quarterly indicator refresh.

 Underlying data
 Most indicators are formed by secondary analyses of pre-published data. The CCG
 IAF is not intended as a vehicle for first publication. An extract containing the
 underlying data values is however released on NHS England’s website each
 quarter at:

 https://www.england.nhs.uk/commissioning/ccg-assess/iaf/

 Disclosure control
 For the majority of indicators, which are formed from secondary analyses of pre-
 published data, issues of disclosure control do not arise. However, in rare cases
 where the IAF is the vehicle for publication of new and primary data, compliance is
 ensured with the NHS Anonymisation Standard detailed at:

 https://digital.nhs.uk/data-and-information/information-standards/information-
 standards-and-data-collections-including-extractions/publications-and-
 notifications/standards-and-collections/isb1523-anonymisation-standard-for-
 publishing-health-and-social-care-data

13 | Presentation and visualisation
Revisions
 Where updated indicator values become available, indicators are reissued as part
 of the next regular quarterly release. In the event that significant errors which are
 material at a national level and which go beyond the level of revisions normally
 expected from quarter to quarter come to light, consideration is given to issue of a
 special revision. Advice on these matters is sought where required from the NHS
 England Lead Official for Statistics.

14 | Presentation and visualisation
Annex A: Overview of process
Annex B: Indicator specification
Description Outlier calculation Banding

 Band
 Assessment Domain Time Indicator Required Included in z- Deviation Winsorisation Band Band Band Band Band
Ref Name Transformation Overdispersion Band 0 if Band 1 if 1.33 Band 2 if
 domain weighting period type direction assessment scored from level 0.5 if 0.67 if 0.75 if 1.25 if 1.5 if
 if
 Percentage of children aged 10-11 2015/16 to England Random
102a Other 50% Proportion Low Yes Yes arcsin√ 10% z≥1.96 -1.96≤z
Description Outlier calculation Banding

 Band
 Assessment Domain Time Indicator Required Included in z- Deviation Winsorisation Band Band Band Band Band
Ref Name Transformation Overdispersion Band 0 if Band 1 if 1.33 Band 2 if
 domain weighting period type direction assessment scored from level 0.5 if 0.67 if 0.75 if 1.25 if 1.5 if
 if
 Not
 Achieving
 18-19 Q3 achieving
 Improving Access to Psychological standard
123a Other 50% (3 month Proportion High Yes Yes Target arcsin√ z
Description Outlier calculation Banding

 Band
 Assessment Domain Time Indicator Required Included in z- Deviation Winsorisation Band Band Band Band Band
Ref Name Transformation Overdispersion Band 0 if Band 1 if 1.33 Band 2 if
 domain weighting period type direction assessment scored from level 0.5 if 0.67 if 0.75 if 1.25 if 1.5 if
 if
 Not
 Achieving
 Percentage of patients admitted, achieving
 Apr-18 to standard
127c transferred or discharged from A&E within Other 50% Proportion High Yes Yes Standard arcsin√ z
You can also read