DATA PRESENTATION BUFFALO COUNTY

Page created by Steve Lucas
 
CONTINUE READING
DATA PRESENTATION BUFFALO COUNTY
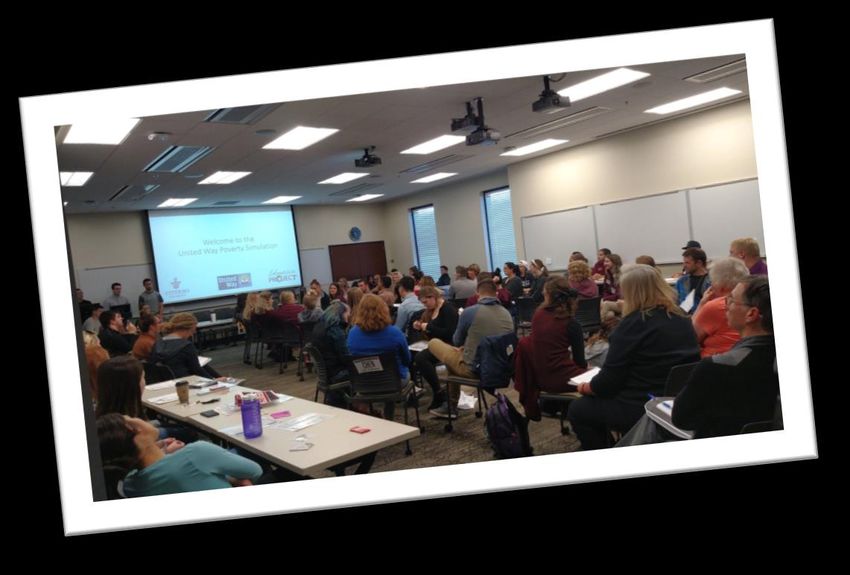
BUFFALO COUNTY
DATA PRESENTATION
DATA PRESENTATION BUFFALO COUNTY
Agenda
    Purpose: Share the Community Needs Assessment data and
    establish priorities

Housekeeping

COMPASS Now 2018 Data Presentation

Generate Top 5 Concerns

Break

Vote on Top 5 Concerns
Generate Community Resources and Closing
DATA PRESENTATION BUFFALO COUNTY
Welcome
DATA PRESENTATION BUFFALO COUNTY
Housekeeping
Feel free to step outside for phone calls.

If you have questions during the presentation,
 please feel free to ask.

Speak the truth from your experience.

All opinions and ideas are valuable.

Bathroom locations.
DATA PRESENTATION BUFFALO COUNTY
Process
• Phase 1: Collect data
   •   Random Household Survey
   •   Convenience Sampling
   •   WALHDAB Core Data Set
   •   Focus Groups
• Phase 2: Organize and
  analyze data
• Phase 3: Prioritize needs
DATA PRESENTATION BUFFALO COUNTY
Community Needs
Assessment Data
DATA PRESENTATION BUFFALO COUNTY
Demographics:
Buffalo County Population 13,319
                                                               Buffalo County Population by Age
    • 50.7% Male and 49.3%
      Female                                                                    65+   0-17
    • 11.5% with a disability                                                   19%   21%

    • 100% Rural
                                                                            45-64
    • 27.1% households are families
                                                                                       18-44
                                                                             31%        29%

      with children
     Buffalo County Population by Race                              Buffalo County by Ethnicity

                  Other
                   2%                Multiple                               Non-
   White                               1%                                  Hispanic            Hispanic
   98%                       Other                                           98%                  2%
                                         Black
                              1%
                                          0%

                                  Asian Nat Am/Al
                                           Nat
                                   0%
                                           0%

                           American Community Survey 5-Yr Estimates 2011-2015
DATA PRESENTATION BUFFALO COUNTY
Demographics: Regional Population
                               Changes
                                  Population Change, Percent by Tract,
                                  US Census 2000 - 2010

                                     Over 10.0% Increase ( )                     178.82% Increase in
                                     1.0 - 10.0% Increase ( )                   Hispanic population of
                                     Less Than 1.0% Change ( /- )
                                     1.0 - 10.0% Decrease ( - )
                                                                                 Buffalo County from
                                     Over 10.0% Decrease ( - )                        2000-2010
                                     No Population or No Data
                                      Report Area

                       Percent of the Population Age 65 and Older
    2015                                  2025                                                    2035

US Census Bureau, Decennial Census. 2000 - 2010; WI DOA Demographic Services, Population Projections, Vintage 2013
DATA PRESENTATION BUFFALO COUNTY
Comparing Survey Respondents
      Random Household Survey                                Convenience Sample
Sex:                                             Sex:
- 33.3% Male, 64.7% Female                       - 18.5% Male, 81.5% Female
Race:                                            Race:
- 100% White Non-Hispanic                        -   100% White Non-Hispanic

Income:                                          Income:
     Less than $10,000                   0.0%         Less than $10,000                    0.0%
      $10,000-$25,000                    17.0%         $10,000-$25,000                     7.7%
      $25,001-$50,000                    40.4%         $25,001-$50,000                    30.8%
      $50,001-$75,000                    8.5%          $50,001-$75,000                    23.1%
      $75,001-100,000                    10.6%         $75,001-100,000                    19.2%
     Over $100,000                       23.4%        Over $100,000                       19.2%

Education:                                       Education:

     Did not graduate from high school   5.9%         Did not graduate from high school    0.0%
     High school diploma                 29.4%        High school diploma                 22.2%
     Vocational school                   13.7%        Vocational school                   11.1%
     Some college                        9.8%         Some college                        18.5%
     College graduate                    23.5%        College graduate                    25.9%
     Post graduate/professional          17.6%        Post graduate/professional          22.2%
DATA PRESENTATION BUFFALO COUNTY
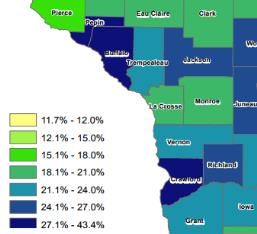
Air, Environment, and Water Quality
                        Good air quality!
                         Below National
                          Ambient Air
               Quality Standards for Ozone and
                Particulate Matter. Zero days
               exceeding emissions standards.                                                      Nearly 1 of every 4 persons in the
                                                                                                     county has low food access

                                                            COMPASS 2018 Responses
          Quality of water in the rivers and lakes in your                                   The efforts being made in your community to
                            community                                                              protect the natural environment
                          Poor /Fair     Good        Excellent                                        Poor/Fair            Good           Excellent
                                                                                                    5.9%                                     6.5%
                   21.6%                                   13.5%
                                                                                                    43.1%                                    32.3%
                   43.1%                                   62.2%

                                                                                                    51.0%                                    61.3%
                   35.3%                                   24.3%
                    RHS                                      CS                                       RHS                                      CS

Data Source: US Department of Agriculture, Economic Research Service, USDA - Food Access Research Atlas. 2015; Centers for Disease Control and Prevention, National
                                                      Environmental Public Health Tracking Network. 2012
Cancer and Chronic Disease
          Cancer Incidence Rates (per 100,000                                                      Percent who have had recommended
                      population)                                                                              screenings
                              Buffalo County        WI                                                                 Buffalo County       WI
       468                                                                                                               78.2% 78.2%
 383                                                                                         72.8%
                                                                                                      70.2%
                                                                                                                                                     66.1% 65.9%
                   106 128                                            104 116
                                          38          54    61
                                     27

All Cancers         Breast         Colon and             Lung        Prostate
                                    Rectum                                                    Mammogram                  Cervical Cancer           Colorectal Cancer

             Buffalo County Chronic Disease
                       Prevalence
  45.8%
                                                                                                                    3 per 1,000
                                                                                                              Buffalo County coronary heart
                                                                      27.0%                                   disease hospitalization rate per
                                                                                                               1,000 population. WI rate is 3
                     7.4%             8.0%                                                                         per 1,000 population.
                                                      5.4%

   High             Asthma          Diabetes     Heart Disease      High Blood
Cholesterol                                                          Pressure
             Data Source: Centers for Disease Control and Prevention, Behavioral Risk Factor Surveillance System. Additional data analysis by CARES. 2011-12;
                                 http://www.wchq.org/index.php; Quarter 1 2015 through Quarter 4 2016; WI Cancer Reporting System
Community Safety
                           COMPASS 2018 Community Safety Survey Questions
                                                     Poor /Fair       Good       Excellent

                                                                                               5.4%
 11.8%            10.8%             21.6%                                    14.0%                                                      21.6%
                                                        24.3%
                                                                                                                  37.3%
                                                                                               45.9%
 64.7%                                                                       50.0%
                  73.0%             58.8%               56.8%                                                                           62.2%
                                                                                                                  58.8%
                                                                                               48.6%
                                                                             36.0%
 23.5%            16.2%             19.6%               18.9%                                                                           16.2%
                                                                                                                   4.0%
 RHS               CS                RHS                  CS                    RHS              CS                  RHS                 CS
 Effort to prevent crime             Overall quality of law           Community's ability to respond to           Safety of neighborhood
                                        enforcement                       major safety threats

                                                               Injury-Related Hospitalization Rate per 100,000
                                                                                 Population
              32                                                                         Buffalo County    WI
     Number of violent                                                            418
        crimes per                                              349

        100,000 in
                                                                                                                                  125
      Buffalo County                                                                                            82

                                                                        Falls                                         Poisoning

                   FBI Uniform Crime Reports; DHS WISH data (2014) https://www.dhs.wisconsin.gov/wish/injury-hosp/form.htm
Dental Care
               35%                                                   63.2%                                                      27%
   Percent of WI people with                                Percent of Buffalo County                              Percent of Buffalo County
disabilities did not visit a dentist                       population with fluoridated                          Residents over the age of 2 that
      within the past year.                                       public water                                  did not visit a dentist in the past
                                                                                                                               year.

                                                          COMPASS 2018 Responses
                                                             Poor /Fair       Good       Excellent

                                                                                                               29.4%                   18.9%
               37.3%                   32.4%                   40.0%                   40.5%
                                                                                                               33.3%                   43.2%
               35.3%                   51.4%
                                                               52.0%                   45.9%
               27.4%                                                                                           37.2%                   37.8%
                                       16.2%                    8.0%                   13.5%

                RHS                      CS                     RHS                      CS                     RHS                      CS
               Overall dental health?                       Your Access to dental care?                  Ability to pay for dental health?
Data Sources: Environmental Public Health Data Tracker; US Department of Health Human Services, Health Resources and Services Administration, Area Health
                                                       Resource File. 2015. Source geography: County
Diet and Exercise
                                                                             COMPASS 2018 Responses
                                                                                     Poor/Fair      Good      Excellent

         74%                                                       21.6%               33.3%
                                                                                                             13.5%              18.0%               19.4%
                                              44.0%
        Rate of                                                                                              43.2%                                  29.0%
                                                                   51.4%                                                        52.0%
      overweight                              36.0%                                    45.1%
      and obesity                                                                                            43.2%                                  51.6%
                                              20.0%                27.0%               21.6%                                    30.0%
     for WI adults
         with a                                 RHS                    CS               RHS                   CS                 RHS                  CS
       disability                           Your access to healthy food            Ability to pay for healthy food          The availability of leisure time
                                                     choices                                   choices                      opportunities that meet your
                                                                                                                                      interests

                                                                                              Percent Population With No Leisure Time
       Percent Adults with Body Mass Index > 30.0                                                        Physical Activity
                   (Medically Obese)
                                                                                                                                                      36.0%
    31.4%
                       30.0%
                                                                                      23.6%                                            21.8%
                                                                                                      19.7%           18.2%
                                                                27.5%
                                           26.7%

Buffalo County           WI                  MN                   US                 Buffalo            WI             MN               US          WI with
                                                                                     County                                                        Disabilities
  Centers for Disease Control and Prevention, National Center for Chronic Disease Prevention and Health Promotion. 2013; WI Department of Health Services, BRFS
                                                                             2008-2011
Drug and Alcohol Use                                                                                       Drug Poisoning Death Intent 2000-2016
                             Buffalo County Drug Overdose Deaths 2000-2016
                     4
  Number of Deaths

                     3                                                                                                                     Intentional
                                                                                                                                               31%
                     2
                                                                                                                           Unintentional
                     1                                                                                                         69%

                     0
                      2000      2002   2004    2006   2008      2010         2012     2014        2016
                                                      Year

                                                                       Percent of driving deaths with alcohol involvement
                                                                                                                     42%
                                  23%                  38%                           38%                                             37%
                              Buffalo County                           32%                           32%                                                             31%
                               adults drink
                               excessively

                                                                                                                                                      0%

                                                      Buffalo      La Crosse        Monroe      Trempealeau        Vernon             WI           Houston           MN

Fatality Analysis Reporting System 2011-2015 data; Centers for Disease Control and Prevention, Behavioral Risk Factor Surveillance System. Accessed via the Health Indicators
                                       Warehouse. US Department of Health Human Services, Health Indicators Warehouse. 2006-12
Education                                                                     COMPASS 2018 Responses
                                                                              Poor/Fair          Good           Excellent
                                                                                                                                    4.2%
        11%                                             35.7%
                                                                                   21.4%                   29.4%                    29.2%
 of African American                                                                                       35.3%
                                                                                   57.1%
 4th grade students in                                  52.4%                                                                       66.7%
 WI read at proficient                                  11.9%                      21.4%                   35.3%

 or above compared                                        RHS                       CS                       RHS                     CS
    to 44% of white                            Your community as a place that meets your Your ability to pay for education beyond
       students.                                      family's educational needs          high school for you and/or your family

                                   9th grade cohort that graduates in four years
                                                                                            96.2%
       94.0%                                              94.0%            95.0%
                         93.0%            93.0%

                                                                                                             88.0%

                                                                                                                            83.0%

      Buffalo          La Crosse        Monroe         Trempealeau         Vernon          Houston             WI            MN

                Department of Education ED Facts; Minnesota Report Card; Annie E. Casey Foundation Kids Count Data Center
Employment
                            COMPASS 2018 Responses
                         Opportunities in your job to gain
                                                                                                                                       3.2%
                          additional knowledge or skills
                                                                                                                             Buffalo County
                                                                                                                           Unemployment Rate
                                Poor/Fair          Good          Excellent
                                                                                                                           December 2017 (not
                           21.9%                                      11.1%                                                seasonally adjusted)
                                                                      37.0%
                           46.9%

                                                                      51.9%
                                                                                                                                     66.3%
                           31.3%                                                                                         Buffalo County Labor
                            RHS                                         CS
                                                                                                                        Force Participation Rate
                 Availability of jobs with wages that offer a
                   comfortable standard of living for you
                                Poor/Fair          Good          Excellent
                                                                      3.7%
                            8.5%
                                                                      18.5%
                           29.8%

                                                                      77.8%
                           61.7%

                            RHS                                         CS
WI Department of Workforce Development (Bureau of Workforce training-Labor Market Information-http://WORKnet.Wisconsin.gov); U.S. Census Bureau, 2012-2016 American Community
                                                                            Survey 5-Year Estimates
Family and Social Support
                        8                                                                                                171%
       Arrest rate per 1,000 of                                                                                 Increase in out-of-
        Buffalo County youth                                                                                  home placements for
       between 10-17 years of                                                                                  children from 2011-
                 age                                                                                                  2015.

                                                 COMPASS 2018 Responses
                                                      Poor/Fair         Good         Excellent
                                                         4.2%
       13.8%                  13.0%                                               10.0%                     8.8%                 7.1%
                              13.0%                                               25.0%
       41.4%                                            62.5%                                                                    46.4%
                                                                                                            67.6%
                              73.9%                                               65.0%
       44.8%                                                                                                                     46.4%
                                                        33.3%                                               23.5%

        RHS                      CS                      RHS                        CS                       RHS                  CS
 Availability of quality childcare for your      Your ability to pay for childcare in your            Efforts to prevent abuse or neglect of
                  children                                      community                                            children

                   County Health Rankings; data is from 2014. Houston County data is from 2011 and is from Kids Count Database
                                      Kids Count Database/Wisconsin Council on Children and Families 2015
Family and Social Support
                                  COMPASS 2018 Responses
 Your community as a place that meets the         Efforts to prevent abuse or neglect of
      overall needs of elderly persons                            seniors
         Poor/Fair   Good      Excellent               Poor/Fair    Good     Excellent
                                  3.4%
       12.5%                                         11.9%                      3.8%
                                 37.9%
       45.8%                                                                   53.8%
                                                     59.5%

                                 58.6%
       41.7%                                                                   42.3%
                                                     28.6%

       RHS                         CS                 RHS                        CS
 Your community as a place that meets the         Efforts to prevent abuse or neglect of
  overall needs of persons with disabilities             persons with disabilities
         Poor/Fair   Good      Excellent                Poor/Fair   Good      Excellent

       15.6%                      6.9%                10.5%                      3.8%
                                 37.9%
                                                                                53.8%
       53.3%                                          57.9%

                                 55.2%
       31.1%                                          31.6%                     42.3%

       RHS                         CS                 RHS                         CS
Health Care                                                                                                          6,590:1
                                                                                                     Ratio of Population to Primary
                                                                                                       Care Physicians in Buffalo
                   COMPASS 2018 Responses                                                                       County.
                            Poor/Fair     Good      Excellent

 22.0%          27.0%          35.3%           29.7%            25.5%       18.9%                                        62.8%
                                                                37.3%
                                                                            32.4%                                Buffalo County
 64.0%          54.1%                          45.9%
                               51.0%                                                                         Children aged 19 to 35
                                                                37.3%       48.6%
 14.0%          18.9%          13.7%           24.3%                                                         months who received
   RHS             CS           RHS              CS             RHS            CS                                recommended
 Your overall health               Your access to           Your ability to pay for                              immunizations
                                    healthcare                   healthcare

                                        Yes    No
                                                                                                     2016 Vaccination Coverage Among
     3.90%
                           11.10%                                                                     Buffalo County Adults by Vaccine
                                                                        46.2%
                                                    69.4%
    96.10%                                                                                     PPSV23                                           45.35%
                           88.90%
                                                                        53.8%
                                                    30.6%                                       PCV13                                          44.26%

      RHS                     CS                    RHS                   CS                    Zoster                             29.36%
Does everyone in your family have              Was there a time in the past 12                     HPV                       21.26%
       health insurance?                      months that you needed to see a
                                              doctor but did not because of the               Tdap (1)                                                     60.13%
                                                            cost?

 County Health Rankings; data is from 2014. Wisconsin Department of Health Services. Behavioral Risk Factor Survey 2008-*2011; WI Immunization Registry.
Housing                                                                                                          0
     COMPASS 2018 Responses                                                                   The number of homeless
                                                                                              people in Buffalo County
Your ability to pay for housing for you                                                        on one night in January
          and/or your family                                                                            2018
       Poor/Fair          Good          Excellent

     28.6%                                 22.2%                             Percent Occupied Housing Units with
                                                                             One or More Substandard Conditions
                                           48.1%
     49.0%
                                                                                                                                      34.71%
     22.4%                                 29.6%                                                                  30.83%
                                                                           28.11%              28.66%
      RHS                                    CS

                     39%
        Buffalo County renters
          paid gross rent that
        equaled 30% or more                                                 Buffalo          Minnesota           Wisconsin        United States
         of household income                                        (overcrowding, high housing costs, or lack of kitchen or plumbing facilities)

      Data Source: US Census Bureau, American Community Survey. 2011-15. Source geography: Tract; WI DHS 2015; MN Department of Health 2015; U.S.
                      Census Bureau, 2012-2016 American Community Survey 5-Year Estimates; Western Dairyland Point-In-Time Results
Income                                                                                                              1 of every 3 school-age
                 Buffalo County Family Income                                                                                children in
                          Comparison                                                                                   La Crosse County are
$80,000
                                                                                                                        eligible for Free or
$70,000
$60,000
                                                Median Family Income                        44%                        Reduced-Price Lunch
$50,000                                                                            of WI adults with
$40,000
$30,000
                                                                                    disabilities earn
$20,000                                                                            less than $20,000
$10,000                                                                                 annually.
     $0
                Married Couple    Single Males with Single Females with
                 Families with         Children           Children
                   Children

                      COMPASS 2018 Results                                               Poverty by Race and Ethnicity in Buffalo
                                                                                                         County
                   Poor/Fair         Good           Excellent
          6.4%           3.8%               6.3%                                                        45.0%
                          15.4%                                 10.7%
      27.7%
                                            47.9%               35.7%
                                                                                                                              25.7%
                          80.8%                                                             21.1%
      66.0%                                                     53.6%                                                                  19.1%
                                            45.8%
                                                                                                                                                  13.5%
                                                                               11.1%
          RHS               CS              RHS                  CS
                                                                                                                     0.0%
   Efforts to reduce poverty in         Efforts to reduce hunger in
         your community                      your community                    White        Black    Nat Am/AK      Asian     Other   Multiple   Hispanic
                                                                                                         Nat
                                              US Census Bureau, American Community Survey. 2011-15. Source geography: Tract
Mental Health Care
                    COMPASS 2018 Responses
                            Poor/Fair     Good        Excellent
                                                                                                                   6,600:1
                                                                                                            Ratio of Population
                  24.3%         24.0%          19.4%              20.0%     16.7%                            to Mental Health
   43.1%
                                                                  40.0%     36.1%                           Providers in Buffalo
                                46.0%          50.0%
                  56.8%                                                                                           County.
   41.2%
                                                                  40.0%     47.2%
                                30.0%          30.6%
   15.7%          18.9%

    RHS             CS            RHS            CS               RHS         CS
   Your overall mental         Your access to mental Ability to pay for mental                    Rates of insufficient sleep and emotional
         health                     health care             health care                         support by disability status, Wisconsin adults
                                                                                                            ages 18-64, 2008-2010
                               116                                                                                 No Disability    Disability

                                                                                                                34%
                    Self-inflicted injury                                                                                                           30%
                    hospitalization rate                                                            20%
                                                                                                                                         14%
                     per 100,000. WI
                         rate is 99.
                                                                                                   Insufficient Sleep              Sometimes, rarely, or never
                                                                                                                                    receive emotional support

County Health Rankings (2012-2014 data): http://www.countyhealthrankings.org/; 2017 Mental Health Substance Abuse Needs Assessment Draft. DHS. 2015, WI DHS, BRFS
                                                                 2008-2011 landline-only dataset
Quality of Life
                                         30%
                                 Buffalo County
                               people age 65 years
                               and older who live
                                     alone

                                                      COMPASS 2018 Results
                                                           Poor/Fair     Good      Excellent

                                8.3%                     12.0%                      12.9%                      11.8%                   9.7%
        33.3%
                                                                                                                                      25.8%
                                                                                    32.3%                      37.3%
                               63.9%                     62.0%

        60.4%
                                                                                                                                      64.5%
                                                                                    54.8%                      51.0%
                               27.8%                     26.0%
        6.3%
         RHS                     CS                       RHS                         CS                        RHS                     CS
Overall rating of community as a place to live        A place where all people are treated                   A place where people of different
                                                 respectfully, regardless of their race, culture,          cultural/racial/ethnic backgrounds are
                                                  religion, gender, sexual orientation, income                  included in decision-making
                                                              level, disability, or age
                                                 2017 County Health Rankings; data is from 2011-2015 ACS
Sexual Activity and Reproductive Health
                 Rates of Infection per 100,000
                                      Buffalo      WI
                  503.9

          182
                                             108.7                         122
                                     22.7

           Chlamydia                  Gonorrhea                      HIV

                                                                                       Percent Adults Never Screened for
                                  13                                                               HIV/AIDS
                    Number of Buffalo                                                                             71.1%

                      County females
                    age 15-19 that give                                                65.5%
                      birth per 1,000                                                                                                        62.8%
                        population

                                                                                      Buffalo                       WI                         U.S.
2015 CDC National Center for HIV/AIDS, Viral Hepatitis, STD, and TB Prevention (NCHHSTP) (via Atlas Plus) and 2008-2014 WISH (via County Health Rankings); Centers for
                       Disease Control and Prevention, Behavioral Risk Factor Surveillance System. Additional data analysis by CARES. 2011-12
Tobacco Use

    Percent of WI Adults who Smoke Cigarettes
                                            14.30%
Earn more than $50,000 annually

        Earn $0-25,000 annually                                            40.50%

      People with Mental Illness                                     33%
                                                                                               Current Smokers, Adult, Percent of Adults
                          LGBTQ                                27%

                 HS Grad or GED                                  29.20%
                                                                                                    Over 26.0%
                                                                                                    22.1 - 26.0%
         People with Disabilities                                     35%                           18.1 - 22.0%
                                                                                                    Under 18.1%
                                                                                                    No Data or Data Suppressed
                                    0%   5% 10% 15% 20% 25% 30% 35% 40% 45%                         Report Area

             21% of all WI Adults smoke cigarettes

  Data Source: State of Wisconsin; 2011-2015 Wisconsin BRFSS. http://tobwis.org/files/download_file/47a3866bd556827. Wisconsin Tobacco Control and
                                                                 Prevention program.
Transportation
                              2018 COMPASS Responses
     The accessibility of public                 The convenience of public
          transportation                              transportation
       Poor/Fair   Good   Excellent                 Poor/Fair   Good   Excellent
                              0.0%                                         0.0%
    2.5%                      3.8%               2.8%                      4.0%
    5.0%                                         2.8%
                             96.2%                                        96.0%
    92.5%                                        94.4%

     RHS                       CS                RHS                        CS

  Your ability to pay for your own          The availability of safe bike routes to
                vehicle                                school or work
       Poor/Fair   Good   Excellent                 Poor/Fair   Good   Excellent
                                                 2.1%                      3.3%
                             14.3%
    27.5%                                        35.4%                     23.3%
                             50.0%
    52.9%
                                                 62.5%                     73.3%
                             35.7%
    19.6%

     RHS                       CS                 RHS                        CS
Small Group
        Discussion
How would you describe your community in
one word?

Based on the data presented, what are the top
concerns in your community?
Prioritization:
Using the data presented in the Power Point…
2. Please write your top 5 concerns on the
notecards provided. Write ONE priority per card.
3. Please give your cards to a meeting organizer.
4. Enjoy a brief 10-15 minute break
for snacks. We will reconvene to discuss top
priorities as decided by YOU!
Community Resources
Examine the top priorities as decided by community
members tonight.

What local resources, services, people or programs are
available to address these priorities?

Please write your ideas on Post-It notes and attach
them to the corresponding poster(s) around the room.
Thank you!
You can also read