GEOGRAPHIC DISPARITIES: HOW LOCATION AFFECTS BRAIN HEALTH AMY KIND, MD, PHD SEPTEMBER 10, 2021
←
→
Page content transcription
If your browser does not render page correctly, please read the page content below
GEOGRAPHIC DISPARITIES:
How Location Affects Brain Health

           32nd Annual Southern California
    Alzheimer’s Disease (AD) Research Conference
                 September 10, 2021

                  Amy Kind, MD, PhD
                ajk@medicine.wisc.edu
  University of Wisconsin School of Medicine and Public Health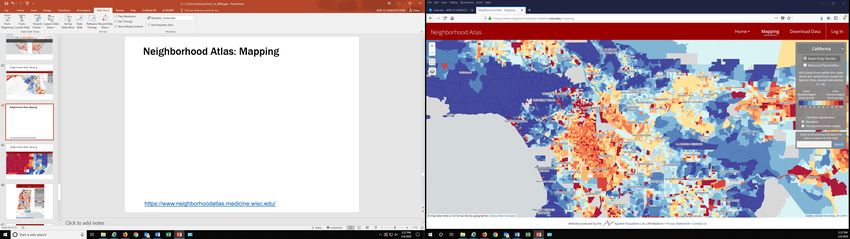
FUNDING DISCLOSURES

NIH/National Institute on Aging

NIH/National Institute on Minority Health
and Health Disparities

US Department of Veterans Affairs

                       Amy Kind, MD, PhD
                     ajk@medicine.wisc.edu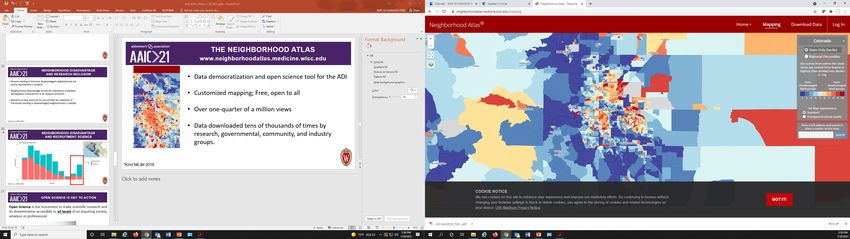
BRAIN HEALTH IS NOT DISTRIBUTED EQUALLY
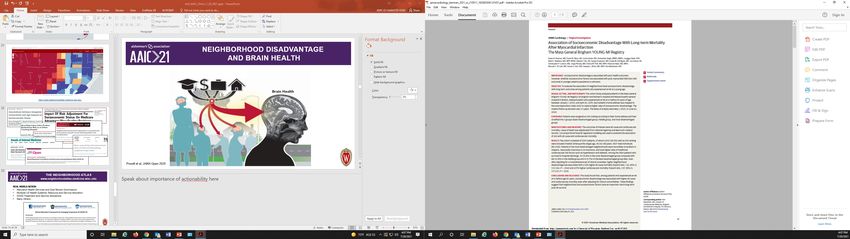
BRAIN HEALTH IS NOT DISTRIBUTED EQUALLY

                                       English Longitudinal Study of Ageing
                                         • 68% increase dementia incidence in those
                                             with lowest wealth independent of education
                                             and other factors

                                       Chinese Longitudinal Healthy Longevity Survey
                                          • Poverty associated with 34% increase in
                                            incident cognitive impairment

Cadar et al, JAMA Psychiatry, 2018; Chen et al, 2019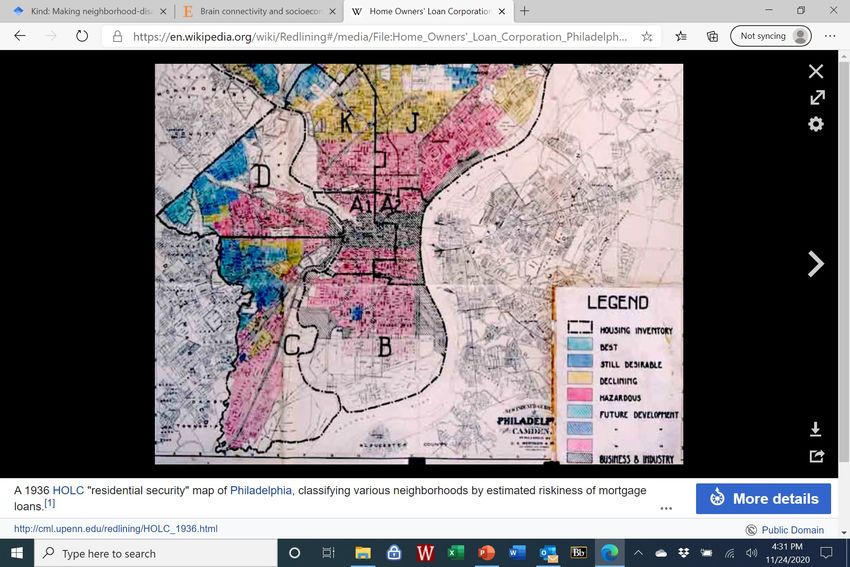
studies [11], it has been difficult to establish the magnitude             California [16,33] compared with whites. Evidence from
                       of racial/ethnic inequalities in dementia incidence. The re-               Hispanic/Latino Hispanic Community Health Study/Study

          web 4C=FPO
                                    BRAIN HEALTH IS NOT DISTRIBUTED EQUALLY
                       sults of the present study substantiate findings from prior
                       studies with dementia incidence estimates for African-
                                                                                                  of Latinos (HCHS/SOL) provides additional evidence that
                                                                                                  dementia risk likely varies markedly across Latino

                                                 Fig. 2. Dementia incidence rates per 1000 person-years by age and race-ethnicity, 2000–2013.
Mayeda, Glymour, Quesenberry and Whitmer. Alzheimers Dementia, March, 2016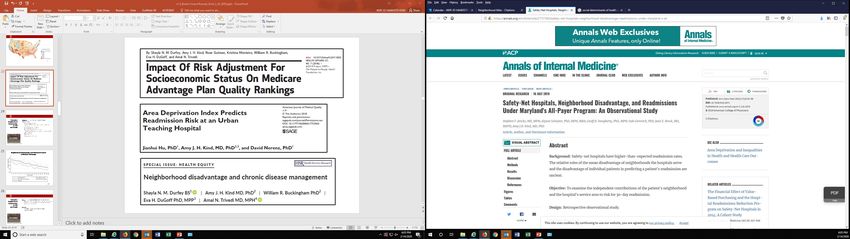
WHAT DRIVES DISPARITIES IN
  ALZHEIMER’S DISEASE?
Whenever Possible, Research Should
             Align Towards Action
                       ~
      Treatments, Interventions and Policy
       © cnbc.com

Source: www.Pixabay.com-- All images are released free of copyrights under Creative Commons CC0
MECHANISTIC APPROACH

EXPOSOME -- The measure of all the exposures of an
individual in a lifetime and how those exposures relate to
health*
 *The National Institute for Occupational Safety and Health (NIOSH), Centers for Disease Control and Prevention (CDC).
 https://www.cdc.gov/niosh/topics/exposome/default.html#:~:text=The%20exposome%20can%20be%20defined,from%20environmental%20and%20occupational%20sources.. Accessed 4/20/2021

ENVIRONMENTAL                                    SOCIOCULTURAL                                           BEHAVIORAL                                           BIOLOGICAL

                                                                         LIFE COURSE

                    **Hill, Perez-Stable, Anderson and Bernard, Ethnicity and Disease, 2015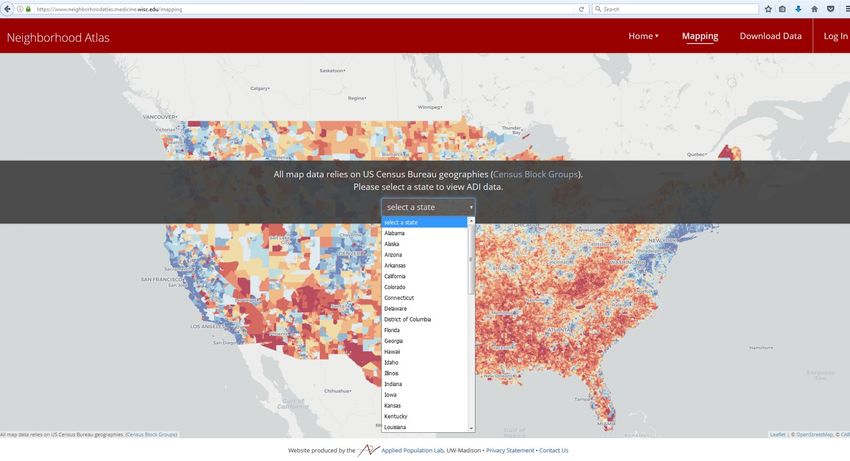
SOCIAL DETERMINANTS OF HEALTH

                 Conditions in the environments in which people are born, live, work, play,
                 worship, and age that impact a wide array of health, functioning, quality-of-
                 life outcomes and risks*
                            *Office of Disease Prevention and Health Promotion. Healthy People 2020: Social Determinants of Health. https://www.healthypeople.gov/2020/topics-objectives/topic/social-determinants-of-health. Accessed
                            10/5/2018

Source: www.Pixabay.com-- All images are released free of copyrights under Creative Commons CC0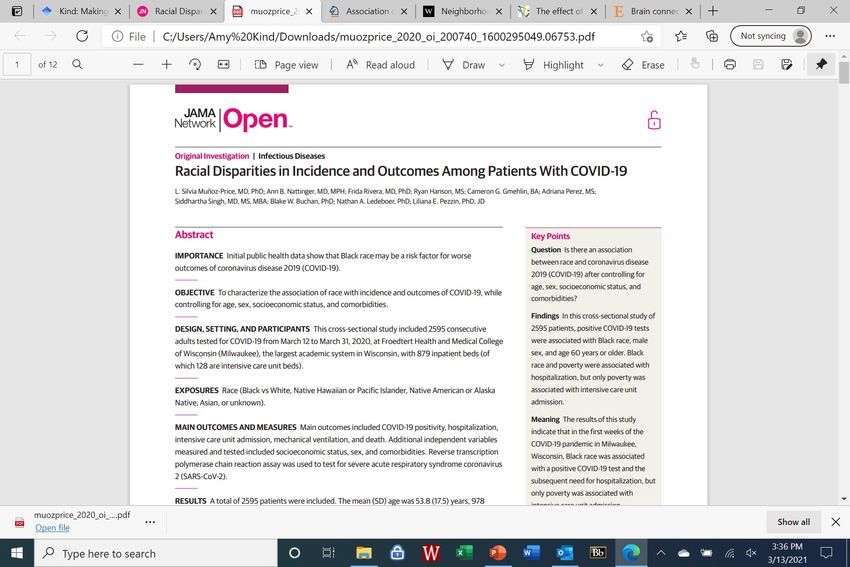
INDIVIDUAL LEVEL
SOCIAL DETERMINANTS OF HEALTH

           $
CONTEXTUAL LEVEL SOCIAL DETERMINANTS OF HEALTH
IMPORTANCE OF NEIGHBORHOOD

         $
MOVING TO OPPORTUNITY STUDY
Individual
Socioeconomics NO CHANGE
Health
IMPROVED
*Ludwig et al, New England Journal of Medicine, 2011; Ludwig et al, Science; Many othersSTRUCTURAL INEQUITIES *The HOLC maps are part of the records of the FHLBB (RG195) at the National Archives II Archived 2016-10-11 at the Wayback Machine.
METRICS OF
                           NEIGHBORHOOD DISADVANTAGE

    • Quantifiable
       • Uses measures of social determinants of health in a
         discrete geographic area (typically 500-1500 persons)
    • Robust
       • Metrics available in many countries
       • Privacy-compliant
    • Actionable in the ‘Real World’
        • Actionable at community, research and policy levels
        • Guide outreach through mapping
        • Can be used for: resource targeting, program eligibility,
          and statistical adjustment
                                                                      The Jarman Index
* Jarman et al, BMJ 1983
AREA DEPRIVATION INDEX (ADI)
• Originally created by Health Resources and Services
Administration in 1990s and employed at the county level
• Education, employment, housing-quality and poverty
• Required updates for modern use and geo-alignment with
European policy indices
• UW team updated to more recent and relevant data
sources and refined down to census block-group level (i.e.
“neighborhood” ~ 1,500 persons) to more precisely
measure exposure. NIH funding to validate across US
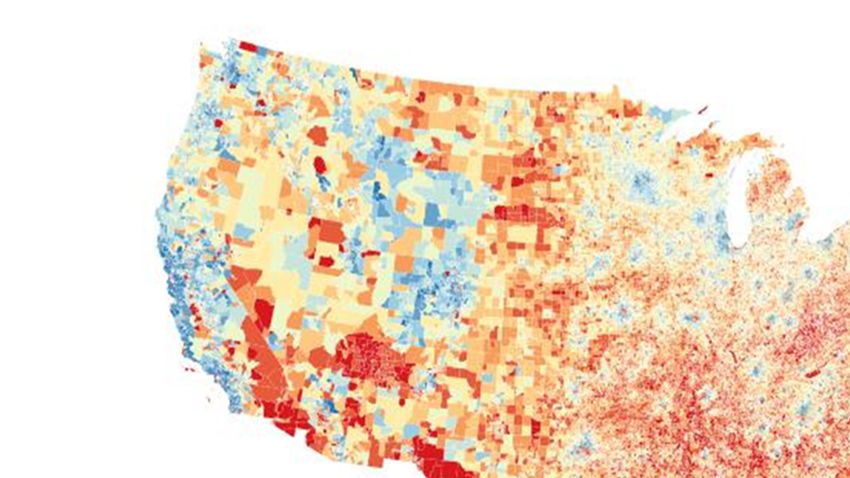
Milwaukee CountyCHARACTERISTICS OF HIGHLY DISADVANTAGED
NEIGHBORHOODS IN US
• More often in urban core
and rural areas
*Kind et al, Annals of Internal Medicine, 2014; Kind and Buckingham, New England Journal of Medicine, 2018RACE AND
NEIGHBORHOOD DISADVANTAGE
• Older adults residing in US neighborhoods identify as*:
100
White Race
90
80
70
White Race
Percent
60
50
40 Black Race
30
20
Black Race Other Race
10
Other Race
0
Least Disadvantaged Most Disadvantaged
Neighborhoods Neighborhoods
White Race Black Race Other Race
*Kind et al, Annals of Internal Medicine, 2014NEIGHBORHOOD DISADVANTAGE
AND BRAIN HEALTH
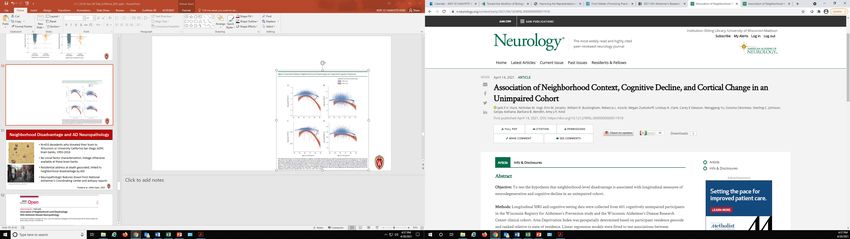
Powell et al, JAMA Open 2020NEIGHBORHOOD DISADVANTAGE
AND BRAIN STRUCTURE
• N=951 cognitively unimpaired research participants
• Residential address geocoded, linked to neighborhood
disadvantage by ADI
• MRI measures of hippocampal and total brain tissue
volume
Hunt et al, JAMA-Neurology, 2020Hunt et al, JAMA-Neurology, 2020
In this 10 year longitudinal study of
 cognitively unimpaired adults, living in
 the most highly disadvantaged
 neighborhoods was associated with
 accelerated degeneration (cortical
 thinning) in AD affected regions and
 more cognitive decline

Hunt et al, Neurology, 2021
NEIGHBORHOOD DISADVANTAGE
                                                   AND AD NEUROPATHOLOGY

                                                            • N=453 decedents who donated their brain to Wisconsin or
                                                              University California San Diego ADRC brain banks, 1993-2016
                                                            • No social factor characterization available
                                                            • Residential address at death geocoded, linked to
                                                              neighborhood disadvantage by ADI
                                                            • Neuropathologic features drawn from National Alzheimer's
                                                              Coordinating Center and autopsy reports

Source: www.Pixabay.com-- All images are released free of
copyrights under Creative Commons CC0

                                                                                                 Powell et al, JAMA-Open, 2020
Living in the most disadvantaged neighborhood decile was associated increased odds of AD neuropathology June 11, 2020
LIFE COURSE EXPOSOME
                               IN BRAIN BANK DECEDENTS

  Residential History: Geospatial targeting of
  exposure data across the life-course

       • Public-data based construction (archival,
         genealogical and historical methods)

       • 73% of all person years discoverable in
         pilot study (n=213)

                             LIFE COURSE

© Preliminary data, Kind et al, 2020
RESIDING IN A HIGHLY DISADVANTAGED NEIGHBORHOOD
IS LINKED TO:
• Epigenetic age acceleration as measured by methylation-based
markers of aging (Lawrence et al, JAMA-Open, 2020)
• Higher risk of post-operative delirium (Arias et al, JAGS, 2020)
• Cognitive function (Lang et al, JAGS 2008; Al Hazzouri et al, Am J Epi, 2011;
Wight et al, Am J Epi, 2006; Zuelsdorff et al, Alz Dementia 2020) and decline
(Sheffield et al, Am J Epi, 2009; Hunt et al, Neurology, 2021)
• Later dementia diagnosis and less comprehensive diagnostic
evaluation (Tsoy et al, JAMA-Neurology, 2021)
• Greater challenges navigating dementia care and supports
(Gilmore-Bykovskyi et al, “A Better Way” Opportunities to strengthen supports for
people with dementia in the greater Detroit area, 2020*; others)
• Many other factors
*https://supportstudy.nursing.wisc.edu/wp-content/uploads/sites/906/2020/12/Detroit-Report-2020.pdfPathways to Brain Health
Cholesterol Control
Best Cholesterol
Worst Cholesterol
Least Disadvantaged Most Disadvantaged
*Durfey et al, HSR, 2019NEIGHBORHOOD DISADVANTAGE
AND RESEARCH INCLUSION
• Persons residing in the most disadvantaged
neighborhoods are often poorly represented in 20%
research 18%
16%
14%
• Neighborhood disadvantage should be collected as 12%
a standard demographic characteristic in all 10%
research protocols 8%
6%
4%
• Research on best practices for recruitment and 2%
retention of individuals residing in disadvantaged 0%
1 2 3 4 5 6 7 8 9 10
neighborhoods is needed Least
Neighborhood Disadvantage
Most
*Grill et al, JPAD 2021; Powell et al, JAMA-Open, 2020; Berman et al, JAMA-Cardiology, 2021; othersNEIGHBORHOOD DISADVANTAGE
AND RECRUITMENT SCIENCE
All ADI groups were observed to have similar
willingness to participate in research studies
*Grill et al, JPAD 2021OPEN SCIENCE IS KEY TO ACTION Open Science is the movement to make scientific research and its dissemination accessible to all levels of an inquiring society, amateur or professional. *Woelfle et al, Nature Chemistry 2011; Boulware et al, 2020; Kind et al, 2018
THE NEIGHBORHOOD ATLAS
                  www.neighborhoodatlas.medicine.wisc.edu

                      • Data democratization and open science tool for the ADI

                      • Customized mapping; Free, open to all

                      • Over one-quarter of a million views

                      • Data downloaded tens of thousands of times by
                        research, governmental, community, and industry
                        groups.

*Kind NEJM 2018
THE NEIGHBORHOOD ATLAS
www.neighborhoodatlas.medicine.wisc.edu
*Kind NEJM 2018https://www.neighborhoodatlas.medicine.wisc.edu/
THE NEIGHBORHOOD ATLAS
                    www.neighborhoodatlas.medicine.wisc.edu

      REAL WORLD ACTION
      • Maryland Health Services and Cost Review Commission
      • Multiple US Health Systems: Resource and Service Allocation
      • COVID Treatment and Vaccine Allocations
      • Many Others

                           https://www.health.pa.gov/topics/disease/coronavirus/Pages/Guidance/Ethical-Allocation-Framework.aspx
*Kind NEJM 2018
THE NEIGHBORHOODS STUDY
(R01AG070883; PI KIND, MPI BENDLIN)
• Novel collaborative multi-site initiative to examine the impact, mediators and moderators
of life-course exposome on AD-specific pathologic features, vascular burden and cognitive
decline
• Over 9,000 ADRC brain bank decedents
• 7,875 ADRC clinical core participants
• 22 Alzheimer’s Disease Research Centers
• Funded by the National Institute on AgingCONCLUSIONS • Whenever possible research search should be aligned towards action and real-world intervention • Social determinants of health, including neighborhood disadvantage, drive many health disparities and often reflect a society’s legacy of structural inequity • Neighborhood disadvantage should be collected as a standard demographic characteristic in all research protocols • Open science, data democratization should be embraced as a step towards real world change
THE NEIGHBORHOOD ATLAS
                  www.neighborhoodatlas.medicine.wisc.edu

                         Neighborhood Atlas
                         is free and open
                         to all!

                         Many ADI-like
                         metrics exist for
                         other countries
*Kind NEJM 2018
ACKNOWLEDGEMENTS
Barbara B. Bendlin, PhD ADRC participants
Funding
Robert Rissman, PhD Neighborhoods Study Collaborators
Andrea Gilmore-Bykovskyi, PhD, RN The entire UW CHDR team, staff, NIA R01 AG070883 (Kind PI; Bendlin MPI)
William Buckingham, PhD students NIA RF1AG057784 (Kind PI; Bendlin MPI)
Ryan Powell, PhD, MA NIA Leadership, Program Officers NIMHD R01MD010243-01 (Kind PI)
Jack Hunt, PhD and Staff NIA P50AG033514-06 (Asthana PI)
Mengang Yu, PhD And many, many others…. NIA P50AG062429 (Brewer PI)
M. Shahriar Salamat, MD, PhD The C2C Registry is supported by
Sanjay Asthana, MD NIA AG066519 and NCATS TR001414
Sterling Johnson, PhD
Josh Grill, PhD
Dan Gillen, PhD
Rachel Whitmer, PhD
Center for Health Disparities
ResearchYou can also read