Authoring Combined Textual and Visual Descriptions of Graph Data
←
→
Page content transcription
If your browser does not render page correctly, please read the page content below
EUROVIS 2019/ J. Johansson, F. Sadlo, and G. E. Marai                                                                                                Short Paper

                    Authoring Combined Textual and Visual Descriptions
                                     of Graph Data

                                                                Shahid Latif   , Kaidie Su, and Fabian Beck

                                                                      University of Duisburg-Essen, Germany
                                                                paluno—The Ruhr Institute for Software Technology

         Abstract
         The interactive linking of text and visualizations supports easy and guided exploration of information and results in a coherent
         document. Authoring such documents for the web requires writing custom HTML and JavaScript. Existing research aims at
         reducing the effort by providing a declarative syntax. However, these approaches either do not support the interactive linking
         of text and visualizations or require advance programming skills to establish this linking. Targeting a specific type of data i.e.,
         graph data, we introduce an approach that uses a declarative syntax to produce interactive documents and requires little to no
         programming. Based on the user specifications in an HTML file, the system queries the database to retrieve subgraphs and link
         them to the relevant text fragments. The resulting document consists of a node-link diagram and text; the two representations
         are closely linked via interactions and word-sized graphics, and provide an active reading experience.
         CCS Concepts
         • Human-centered computing → Visualization application domains; Information visualization;

1. Introduction                                                                            such visualization–text interactions, the use of word-sized graphics
                                                                                           (sparklines) [Tuf06] helps in achieving a more coherent document.
Bret Victor’s [Vic11] essay Explorable Explainables suggests fa-                              We present an approach that facilitates the process of author-
cilitating an active reading process that allows readers to interac-                       ing Web-based interactive documents. The approach aims at de-
tively explore the content. However, creating interactive documents                        scribing and visualizing multiplex graphs—graphs having several
is often tedious and requires writing HTML and JavaScript. Many                            types of edges. The data is visualized as a node-link diagram with a
researchers [VZK16] [CH18] [LLB18] have explored ways to sim-                              force-directed layout. We use a declarative syntax that only requires
plify this process by using a declarative syntax or a markup lan-                          specifications in an HTML file. Our system uses a graph database
guage. However, existing systems that allow for easy and fast cre-                         as an underlying data source, parses the user-specified parameters,
ation of interactive visualizations do not provide support for estab-                      queries the database, creates components of the document, and es-
lishing interactive linking between text and visualizations. Other                         tablishes a linking between the textual and visual representations.
systems often require initial training and advance programming                             The resulting Web document offers an interaction-enriched reading
skills to produce non-trivial visualizations and interactively link                        experience; Figure 1 shows an example.
those to text. In this paper, we present a focused approach—aiming
solely at graph data—for authoring web-based interactive docu-
ments. The approach uses a simple declarative syntax and does not                          2. Related Work
require any programming.                                                                   Creating interactive articles involves designing interactive vi-
                                                                                           sualizations, producing reactive elements, and establishing
    Graph data consists of entities and relationships between them.                        visualization–text linking. High-level JavaScript libraries such as
It is often difficult to find important information in a graph visual-                     React and Polymer allow users to quickly create reactive com-
ization having many entities and multiple types of relationships.                          ponents and a user-interface. Tangle is a JavaScript library that
These visualizations benefit from a closely coupled textual de-                            helps in building interactive documents. However, these libraries
scription that can provide contextual information. Interactive link-                       do not include support for creating visualizations. D3 [BOH11] is
ing of the relevant parts of the visualization with the text helps                         a JavaScript library for developing highly customizable visualiza-
in better cross-referencing the two representations. This linking                          tions. Although these libraries reduce the effort, users still need to
also allows authors of the document to highlight important points                          write JavaScript and go through complex application code. Com-
and helps in bringing readers’ attention to those points. Besides                          putational environments such as Jupyter Notebook, R MarkDown,

 c 2019 The Author(s)
Eurographics Proceedings c 2019 The Eurographics Association.
Shahid Latif, Kaidie Su, & Fabian Beck / Authoring Combined Textual and Visual Descriptions of Graph Data
and Observable are systems that aim at creating and sharing com-
putations or graphics in a reproducible way. It is possible to create
interactive content using these systems, but they focus on interac-
tive coding experience and target technical users.
Existing research aims at providing ways to author inter-
active documents with ease and using minimal programming.
Mavo [VZK16] introduces a syntax that is an abstraction of HTML
and allows users to bind data to templated HTML. The use of a
declarative syntax such as Markdown has made it even easier to
write for the web. Visdown [Kap16] uses Markdown and Vega-
Lite [SMWH17], a JSON syntax, to specify visualizations. How-
ever, these systems do not provide a mechanism of linking text and
visualizations. Idyll [CH18] introduces a markup language com-
bined with reactive programming in JavaScript for publishing in-
teractive articles on the web. The focus of Idyll is broad and it
allows building custom visualizations using D3 or Vega-Lite and
binding them to the text. This generalizability comes at the cost of
programming custom visualizations. In contrast, we only focus on
interactive articles describing graph data which offers an easy-to-
use syntax that does not require programming knowledge.
The possible ways and interactions for close integration of
text and graphics (especially in the context of word-sized graph-
ics) are discussed by Goffin et al. [GBWI17] and Beck and
Weiskopf [BW17]. Latif et al. [LLB18] describe an approach for
implementing some of those interactions using a simple syntax that
only requires modifying the HTML. However, their approach is
limited to simple visualizations, i.e., bar and line charts. We use
Figure 1: Interactive document describing the biography of a fic-
their syntax as a basis, and extend it to produce documents for
tional character Jon Snow from the TV series Game of Thrones.
graph data having a comparatively complex visualization and two-
way interactions between text and graphics as suggested in Beck
and Weiskopf’s work [Section 5.3] [BW17].
the jQuery plugin jQuery Sparklines. These small graphics reveal
the degree of a node in the dataset with different types of relation-
3. Interactive Documents for Graph Data ships. For instance, the word-sized bar chart following the
Using our approach, authoring interactive documents only requires character name Jon Snow in the first paragraph of Figure 1 shows
editing an HTML file using a declarative syntax. Figure 1 shows that the character is linked to other characters with six types of re-
the components of the generated interactive document, namely lationships in different frequencies (number of edges per type).
static text, interactive text (boldface and clickable), word-sized bar
charts, and a node-link diagram. 3.2. Establishing Visualization–Text Linking
The linking between text and various parts of the visualization is
3.1. Data and Visualizations defined as span tags in the HTML file. The user-defined parameters
are specified using the custom data attribute option of HTML. The
We use a graph database, Neo4j, which models the data as entities
syntax of these tags is as follows:
(nodes) and relationships (edges). The nodes and edges can have
properties defined by key–value pairs. Neo4j uses the Cypher query
Game of Thrones as our running example throughout this section. text
The dataset consists of 84 characters and seven different types of
216 relationships among the characters.
All the span tags with class linkedText are parsed for the user-
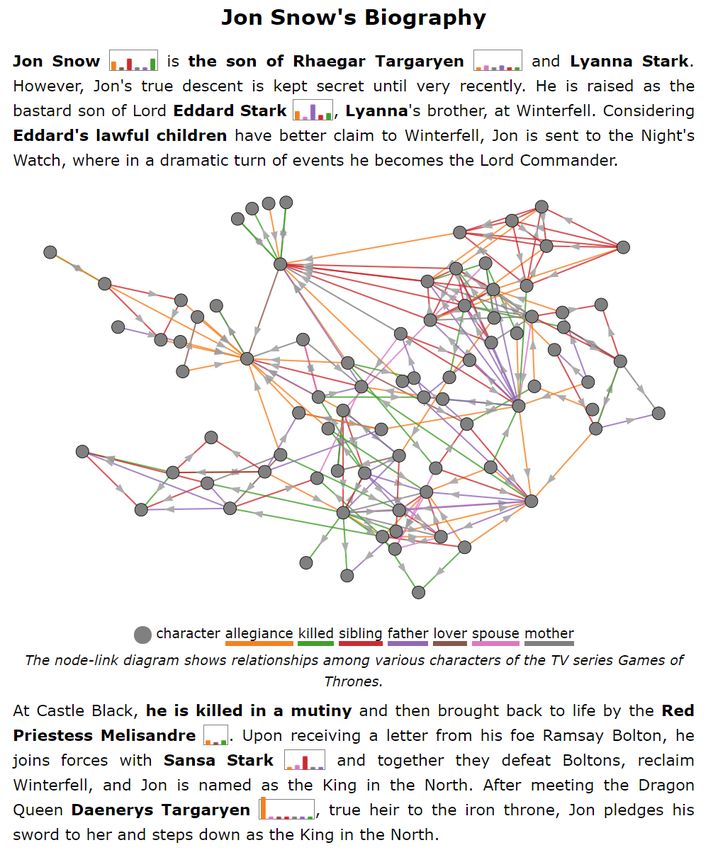
To visualize the data, we have used the open source JavaScript defined parameters. The text is produced as a clickable text and
charting library D3. The graph data is visualized as a node-link di- highlights the corresponding part of the visualization when clicked.
agram with a force directed layout; Figure 1 shows an example vi- The parameter values defined by the attributes are parsed and trans-
sualization. The different types of relationships are encoded using formed into a Cypher query to retrieve the specified subgraph. Ta-
distinguishable colors. Word-sized bar charts are produced using ble 1 shows examples of various possible combinations of param-
c 2019 The Author(s)
Eurographics Proceedings c 2019 The Eurographics Association.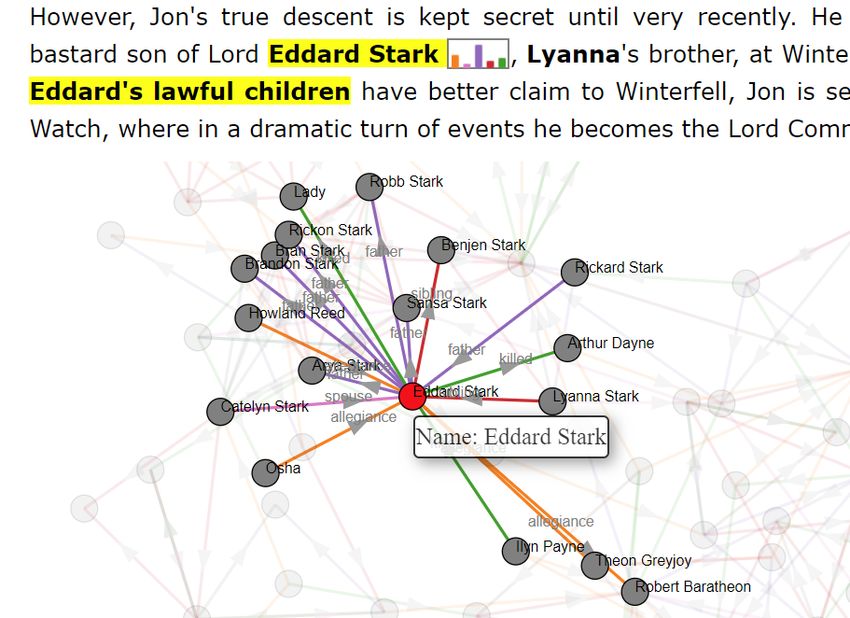
Shahid Latif, Kaidie Su, & Fabian Beck / Authoring Combined Textual and Visual Descriptions of Graph Data
Table 1: Custom parameters for querying the data. The check mark
( ) shows the presence of a string value and dash (–) means no                                                  1
                                                                                                    Hovering a bar:
value specified. The direction of the edge (edgeDirection) can be                                   Shows a tooltip

incoming (in), outgoing (out), or bidirectional (both). All other pa-
                                                                                                                                                 2 Mouse hover:
rameters accept string values. S and T are exemplary labels for                                                                                    Highlights the subgraph linked to
                                                                                                                                                   the word-sized bar chart
                                                                                                            Mouse hover or click:
source and target nodes.                                                                           Highlights the subgraph linked
                                                                                                                       to the text
 Query edgeSource edgeType     edgeTarget edgeDirection   Description                                                                                                                    1
                                                                                                                                                                                  Zooming, Panning
 1                                         in, out,   or highlighting a specific                          Text                       2                                            Hovering a node:
                                           both          relationship between S and T                                                                                             Highlight associated
                                                                                                                                                                                  subgraph and shows
 2                             –           in, out,   or highlighting all the entities linked                                                                                     labels
                                           both          to S with a specific relationship                                               Mouse hover on a node:
                                                                                                                                         Highlight the text associated with the
 3                 –                       in, out,   or highlighting all the relationships                                              node
                                           both          between S and T
 4                 –           –           in, out,   or highlighting all the entities linked
                                           both          to S with any possible                 Figure 2: Interaction patterns between text, word-sized graphics,
                                                         relationship                           and the node-link diagram. (1) interactions influence only one com-
 5     –           –           –           both          highlighting the whole graph
                                                                                                ponent and (2) interactions connects two different components of
                                                                                                the document.
eter values that can be used to filter the data for linking it to the
text. It is not mandatory to specify the values of all the parame-
                                                                                                the work of Beck and Weiskopf [BW17, Section 5]. Figure 2 ex-
ters; if not specified, the system uses default values. For example,
                                                                                                plains the linking of text, word-sized bar charts, and the node-link
the span tag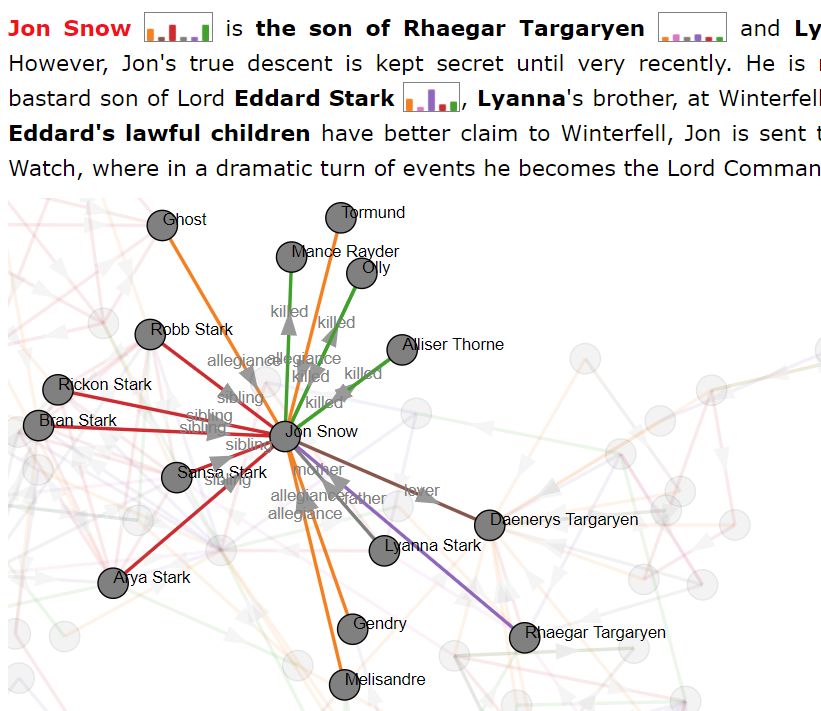
Shahid Latif, Kaidie Su, & Fabian Beck / Authoring Combined Textual and Visual Descriptions of Graph Data

 A                                              B                                            C
Figure 3: Supported interactions: (A) hovering over an interactive text, (B) effect of clicking on the interactive text “Eddard Stark”, hovering
over a word-sized bar chart, and (C) hovering over a node in the node-link diagram.

tion using various query types from Table 1. In addition, the partic-
ipant produced eight word-sized bar charts. After the participant
was done, we asked questions about the ease-of-use and possi-
ble problems of the system. To the first, he responded, “This tool
is quite simple to use, and people do not need the knowledge of
SQL. The system is also understandable, and as a non-expert pro-
grammer, I [could] quickly get used to it”. The participant com-
plained about filling in all the parameters in every span tag. It was
still compulsory to define all the parameters in the version used
by the participant. Based on the feedback, we have considerably
simplified the syntax and made the user-defined parameters op-
tional using default values. For instance, the query 4 (Table 1) can
be specified by using only one parameter text.

4. Discussion
Our system allows for producing documents that describe graph
data with only one type of visualization, i.e., a node-link diagram.
Although our syntax scales to graphs having any number of nodes
and edges, the visual clutter in the visualization is a bottleneck.
However, it would be straight forward to replace the node-link di-
agram with another graph visualization. Our approach can also be
extended to documents containing more than one visualization (of
the same or different type) by including a unique identifier in the
 tags for the different figures. Moreover, the document lay-
out to accommodate multiple visualizations in the interactive set-
ting still remains an open question (e.g., relevant visualizations
and text might get scrolled out). The support of more interactions
such as brushing and linking between text and visualizations (drag-          Figure 4: An interactive article authored by the participant during
selecting a portion of visualization and highlight affiliated text)          a preliminary feedback session. Using our system, only the HTML
might be another useful extension.                                           file was edited, and a variety of queries from Table 1 were used.

5. Conclusion
We have presented an approach for producing interactive docu-
ments for graph data. It uses a simple syntax to establish the linking       Acknowledgments
between text and various parts of the node-link diagram and do not
require programming knowledge. The two-way visualization–text                Fabian Beck is indebted to the Baden-Württemberg Stiftung for the
interactions not only provide an active reading experience but also          financial support of this research project within the Postdoctoral
support more explorative reading strategies.                                 Fellowship for Leading Early Career Researchers.

                                                                                                                                            c 2019 The Author(s)
                                                                                                     Eurographics Proceedings c 2019 The Eurographics Association.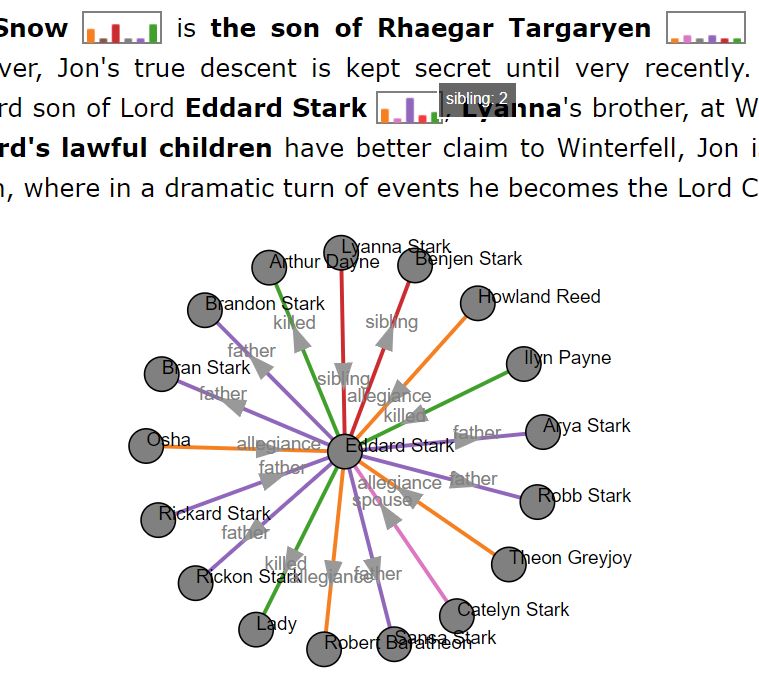
Shahid Latif, Kaidie Su, & Fabian Beck / Authoring Combined Textual and Visual Descriptions of Graph Data

References
[BOH11] B OSTOCK M., O GIEVETSKY V., H EER J.: D3 data-driven
  documents. IEEE Transactions on Visualization and Computer Graphics
  17, 12 (Dec 2011), 2301–2309. doi:10.1109/TVCG.2011.185. 1
[BW17] B ECK F., W EISKOPF D.: Word-sized graphics for scientific
  texts. IEEE Transactions on Visualization and Computer Graphics 23, 6
  (2017), 1576–1587. doi:10.1109/TVCG.2017.2674958. 2, 3
[CH18] C ONLEN M., H EER J.: Idyll: A markup language for authoring
  and publishing interactive articles on the web. In Proceedings of the 31st
  Annual ACM Symposium on User Interface Software and Technology
  (2018), UIST ’18, ACM, pp. 977–989. doi:10.1145/3242587.3242600. 1,
  2
[GBWI17] G OFFIN P., B OY J., W ILLETT W., I SENBERG P.: An ex-
  ploratory study of word-scale graphics in data-rich text documents. IEEE
  Transactions on Visualization and Computer Graphics 23, 10 (2017),
  2275–2287. doi:10.1109/TVCG.2016.2618797. 2
[Kap16] K APOOR A.: Visdown.               https://visdown.com/,   2016. Accessed:
  2019-01-13. 2
[LLB18] L ATIF S., L IU D., B ECK F.: Exploring interactive linking be-
  tween text and visualization. In EuroVis 2018 - Short Papers (2018), The
  Eurographics Association. doi:10.2312/eurovisshort.20181084. 1, 2
[SMWH17] S ATYANARAYAN A., M ORITZ D., W ONGSUPHASAWAT
  K., H EER J.: Vega-lite: A grammar of interactive graphics. IEEE Trans-
  actions on Visualization and Computer Graphics (Proc. InfoVis) (2017).
  2
[Tuf06]     T UFTE E. R.: Beautiful Evidence, 1st ed. Graphics Press, 2006.
   1
[Vic11]     V ICTOR B.: Explorable explanations. http://worrydream.com/
   ExplorableExplanations/,2011. Accessed: 2019-02-12. 1
[VZK16] V EROU L., Z HANG A. X., K ARGER D. R.: Mavo: Creating in-
  teractive data-driven web applications by authoring html. In Proceedings
  of the 29th Annual Symposium on User Interface Software and Technol-
  ogy (2016), UIST ’16, ACM, pp. 483–496. doi:10.1145/2984511.2984551.
  1, 2

 c 2019 The Author(s)
Eurographics Proceedings c 2019 The Eurographics Association.
You can also read