Overview of Poverty Statistics for the United States

Page created by Harold Goodwin
 
CONTINUE READING
Overview of Poverty Statistics for the United States
Overview of Poverty Statistics for
                                 the United States
                                                                                Trudi Renwick
                                                            Assistant Division Chief for Economic Characteristics
                                                              Social, Economic and Housing Statistics Division
                                                                             U.S. Census Bureau
                                                                              DRB-FY19-ROSS-B0129

                                                                                      May 24, 2019

This presentation has undergone a more limited review than official Census Bureau reports. All views and any errors are solely those of the author and do not necessarily
reflect any official position of the Bureau. All comparative statements in this presentation have undergone statistical testing, and, unless otherwise noted, all comparisons are statistically
significant at the 10 percent significance level. Do not cite or distribute without author permission.

The Census Bureau reviewed this data product for unauthorized disclosure of confidential information and has approved the disclosure avoidance practices applied to this release.
DRB-FY19-ROSS-B0129.
Overview of Poverty Statistics for the United States
• Data are based on the
  Current Population Survey’s
  Annual Social and Economic
  Supplement (CPS ASEC).

• CPS ASEC is the official
  source of national poverty
  estimates.

• Official poverty estimates
  are calculated in accordance
  with OMB Statistical Policy
  Directive 14.

                                 2
Overview of Poverty Statistics for the United States
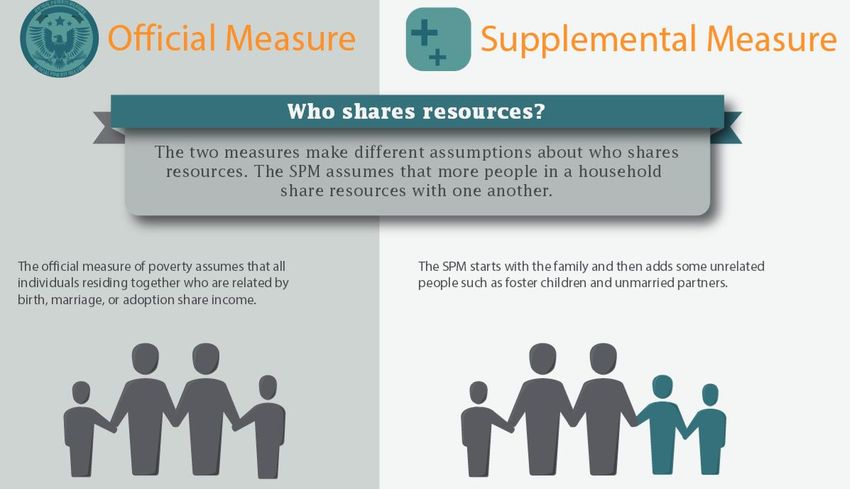
Poverty Rate and Number in Poverty: 1959 to 2017
      Percent                                                Recession
25
20
                              Poverty rate                       12.3%
15    22.4%                                                                                 The official poverty rate in 2017
10                                                                                          was 12.3 percent, down 0.4
5                                                                                           percentage points from 2016. In
0                                                                                           2017, there were 39.7 million
50
      Numbers in millions                                                                   people in poverty, not
45                                                                                          statistically different from the
40
      39.5 million          Number in Poverty
                                                                 39.7                       number in poverty in 2016.
35
30
                                                                 million
25
20
     1959       1970         1980     1990      2000         2010       2017

                                                       Note: The data for 2013 and beyond reflect the implementation of the redesigned income questions.
                                                       Source: U.S. Census Bureau, Current Population Survey, 1960 to 2018 Annual Social and Economic
                                                       Supplements.
                                                                                                                                                           3
Overview of Poverty Statistics for the United States
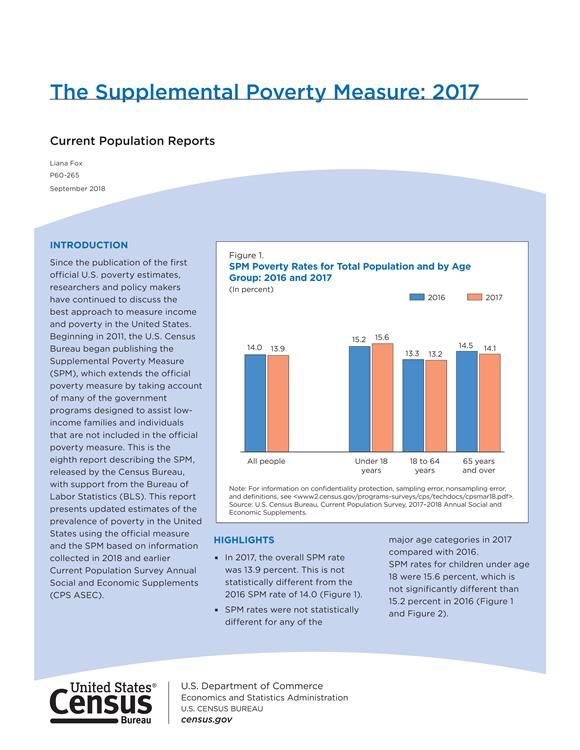
Poverty Rates by Race and Hispanic
                               Origin: 1959 to 2017
       Percent                                                                                                                           Recession
70

60
         55.1%
50

40
                                   Black
30

                        22.8%                                                                                                                        21.2%
20
                                Hispanic (any race)                   Asian                                                                          18.3%
                                                     16.1%
10                                                                                                                                                   10.0%
                           7.5%                                                                                                                      8.7%
                                                                    Non-Hispanic White
 0
     1959        1965    1970     1975     1980         1985          1990          1995          2000          2005          2010              2017
                                            Note: The data for 2013 and beyond reflect the implementation of the redesigned income questions.
                                            Source: U.S. Census Bureau, Current Population Survey, 1960 to 2018 Annual Social and Economic
                                            Supplements.
                                                                                                                                                       4
Overview of Poverty Statistics for the United States
Poverty Rates by Age: 1959 to 2017
      Percent                                                                                                                           Recession
50

45

40

35
        35.2%

30
        27.3%          Aged 65 and older
25                                                Under age 18
20
        17.0%                                                                                                                                       17.5%
15
                                                                                                                                                    11.2%
10
                                                                                                                                                     9.2%
 5                             Aged 18 to 64
 0
     1959       1965    1970    1975       1980        1985          1990          1995           2000          2005          2010               2017
                                             Note: The data for 2013 and beyond reflect the implementation of the redesigned income questions.
                                             Data for people aged 18 to 64 and 65 and older are not available from 1960 to 1965.
                                             Source: U.S. Census Bureau, Current Population Survey, 1960 to 2018 Annual Social and Economic
                                             Supplements.                                                                                               5
Overview of Poverty Statistics for the United States
People with Income Below 50 Percent of Their Poverty
                Threshold: 1975 to 2017
      Percent                                                                                                                Recession
25

20

                                           Poverty Rate
15
      12.3%                                                                                                                                 12.3%
10
                                       Income Below 50%
                                        Poverty Threshold
                                                                                                                                            5.7%
5      3.7%

0
     1975       1980   1985   1990               1995               2000               2005                2010                          2017

                                     Note: The data for 2013 and beyond reflect the implementation of the redesigned income questions.
                                     Source: U.S. Census Bureau, Current Population Survey, 1960 to 2018 Annual Social and Economic
                                     Supplements.                                                                                               6
Overview of Poverty Statistics for the United States
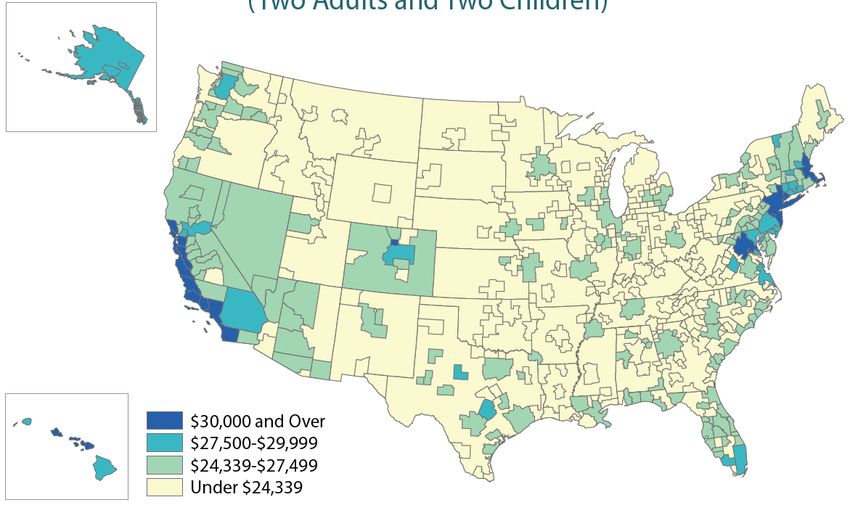
Individuals with Income Below 50% of the Poverty Threshold
    as a Share of Total Poverty Population: 1975 to 2017
        Percent                                                                                                              Recession
  60

  50
                                                                                                                                          46.7%

  40

        30.1%                          Proportion of People in
  30
                                               Poverty
                                       With Income Below 50%
  20                                     Poverty Threshold

  10

   0
       1975       1980   1985   1990            1995                2000                2005               2010                        2017

                                   Note: The data for 2013 and beyond reflect the implementation of the redesigned income questions.
                                   Source: U.S. Census Bureau, Current Population Survey, 1960 to 2018 Annual Social and Economic             7
                                   Supplements.
Overview of Poverty Statistics for the United States
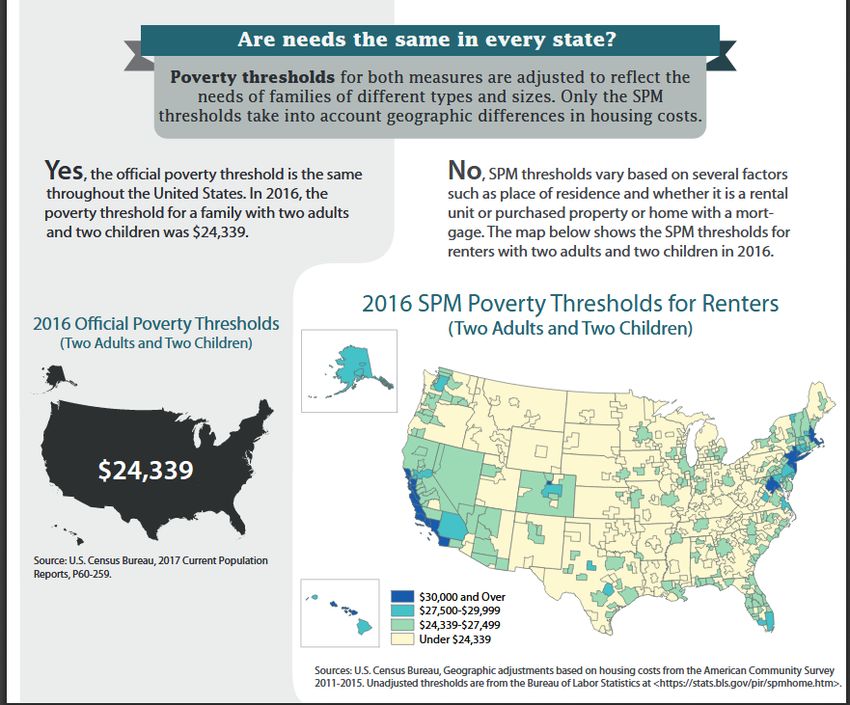
2017 Estimates from the American
Community Survey for States

• Poverty rates over 18 percent
  in Mississippi, New Mexico, Louisiana
  and West Virginia.

• Poverty rates less than 11 percent
  in 13 states.

                                          8
Overview of Poverty Statistics for the United States
• 4th consecutive annual decline in
  national poverty in the ACS

• Poverty down in 20 states and
  District of Columbia

• Poverty up in West Virginia and
  Delaware

                                      9
Overview of Poverty Statistics for the United States
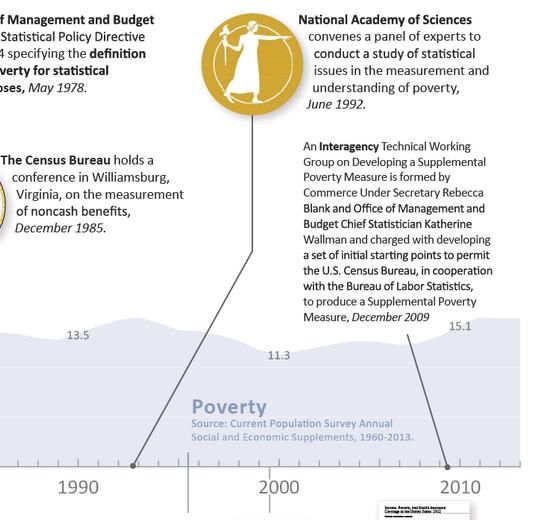
• Poverty declined in 3 of the 5 years
  in 16 states.

• Poverty declined in 4 of the 5 years
  in California, Texas, Michigan, Florida
  Georgia and North Carolina.

• No state saw poverty decline in all
  five years.

                                            10
Between 2012 and 2017:

• Poverty fell in 42 states.

• Poverty increased in Delaware
  and West Virginia.

                                  11
Comparison of SPM Poverty Estimates: 2016 and 2017
   (In Percent)
                                   2016                 2017

                  15.2 15.6
                                                                          •     The Supplemental Poverty Measure
                                               14.5 14.1                        (SPM) rate in 2017 was 13.9 percent.
 14.0 13.9
                              13.3 13.2                                         This is not statistically different from the
                                                                                2016 SPM rate of 14.0 percent.

                                                                          •     The SPM rate for 2017 was 1.6
                                                                                percentage points higher than the
                                                                                official poverty rate of 12.3 percent.

                                                                          •     There were 16 states plus the District of
                                                                                Columbia for which SPM rates were
                                                                                higher than official poverty rates, 18
                                                                                states with lower rates, and 16 states for
                                                                                which the differences were not
 All People       Under 18     18 to 64         65 years                        statistically significant.
                   years        years           and older

                                          Source: U.S. Census Bureau, Current Population Survey, 2017 and 2018 Annual Social and
                                          Economic Supplements.
Official and SPM Thresholds for Units with Two Adults
                      and Two Children
      Supplemental Poverty Measure                                                 Supplemental Poverty Measure Thresholds for Renters, 2016
            Thresholds, 2017
                $27,085              $27,005
$24,858
                          $23,261

Official        Owners    Owners     Renters
poverty          with a  without a
measure         mortgage mortgage

                                               Source: Official Poverty Thresholds, , Supplemental Poverty Measure Thresholds, Bureau of Labor Statistics (BLS),
                                               , Geographic adjustments based on housing costs from the American
                                               Community Survey 2012-2016.
                                                                                                                                                              13
Official and Research SPM Thresholds for Two Adult, Two Child
            Units with Geographic Adjustments: 2017

                              Supplemental Poverty Thresholds
    35,000

    30,000

    25,000

    20,000

    15,000

    10,000

     5,000

         0
                                                        Albany:
                                         New York
                                                      Homeowner    New York
                  Official               Nonmetro:
                                                         with     City: Renter
                                        No Mortgage
                                                       Mortgage
  No Geo Adj      $24,858                 $23,261      $27,085      $27,005
  SPM                                     $20,976      $27,902      $32,943
               https://www2.census.gov/programs-surveys/demo/tables/p60/265/pov-threshold-2017.xlsx
                                                                                            14
15
Change in Number of People in Poverty After Including
               Each Element: 2017
                                       Under 18 years    18 to 64 years         65 years and over
      Numbers in millions
            Social Security    -27.0
   Refundable tax credits                                                -8.3
                      SNAP                                                           -3.4
                         SSI                                                         -3.2
        Housing subsidies                                                             -2.9
   Child support received                                                                    -1.0
              School lunch                                                                   -1.2
 TANF/general assistance                                                                      -0.5
Unemployment insurance                                                                        -0.5
                    LIHEAP                                                                     -0.2
  Workers' compensation                                                                        -0.2
                       WIC                                                                     -0.3
        Child support paid                                                                            0.2
       Federal income tax                                                                               1.5
                       FICA                                                                                    4.7
           Work expenses                                                                                         5.6
        Medical expenses                                                                                                      10.9

                                              Source: U.S. Census Bureau, Current Population Survey, 2018 Annual Social and Economic Supplement.
Change in Number of People in Poverty After Including
               Each Element: 2017
                                      Under 18 years    18 to 64 years         65 years and over
     Numbers in millions
            Social Security   -27.0
   Refundable tax credits                                               -8.3
                     SNAP                                                           -3.4
                        SSI                                                         -3.2
        Housing subsidies                                                            -2.9
   Child support received                                                                   -1.0
              School lunch                                                                  -1.2
 TANF/general assistance                                                                     -0.5
Unemployment insurance                                                                       -0.5
                   LIHEAP                                                                     -0.2
  Workers' compensation                                                                       -0.2
                       WIC                                                                    -0.3
        Child support paid                                                                           0.2
       Federal income tax                                                                              1.5
                      FICA                                                                                    4.7
           Work expenses                                                                                        5.6
        Medical expenses                                                                                                     10.9

                                             Source: U.S. Census Bureau, Current Population Survey, 2018 Annual Social and Economic Supplement.
Change in Number of People in Poverty After Including
               Each Element: 2017
                                       Under 18 years    18 to 64 years         65 years and over
      Numbers in millions
            Social Security    -27.0
   Refundable tax credits                                                -8.3
                      SNAP                                                           -3.4
                         SSI                                                         -3.2
        Housing subsidies                                                             -2.9
   Child support received                                                                    -1.0
              School lunch                                                                   -1.2
 TANF/general assistance                                                                      -0.5
Unemployment insurance                                                                        -0.5
                    LIHEAP                                                                     -0.2
  Workers' compensation                                                                        -0.2
                       WIC                                                                     -0.3
        Child support paid                                                                            0.2
       Federal income tax                                                                               1.5
                       FICA                                                                                    4.7
           Work expenses                                                                                         5.6
        Medical expenses                                                                                                      10.9

                                              Source: U.S. Census Bureau, Current Population Survey, 2018 Annual Social and Economic Supplement.
                                                                                                                                                   8
Change in Number of People in Poverty After Including
               Each Element: 2017
                                       Under 18 years    18 to 64 years         65 years and over
      Numbers in millions
            Social Security    -27.0
   Refundable tax credits                                                -8.3
                      SNAP                                                           -3.4
                         SSI                                                         -3.2
        Housing subsidies                                                             -2.9
   Child support received                                                                    -1.0
              School lunch                                                                   -1.2
 TANF/general assistance                                                                      -0.5
Unemployment insurance                                                                        -0.5
                    LIHEAP                                                                     -0.2
  Workers' compensation                                                                        -0.2
                       WIC                                                                     -0.3
        Child support paid                                                                            0.2
       Federal income tax                                                                               1.5
                       FICA                                                                                    4.7
           Work expenses                                                                                         5.6
        Medical expenses                                                                                                      10.9

                                              Source: U.S. Census Bureau, Current Population Survey, 2018 Annual Social and Economic Supplement.
DATA SOURCES

               21
Current Population Survey (CPS)
 • Produce specific socioeconomic and
   demographic estimates for the United States
   and states for total population and selected
   subpopulations.
 • With the Annual Social Economic Supplement
   (ASEC), provide timely estimates of income
   and health insurance, as well as official poverty
   estimates.
 • Annual sample size is about 100,000
   addresses.
 • Telephone and personal-visit interviews for the
   50 states and the District of Columbia. The
   CPS is a voluntary survey.

                                                       22
• CPS ASEC asks a series of 50 questions about various sources of income,
  including questions about the amount of several noncash benefits such as food
  stamps and employment-related health insurance, during the previous calendar
  year.
• Interviews conducted between February-April, asks about last calendar year
  income.
• Unrelated subfamilies are identified and poverty status is determined as a family
• Rich historical data
   • For characteristics of U.S. population – since 1959
   • For state level – since 1980

                                                                                 23
Decennial Censuses
     • Census 2000 & Prior Censuses
       • Conducted every ten years.
       • Used a mail-out/mail-back questionnaire and only personal-visit follow-up
         using paper questionnaires. Internet options for 2020.
       • “Short” form basic demographic and housing information, such as age,
         sex, race, housing.
       • “Long” form collected the same information for selected sample as the
         short form but also collected more in-depth information such as income,
         education, and language spoken at home.
     • 2010 Census and future – provide only basic short form
       information
     • http://www.census.gov/library/visualizations/time-
       series/demo/census-poverty-tool.html

                                                                                     24
25
26
American Community Survey (ACS)
      • The American Community Survey (ACS), is a nationwide survey that
        collects essentially the same information on people and housing that
        was collected on the short and the long-form questionnaires used in
        Census 2000 and earlier censuses.

      • The ACS is a continuous survey,
         • Each month a sample of about 300,000 housing unit addresses receive a
           questionnaire.
         • Nearly, 3.5 million addresses are surveyed each year.
      • Three modes of data collection methods are used
         • Online (internet)
         • Mail out/mail back
         • Personal visit (CAPI) (for those sampled non responding addresses)

      • Includes resident population of the United States and Puerto Rico
        living in housing units and group quarters

                                                                                   27
ACS (cont’d)
       • Reference period is the 12-month period prior to the interview month.

       • Asks about money income using a series of eight questions during
         the past 12 months

       • ACS estimates are period estimates, describing the average
         characteristics over a specified period

       • 1-year and 5-year estimates released for geographic areas
         that meet specific population thresholds

       • Using the 5-year estimates provides data for all geographic
         areas
       For more information visit http://www.census.gov/acs/www/

                                                                                 28
One-year vs Five-year ACS Data
                                 1-year estimates                                      5-year estimates

12 months of collected data                         60 months of collected data

Data for areas with populations of 65,000+          Data for all areas

Smallest sample size                                Largest sample size

Less reliable than 5-year                           Most reliable

Most current data                                   Least current

                                 Best used when                                        Best used when

Currency is more important than precision           Precision is more important than currency

Analyzing large populations                         Analyzing very small populations

                                                    Examining tracts and other smaller geographies because 1-year estimates are not
                                                    available

                                                                                                                                      29
When to Use ACS- CPS Data
     • In general national level estimates from both surveys are
       consistent and comparable, most of the differences are
       not statistically significant
     • It is recommended to use the CPS estimates at the
       national level
     • State level estimates in general are similar and no
       systematic differences observed,
     • For use at state and lower geographic levels ACS
       estimates are recommended

                                                                   30
Survey of Income and Program Participation (SIPP)
• A longitudinal survey designed to track
  changes (income) over time for the
  same households.
• The SIPP covers a household for 3 or 4
  years.
• Interviewers return to the same
  household and attempt to follow people
  interviewed in the first wave even if they
  move.
• About 65,500 addresses were in the
  initial sample for the SIPP 2008 Panel.
  State estimates only for larger states.
• SIPP 2014 panel – first wave of data
  released last year

                                                    31
32
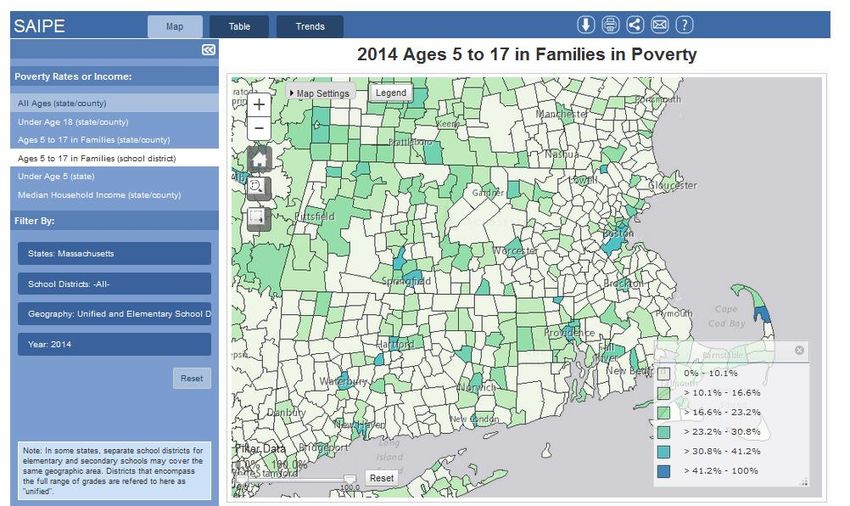
Small Area Income and Poverty Estimates (SAIPE)

                                                  33
How to Find CPS
Data
From the main Census
Bureau page
(www.census.gov)
• Sequentially click on -
  ‘Topics’ , ‘Income & Poverty’
  and ‘Poverty’ or
• Go directly to the poverty
  page using
  (http://www.census.gov/topic
  s/income-
  poverty/poverty.html)
• From the poverty page click
  on ‘Data’ and then Poverty
  Data Tables

                                  34
https://thedataweb.rm.census.gov/ftp/cps_ftp.html#cpsmarch

                                                             35
http://nber.org/cps/

                       36
PUMAS- Public Use MicroData Areas

• Nest within states or equivalent entities
• Contain at least 100,000 people
• Cover the entirety of the United States,
  Puerto Rico, Guam, and the U.S. Virgin
  Islands
• Are built on census tracts and counties
• Should be geographically contiguous

                                                          37
HOW WE DEFINE POVERTY

                        38
How is Poverty Defined?

  Resource        Need

Money Income    Thresholds
               (Orshansky)

                             39
Defining Resources: Income

• Includes earnings, unemployment compensation, workers' compensation, Social Security,
  Supplemental Security Income, public assistance, veterans' payments, survivor benefits,
  pension or retirement income, interest, dividends, rents, royalties, income from estates, trusts,
  educational assistance, alimony, child support, assistance from outside the household, and
  other miscellaneous sources.
• Noncash benefits (such as food stamps and housing subsidies) do not count.
• Before taxes
• Excludes capital gains or losses.
• If a person lives with a family, add up the income of all family members. (Non-relatives, such
  as housemates, do not count.)

                                                                                               40
Measure of Need (Poverty Thresholds)
       • Poverty thresholds are the dollar amounts used to determine poverty
         status.
       • Poverty thresholds were originally derived in 1963-1964, based on
          • U.S. Department of Agriculture food budgets designed for families under
            economic stress.
          • Data about what portion of their income families spent on food to
            estimate total income
          • Equivalence scale calculate total income for different family size and
            compositions
       • Thresholds vary according to family size, number of related children, and
         age of householder
       • The same thresholds are used throughout the United States (do not vary
         geographically).
       • Updated annually for inflation using the Consumer Price Index for All Urban
         Consumers (CPI-U).

                                                                                       41
42
How to Determine Poverty Status
• Compare
   • total income of an individual from all sources with
      appropriate threshold (poverty level) or
   • total family income (total individual income from all
      sources for all family members) with appropriate
      threshold (poverty level) , then
• If total family income is less than the threshold
  appropriate for that family,
   • The family is in poverty.
   • All family members have the same poverty status.
   • For individuals who do not live with family members,
      their own income is compared with the appropriate
      threshold.
                                                             43
How the Census Bureau Determines Poverty (Cont’d)

• For example
  • A total family income for a family of three with one child under 18 years in 2016 was $20,000
  • The appropriate threshold in 2016 for this type of families was $19,318
  • Since the total family income is greater than the threshold, the poverty status for this family of
    three in 2013 was “above poverty level’ (family income of $20,000 is greater than the
    threshold of $19,318)
• Also publish estimates of poverty gaps – resources required to bring a family or
  individual up to the poverty threshold
• Income-to-poverty ratios used to define “extreme” poverty, “near” poverty, etc

                                                                                                         44
First Census Bureau Report on Poverty: 1967

                                              45
46
Criticisms of the Official Poverty Measure

• The official measure does not account for:
 • Provision of in-kind benefits
 • Necessary expenses (taxes, health care, work)
 • Changes in family or household structure
 • Higher standards and levels of living since 1965
 • Geographic price differences among regions

                                                      47
Supplemental Poverty Measure (SPM)

Observations from the Interagency
 Technical Working Group (ITWG) -
 March 2, 2010
  – Will not replace the official poverty measure
  – Will not be used for resource allocation or
    program eligibility
  – Census Bureau and BLS responsible for improving
    and updating the measure
  – Continued research and improvement
  – Based on National Academy of Sciences expert
    panel recommendations in Measuring Poverty: A
    New Approach (Citro and Michael,1995)

                                                      48
                                                           48
49
50
51
52
53
Official and Research SPM Thresholds for Two Adult, Two Child
            Units with Geographic Adjustments: 2017

                              Supplemental Poverty Thresholds
    35,000

    30,000

    25,000

    20,000

    15,000

    10,000

     5,000

         0
                                                        Albany:
                                         New York
                                                      Homeowner    New York
                  Official               Nonmetro:
                                                         with     City: Renter
                                        No Mortgage
                                                       Mortgage
  No Geo Adj      $24,858                 $23,261      $27,085      $27,005
  SPM                                     $20,976      $27,902      $32,943
               https://www2.census.gov/programs-surveys/demo/tables/p60/265/pov-threshold-2017.xlsx

                                                                                               54
55
For more information on the SPM

                                  56
Contact Information

• Trudi Renwick
  – Trudi.j.renwick@census.gov
  – 301-763-5133
  – Census.gov

                                         57
WAS MEDIAN HOUSEHOLD INCOME IN 2017 THE HIGHEST
EVER?

                                                  58
Real Median Household Income: 1967 to 2017
       Income in thousands (2017 dollars)                     Recession
100

 90

 80
                                                                                        Median household income was
 70
                                                                $61,400
                                                                                        $61,400 in 2017, an increase in
 60                                                                                     real terms of 1.8 percent from
       $46,000
 50                                                                                     the 2016 median of $60,300.
 40                                                                                     This is the third consecutive
 30
                                                                                        annual increase in median
                                                                                        household income.
 20

 10

  0
      1967     1975 1980            1990    2000             2010        2017

                                                   Note: The data for 2013 and beyond reflect the implementation of the redesigned income questions. Income
                                                   rounded to nearest $100.
                                                   Source: U.S. Census Bureau, Current Population Survey, 1968 to 2018 Annual Social and Economic Supplements.
                                                                                                                                                                 59
Real Median Household Income: 1967 to 2017
       Income in thousands (2017 dollars)                                                                                                 Recession
100

 90

 80

 70

 60

 50
                                             Traditional                                                                           Redesigned
 40
                                             Median                                                                                Median
 30

 20

 10

  0
      1967               1975         1980     1985         1990            1995            2000            2005           2010      2013         2017

                                                  Note: The data for 2013 and beyond reflect the implementation of the redesigned income questions. Income
                                                  rounded to nearest $100.
                                                  Source: U.S. Census Bureau, Current Population Survey, 1968 to 2018 Annual Social and Economic Supplements.
                                                                                                                                                                60
Redesigned Household Income Comparison: 1999 to 2017
      Income in thousands (2017 dollars)                                                                                                 Recession
 70

                            Adjusted Household
        $62,000             Median                         $61,400                                                        Redesigned                  $61,400
                                                                                                                          Median
 60

                                 Traditional
                                 Median

 50
      1999                                               2007                                               2013                              2017

                                                 Note: The data for 2013 and beyond reflect the implementation of the redesigned income questions. Income
                                                 rounded to nearest $100.
                                                 Source: U.S. Census Bureau, Current Population Survey, 2000 to 2018 Annual Social and Economic Supplements.
                                                                                                                                                               61
2017 American Community Survey

• National median household income from
  the ACS was highest since full
  implementation of the ACS in
  2005. Fifth consecutive increase.

• Median household income up in 24 states
  and District of Columbia; only Alaska and
  Puerto Rico saw declines.

• Median income ranged from about $80,000
  in DC, Maryland and New Jersey to $43,500
  in West Virginia.

                                              62
• Gini index from the 2017 ACS = 0.482.

• Ranged from 0.528 for the District of
  Columbia to 0.423 for Utah.

• Increased (implying greater inequality)
  for Alaska, Delaware, Massachusetts
  and Pennsylvania.

• Decreased for Alabama and California.

                                            63
You can also read