Epidemiology and its Role in Drug Demand Reduction: The South African Community Epidemiology on Drug Use (SACENDU) - ISSUP
←
→
Page content transcription
If your browser does not render page correctly, please read the page content below

Epidemiology and its Role in Drug Demand Reduction:
The South African Community Epidemiology on Drug Use (SACENDU)

                                     Dr Nadine Harker
                          South African Medical Research Council

                                        20 October 2020

          Presentation: Drug Demand Reduction in Africa
             Prevention, Treatment and Epidemiology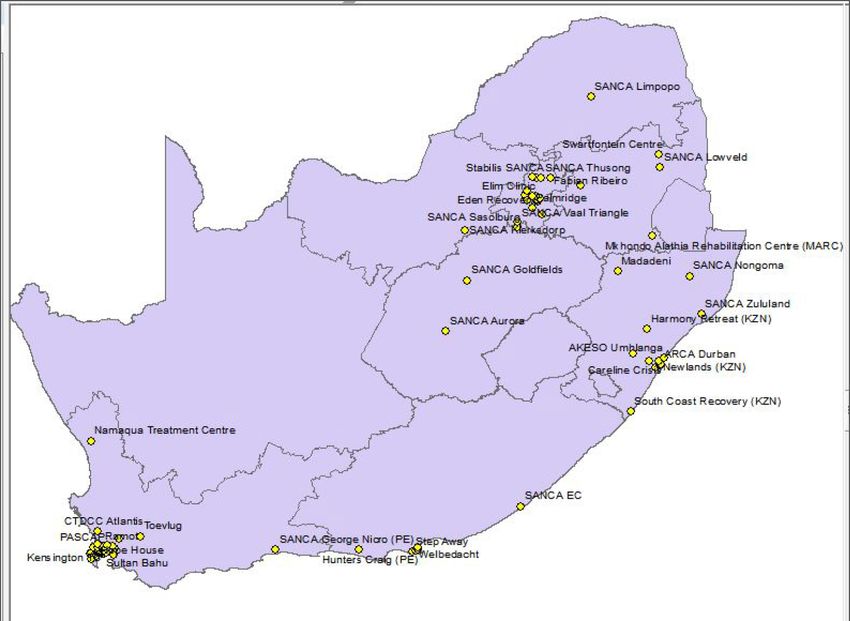
Dr Nadine Harker                       Prof Charles Parry

                      Ms Siphokazi Dada

Ms Jodilee Erasmus                             Mr Warren Lucas
                      Ms Kholiswa Dube
CONTENT
  01         SACENDU: Background & Objectives

   02          SACENDU: Methodology

                   Monitoring AOD use trends in SA (2008b-2019b); Monitoring
        03         PWID/PWUD/OST via data collected from community outreach services;
                   Covid 19 and future work

              04         Implications for policy/practice/research + limitations

                   05           Conclusion
SACENDU: SOUTH AFRICAN COMMUNITY EPIDEMIOLOGY
NETWORK ON DRUG USE
                                   An alcohol and other drug (AOD) sentinel surveillance system operational in 9
                             01    provinces in SA

                                     Monitors trends in AOD use & associated consequences on a six-monthly basis
                              02     from specialist AOD treatment programmes

                                     Initiated in 1996 & modelled after the Drug Surveillance systems established by
                              03     the Pompidou Group in Europe & US Community Epidemiology Work Group

                              Collects:
                        04    • Treatment demand data
                              • Data from community-based harm reduction and health services provided by TB HIV
                                 Care, Anova Health Institute, the Foundation for Professional Development (FPD), OUT
                                 Wellbeing, Tintswalo Home Based Care and the University of Pretoria’s Department of
                                 Family Medicine for people who use drugs (PWUD), including people who inject drugs
                                 (PWID). These services are provided in Cape Town, Durban, Ekurhuleni, Ehlanzeni,
                                 Johannesburg, Sedibeng, Pietermaritzburg, Port Elizabeth and Pretoria.
                              • Hospital admission data DOH KZN (from 2021)

      Funded initially by WHO later by NDoH & more recently DSD
SACENDU OBJECTIVES
       To identify changes in the nature and extent of AOD use and
  01   emerging problems

  02   To identify changes in alcohol and other drug-related negative consequences

  03   To inform policy, planning and advocacy efforts at local and other levels

  04   To support networks of local role players in the substance use area

       To stimulate research in new or under-researched areas that is likely to provide useful
  05   data to inform policy/planning decisions.

       To facilitate South Africa’s full participation in international fora focusing on the
  06
       epidemiological surveillance of drug use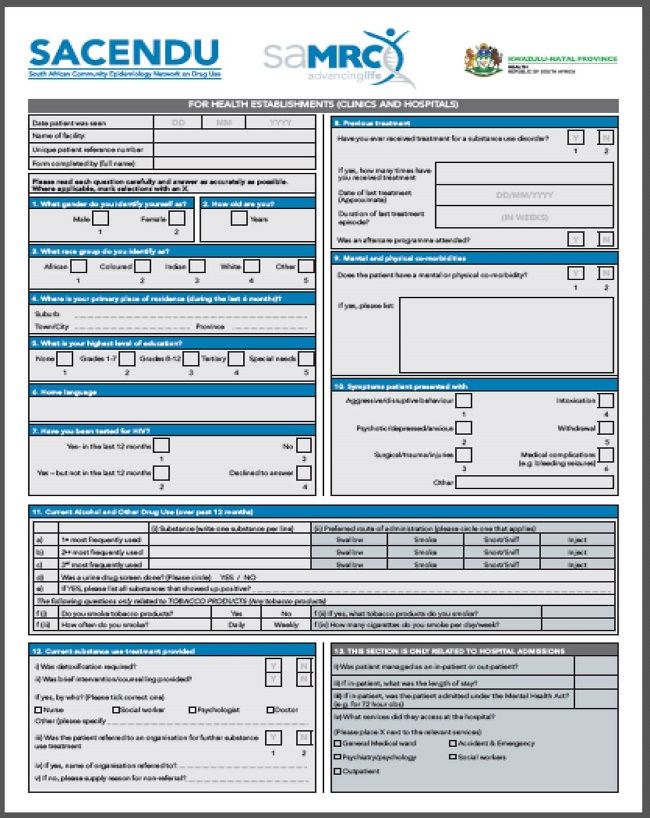
•   SACENDU operational in 9 provinces
    (with some provinces combined)
•   ± 86 treatment centres (nationally) are
    part of the SACENDU network covering
    approximately 80% of treatment
    population and 75% of treatment centers
     – Includes state funded private and
         non-governmental organisations
•   ± 10K persons seen in treatment every 6
    months

                         WC     KZN       EC   GT     NR (2)   CR (3)   Total
     Treatment centres    36    11        5     18     11        3       84

       # of patients     2652   980      336   4224   1423      189     9804
         (2019b)
METHODOLOGY                         • Main data sources are from
                                    • 1) Treatment episodes from
Membership of SACENDU                 substance use treatment
                                      centres
                                    • 2) CBS - Harm reduction*
                                    • Other sources have included
                                      and include:
                                       • Psychiatric hospitals*
                                       • SAPS arrest & seizure
                                          data & data from FSL
Bi-annual meetings to present /        • Household & school
discuss meaning & implications of         surveys
data from different sources            • Arrestees
                                       • Ad hoc studies
SACENDU BI-ANNUAL PROCESS

                                    Collection
                                     from tx                                              Analysis          • Bi-annual Meetings in
  • Completion of                                      • Data entry throughout
    questionnaires (online           centres             the year                                             April or October in
                                                                                                              CTN, PE, JHB, DBN
    or manually)                                       • In preparation for
                             • Regional reps in each     analysis data is        • Data anlaysed for all    • Speakers invited to
  • e.g. July-December
    or Jan-June                province                  cleaned                   regions and nationally     share research

            Data
          collection                                              Data                                          Disseminated
        from clients                                            captured
DATA COLLECTION
    A) TREATMENT DEMAND
•   A standardized 1 page form is completed on each person treated by a given centre during a
    particular 6-month period

                             Demographics: gender, age, race, suburb, education,
                             employment, marital status

                             Substance abuse info: 1º & 2º substance of abuse, mode
                             of use, frequency of use, age of 1st use, prior treatment

                             HIV Testing in the past 12 months

                             Referral Sources, sources of payment, types of treatment
                             received.

                             ?s about common NCDs and use of codeine
DATA COLLECTION
B) COMMUNITY BASED HARM REDUCTION SERVICES
o   Provided by TB HIV Care, Anova Health Institute, OUT Wellbeing, the Foundation for Professional
    Development (FPD), Tintswalo Home Based Care and the University of Pretoria’s Department of Family
    Medicine for:
     o    people who use drugs (PWUD), including people who inject drugs (PWID), MAT, needle exchange services as well as HIV treatment
         services.
     o   These services are provided in Cape Town, Durban, Ekurhuleni, Ehlanzeni, Johannesburg, Sedibeng, Pietermaritzburg, Port Elizabeth and
         Pretoria.

C) HOSPITAL ADMISSION DATA DOH KZN
• Collaboration with the substance abuse directorate at the Department of
  Health in KwaZulu–Natal.
• Data collection to commence in 2021.
• Psychiatric facilities, Community Health Centres and general hospitals,
  accidents and emergencies.
• Demographics, past 12 month HIV testing, previous treatment, mental and
  physical co-morbidities, symptoms at admissions, ATOD use, treatment
  provided (detoxification, referral)
TREATMENT DEMAND DATA
Partner
logoProportion of persons in treatment with Alcohol as their primary
substance of use (%) – 2012 to 2019
65
55
45 WC
GT
35
KZN
EC
25
NR
15 CR
5
2012 2013 2014 2015 2016 2017 2018 2019
-5Proportion of persons in treatment with Cannabis as their primary
substance of use (%)
60
50
40
WC
GT
30 KZN
EC
NR
CR
20
10
0
13a 13b 14a 14b 15a 15b 16a 16b 17a 17b 18a 18b 19a 19bTreatment demand trends: Methamphetamine (%) as primary and
secondary substance of use (WC)
60
50
40
Primary
30 Secondary
Overall
20
10
0
11a
12a
13a
14a
15a
16a
17a
18a
19a
11b
12b
13b
14b
15b
16b
17b
18b
19bTreatment admissions trends - % of patients
TRENDS IN OVERALL INJECTION DRUG USE BETWEEN 2012 AND 2017

  800

  700                                                                     680

  600
                                                          548

  500                                     478

                           428

  400

  300      270

  200

  100

    0
           2013            2014           2015            2016           2017

  Data suggests a small but statistically significant increase in the overall proportion of
  patients reporting injection drug use, from 1.6% (270/18919) in 2013 to 3.5%
  (680/19493) in 2017 (p
POLYDRUG USE (2 OR MORE DRUGS OF ABUSE %)
59
60 47
48 48
50 40 37
40
30 46 44 39 33
39 34
20
10
0
WC GT KZN EC NR CR
2009b 2019bTx demand data based on data from 9 provinces
(primary+secondary drugs): 2019b (%)
45 44,1
40
35
29,6
30
24,2
25
21,3
20
15
10,3
10 7,4
4,5
2,9
5
0
Alcohol Cannabis Cocaine Heroin Methamphetamine Mandrax OTC/PRE CATDATA ON COMMUNITY BASED HARM REDUCTION SERVICES
Dr Andrew Scheibe
Partner
logoSERVICES PROVIDED ARE IN LINE AS PER THE WORLD HEALTH ORGANIZATION’S GUIDELINES AND INCLUDE: HIV, STI and TB prevention Testing and linkage to care Harm reduction behaviour change interventions Needle and syringe services Opioid Substitution Therapy (OST) Monitoring of human rights violations and referral for other available substance use disorder treatment services Routine hepatitis B (HBV) and hepatitis C (HCV) diagnostic and treatment services (in 2019 - limited due to resource constraints)
TB HIV CARE’S STEP UP PROJECT
                                                 •   January and March 2019:
                                                       o 1 566 PWID accessed the services (623 in the Cape Metro, 440 in
                                                           eThekwini, and 503 in Nelson Mandela Bay).
•   Provides harm reduction services to people   •   April and June 2019,
    who inject drugs (PWID)                            o 1 592 PWID accessed services across these sites (640 in the Cape
     – Cape Metro (Western Cape),                          Metro, 564 in eThekwini, and 388 in Nelson Mandela Bay).

     – Nelson Mandela Bay (Eastern Cape)         •   Across sites, 98% were over the age of 20 years
     – eThekwini (KwaZulu-Natal)                 •   Majority were men (ranging from 76% in Nelson Mandela Bay to 87% in
                                                     eThekwini).
                                                 •   Racial characteristics of service users varied by site:
•   Comprehensive services provided through            o Coloured in the Cape Metro (77%),
    community-based outreach modalities and            o White in Nelson Mandela Bay (80%),
    also from Drop-In Centres in Cape Town and         o Black African in eThekwini (83%).
    eThekwini.
                                                 •   8 392 needle and syringe service contacts with PWID were made (0 in
                                                     eThekwini, 5 722 in the Cape Metro and 2 670 in Nelson Mandela Bay)

                                                 •   238 677 needles and syringes were distributed (150 659 in the Cape Metro
                                                     and 88 018 in Nelson Mandela Bay), with return rates of 68% and 74%
                                                     respectively.
HIV AND TB SERVICES o Among PWID who accessed additional health services: o 440 tested for HIV (209 in eThekwini, 106 in the Cape Metro, 125 in Nelson Mandela Bay), 11% (47/440) of whom tested positive (26 in eThekwini, 15 in the Cape Metro, 6 in Nelson Mandela Bay). o Eight clients were started on antiretroviral therapy (ART) (3 in eThekwini, 4 in the Cape Metro, 1 in Nelson Mandela Bay). o Additionally, 522 PWUD were screened for tuberculosis (TB) (209 in eThekwini, 188 in the Cape Metro, 125 in Nelson Mandela Bay) with 1 being symptomatic (1 in Nelson Mandela Bay).
CLIENTS ON OPIOID SUBSTITUTION THERAPY, LOST TO FOLLOW-UP AND EXITED
PROGRAMME - BY SITE (JANUARY – JUNE 2019)

                                                                              No. restarted
                                                            No. initiated        during
                                            No. on OST      on OST for         period that    No. LTFU   No. exited   No. died
                                                                                                                                 No. on OST at   Retention rate
                                             at start of     first time       were lost to     during     during       during
                                                                                                                                 end of period     for period
                                               period          during         follow-up at     period     period       period
                                                               period            start of
                                                                                 period

                     People who
                                                 23                0                    0        0          23*          0           0**             N/A
                     smoke heroin
KZN                  People who
                                                 0                 0                    0        0           0           0            0              N/A
                     inject heroin
                     Total                       23                0                    0        0          23*          0           0**             N/A
                     People who
                                                 31
WC                   inject heroin
                                                                   0                    2        1           3           1            28         85% (28/33)
                     (total)
* All clients were down-titrated as per the time limited nature of the project.
** Clients were offered referral to another site to continue OST through self-funding
ANOVA HEALTH INSTITUTE’S JAB SMART
PROJECT
• This project provides harm reduction and HIV prevention services for PWID in sub-district F of the City of
Johannesburg. Between January and June 2019, 1 518 unique PWID accessed services.
Characteristics of people who use drugs accessing needle and syringe services (January – June 2019)
Black Median
Site Male Female Indian Coloured White
African age
% % (yrs)
Johannesburg
(n = 1 518) 92% 8% 94% 2% 2% 2% -OUT WELLBEING AND FPD’S HARMLESS PROJECT • The HARMless Project works in Region 3 of the City of Tshwane. • Comprehensive services are provided mainly through community- based outreach modalities and also from a Drop-In Centre. • Between January and June 2019, 1 707 unique PWID accessed services. • 264 116 needles and syringes were distributed, with a return rate of 88%.
• Among PWID who accessed additional health
  services:

  – 993 tested for HIV
    • 292 (29%) of whom tested positive and,
    • 169 (58%) were started on antiretroviral therapy (ART).
  – Data on HIV viral suppression was unavailable.
THE DEPARTMENT OF FAMILY MEDICINE AT THE UNIVERSITY OF PRETORIA’S COMMUNITY ORIENTATED SUBSTANCE USE PROGRAMME (COSUP) • COSUP project offered needle and syringe services and OST across several regions of the City of Tshwane. • A total of 55 659 needles were distributed with a 86% return rate. • A total of 7 695 needle and syringe service contacts were made.
• Characteristics of people who use drugs started
  on opioid substitution therapy – Demographics
  (January – June 2019)
         Site         Male   Female    Black    Indian       Coloured   White   Median age
                                      African
                             %                           %                         yrs
    Tshwane (COSUP)
                       92        8      78        4            10        8         30
        (n=357)
Clients on opioid substitution therapy, lost to follow-up and exited programme (January –
June 2019)
A total of 770 people were on OST at the beginning of January 2019.
During the period 357 people who use heroin (injecting and non-injecting) were initiated, 34 were
reinitiated, 27 people were lost to follow-up, 14 people exited, 4 people died, and 1116 were on OST at the
end of June.
Tshwane / COSUP Number on Number Number Number Number Number died Number on Retention rate for
OST at start initiated on restarted LTFU during exited during during OST at end period
of period OST for first during period period period of period
time during period that
period were lost to
follow-up at
start of
period
People who smoke
- 159 19 9 7 2 162 -
heroin*
People who inject
- 198 15 18 7 2 188 -
heroin
Total 770 357 34 27 14 4 1116 99% (1116/1161)**
* Data not available for this period
** Retention influenced by high number of people started on OST during this period.CITY OF TSHWANE HOUSEHOLD ASSESSMENTS
BY COMMUNITY HEALTH CARE WORKERS
• During January – June 2019 10 489 households were visited across 7 sub-districts (regions) of the City of
Tshwane by community health care workers.
• Standard household health and social screening assessments.
• 705 households (7%) were identified to have at least one person residing in the household with a substance
use problem (defined as “experiencing health and social problems due to substance use”).
• The most commonly reported substances that were used were:
– alcohol (53%),
– cannabis (17%)
– heroin (4%).
• Thirty-three individuals reported injecting drugs for non-therapeutic reasons.
• Fifty-six households (8%) had one household member who requested assistance for their substance use.COVID 19/ NEW DATA SOURCES
Partner
logoCOVID-19 AND ALCOHOL
Decrease in trauma-related admissions during level 5 and 4. Prior COVID 19: Approximately 35000 trauma cases a week at about
400 secondary and tertiary hospitals.
Partner
Since the lockdown, approx two-thirds of trauma cases disappeared, including an estimated 9000 alcohol-related admissions. logo
Parry and Matzopolous, 2020CURRENT STUDIES UNDERWAY
• Many studies running although
not national surveys
– COVID 19, 2 online surveys
• Community/high risk population • Want to assess individuals’ changes in
based surveys overall wellness, physical health, mental
health, and the impact of lockdown
• Exponential increase in trauma- restrictions on alcohol, tobacco and other
related admissions in June drug use in South Africa.
versus Level 4 and 5 Lockdown • Alcohol Survey with Massey University
• SACENDU – monitoring tx need – Alcohol use 2019 vs Covid 19
during COVID 19 • Tx Centres – Treatment need, impacts
and challenges during Covid 19
Partner
logoSELECTED ISSUES FOR CONSIDERATION (2019B)
Implications for policy Issues to monitor
• Consider setting up a national strategy to address use of opiates (use of
Nyaope/heroin and misuse of codeine) and a provincial strategy to address • Increase in heroin and cannabis treatment demand in the EC,
use of “Lean” (codeine syrup & sweetened drinks) among young persons in including Nyaope inSELECTED ISSUES FOR CONSIDERATION (2019B)
Research questions Challenges/limitation
• Extent of unmet treatment need in general.
• Effect of legalization of private use of cannabis • Not all centres participate
among adolescents & young adults. • Sometimes data are missing
• What is the reason for the drop off in treatment • Not everyone has equal access to treatment
demand related to cannabis use in GT? centres (e.g. rural populations, poor)
• Funding
• How big is the use of Lean and Xanax in schools in
KZN? Successes
• Are we adequately dealing with mental health
problems at substance abuse treatment centres? • Project has been going for 23 years
• What is the extent of youth dropping out of school • Ongoing support from National Department
because of substance use? of Health
• Identify best ways to screen for drug use in drivers • New support from Department of Social
routinely, especially cannabis use. Development & linkage to SQM project
• New ongoing data on Harm ReductionFOR MORE INFORMATION
• nadine.harker@mrc.ac.za
http://www.mrc.ac.za/intramural-research-units/ATOD-sacenduYou can also read