COVID Model Projections - BC COVID-19 Modelling Group September 1, 2021 @bcCOVID19group
←
→
Page content transcription
If your browser does not render page correctly, please read the page content below
September 1, 2021
                                      BC COVID-19 Modelling Group

COVID Model Projections
            September 1, 2021

    BC COVID-19 Modelling Group

                                @bcCOVID19group
September 1, 2021
                                                                 BC COVID-19 Modelling Group

About BC COVID-19 Modelling Group
                                                  Contributors to report
                                                  Eric Cytrynbaum (UBC, co-editor)
                                                  Sarah Otto (UBC, co-editor)
                                                  Dean Karlen (UVic and TRIUMF)
                                                  Caroline Colijn (SFU)
                                                  Jens von Bergmann (MountainMath)
                                                  Rob James (evidently.ca)
                                                  James Colliander (UBC and PIMS)
                                                  Daniel McDonald (UBC)
                                                  Paul Tupper (SFU)
                                                  Daniel Coombs (UBC)
                                                  Elisha Are (SFU)
                     https://bccovid-19group.ca   Bryn Wiley (UBC)

        Independent and freely offered advice,
       using a diversity of modelling approaches.                                        2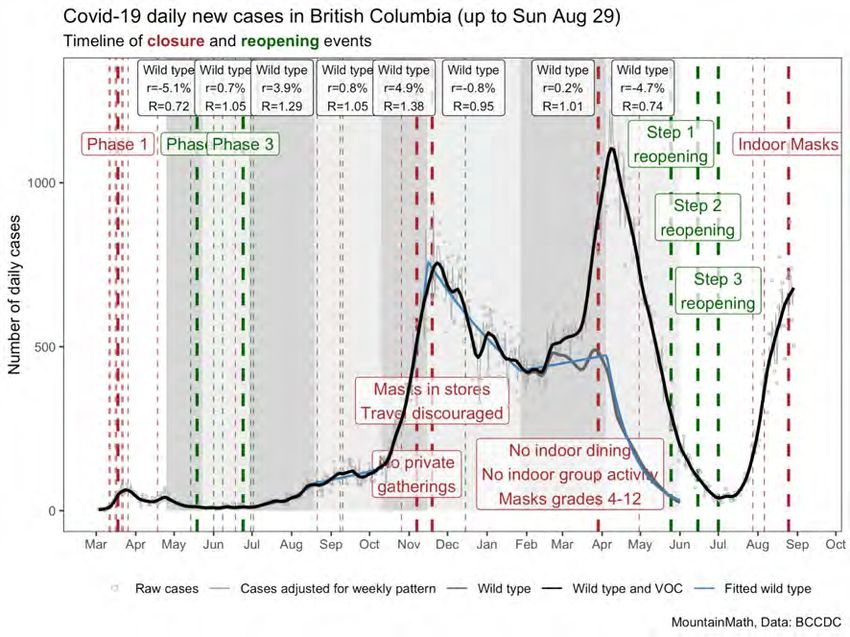
September 1, 2021
                                                                                BC COVID-19 Modelling Group

BC: A transition period with growth continuing, but slower
 Overall summary
  ●   Mandates and public response to rising case numbers have slowed the spread of
      COVID-19. The Interior, with the earliest restrictions, shows the strongest slow down.
  ●   In BC, cases are now growing at only 2% each day (corresponding to a doubling time
      of 40 days if this growth rate continues)
  ●   The BC-wide mask mandate will likely reduce growth rates further in the coming
      weeks.
  ●   We’ll get the most bang-for-the-buck from having vaccine passports if people get
      vaccinated as early as possible, both protecting them from severe cases but also
      reducing transmission to others.
  ●   The number of patients in hospital has risen exponentially over the past month. Of
      these patients, an increasing fraction are needing ICU care.
  ●   Vaccines are showing high effectiveness in BC across age groups, reducing cases
      12-fold and hospitalization rates 29-fold once fully vaccinated (age-corrected
      analysis).
                                                                                                        4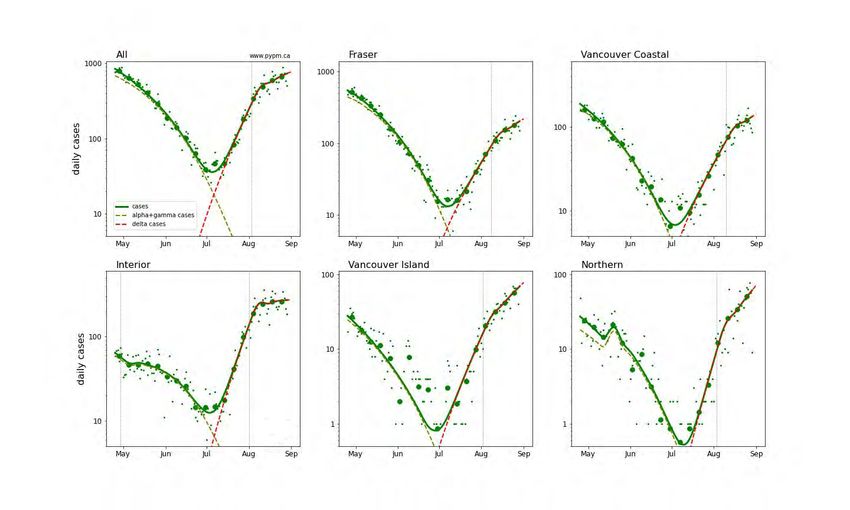
September 1, 2021
                                                                                                                                              BC COVID-19 Modelling Group

     Current state of COVID-19 in BC
    Public health measures introduced in the Interior Health Authority
    have substantially reduced the growth rate of COVID-19*.

    Growth rates are beginning to slow in the other Health Authorities.

    Growth rates across BC are expected to reduce further in the
    weeks ahead with the BC-wide mask mandate (effective August
    25) and launch of a vaccine passport (partial vaccination required
    September 11; full vaccination October 24).

*Central Okanagan – July 29: masks, August 6: restrictions on group gatherings; Interior – August 21: masks; August 23: some restrictions on group gatherings. BC –
                                                                                                                                                                      5
August 25 mask mandate; vaccine passport to come into effect on September 13 (first dose) and October 24 (second dose)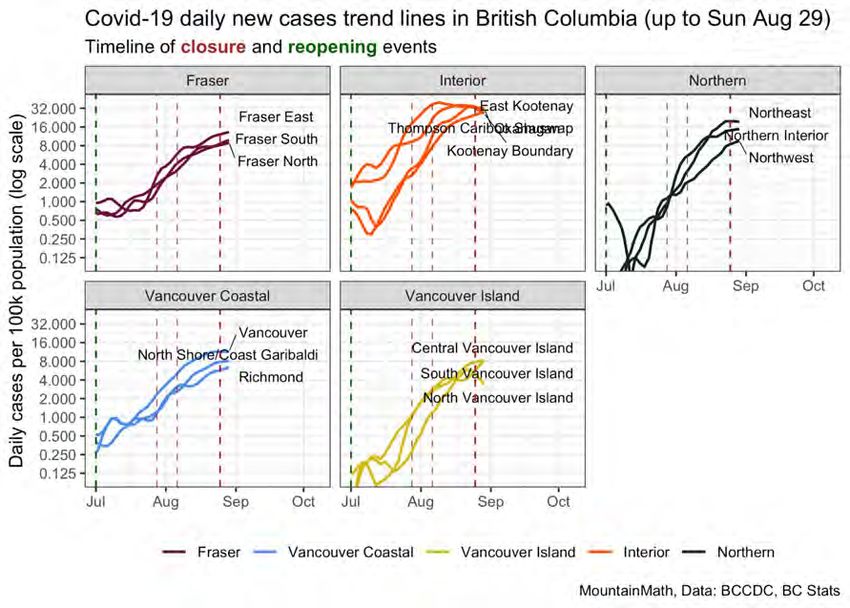
September 1, 2021

State of the COVID-19 Pandemic in BC                                                                                                               BC COVID-19 Modelling Group

                                                                                                                                    After a period of rapid growth,
                                                                                                                                    case growth rates are slowing.

                                                                                                                       A slight slow down is visible following
                                                                                                                        public health orders in the Interior*.
                                                                                                                         BC-wide restrictions have not yet
                                                                                                                         had time to have a visible impact.

                                                                                                                        COVID-19 continues to spread,
                                                                                                                         but now more slowly, in BC.

Source (J. von Bergmann) Case data from BC COVID-19 Database (http://www.bccdc.ca/health-info/diseases-conditions/covid-19/data). Vertical lines give dates of public
health measures (major as thick lines, minor as thin lines). Grey dots are raw case counts, grey lines is cases abused for weekly pattern, black STL trend line and blue fitted
periods of constant exponential growth. *Central Okanagan – July 29: masks, August 6: restrictions on group gatherings; Interior – August 21: masks; August 23: some            6
restrictions on group gatherings. BC – August 25 mask mandate; vaccine passport to come into effect on September 13 (first dose) and October 24 (second dose)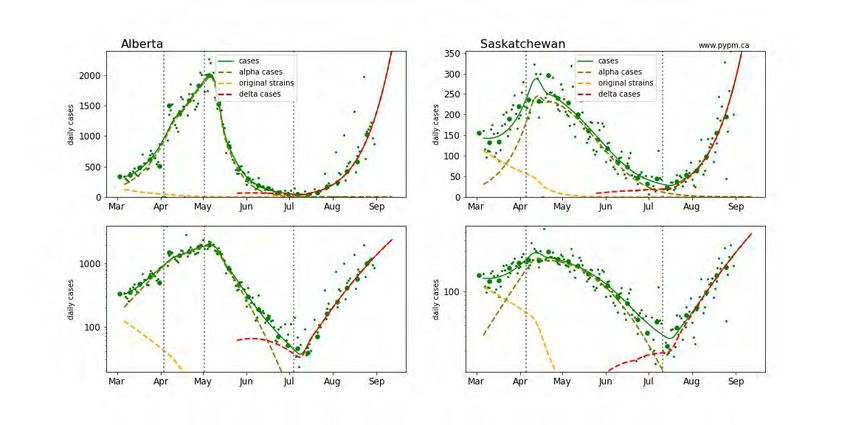
September 1, 2021

State of the COVID-19 Pandemic in BC                                                                                                     BC COVID-19 Modelling Group

                                                                                                   All Health Service Delivery Areas have exhibited
                                                                                                               similar case growth rates.
                                                                                                   Regions in the Interior, including the Okanagan,
                                                                                                         have slowed substantially in growth.

Source (J. von Bergmann) Case data from BC COVID-19 Database (http://www.bccdc.ca/health-info/diseases-conditions/covid-19/data). Vertical lines give dates of
public health measures (major as thick lines, minor as thin lines). STL trend lines on log scale.
                                                                                                                                                                 7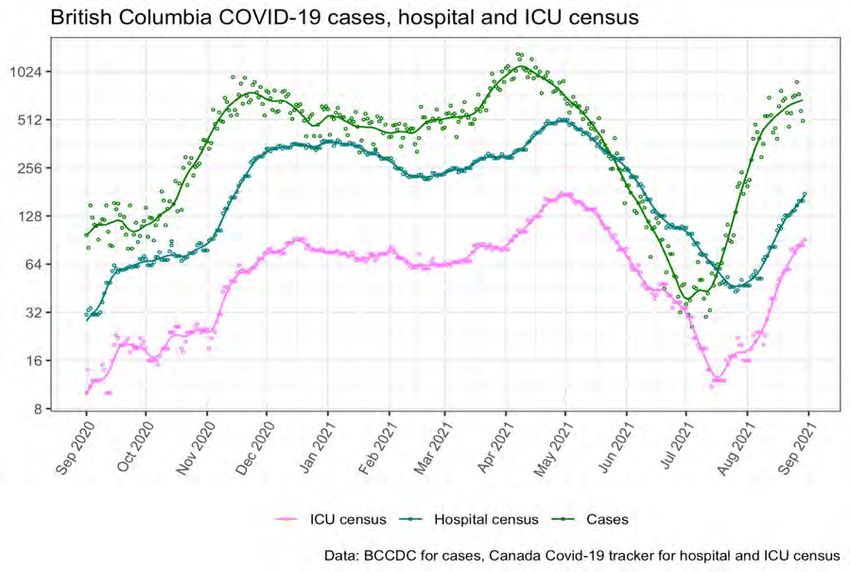
September 1, 2021
                                                                                                                                              BC COVID-19 Modelling Group
  Model fits to BC data (July 28 report)

                                                               Rapid exponential growth in July prompted regional mask
                                                               mandates and social gathering restrictions*.
                                                               These figures show the case history available on July 28, compared to fitted
                                                               models:
                                                                 ●     Small dots: daily cases
                                                                 ●     Large dots: weekly average daily cases
                                                                 ●     Green curve: fitted model cases (total)
                                                                 ●     Dashed red curve: model for delta variant
                                                               Exponential growth follows a straight line (note logarithmic scale on y axis).
                                                               See video showing that model predictions are accurate while similar public health
                                                               measures remain in place, changing with changing policies and behaviour.
Source (D. Karlen). See www.pypm.ca. These models have no age structure. Fits include past vaccination schedule. *Central Okanagan – July 29: masks, August 6:
restrictions on group gatherings; Interior – August 21: masks; August 23: some restrictions on group gatherings. BC – August 25 mask mandate; vaccine passport to     8
come into effect on September 13 (first dose) and October 24 (second dose)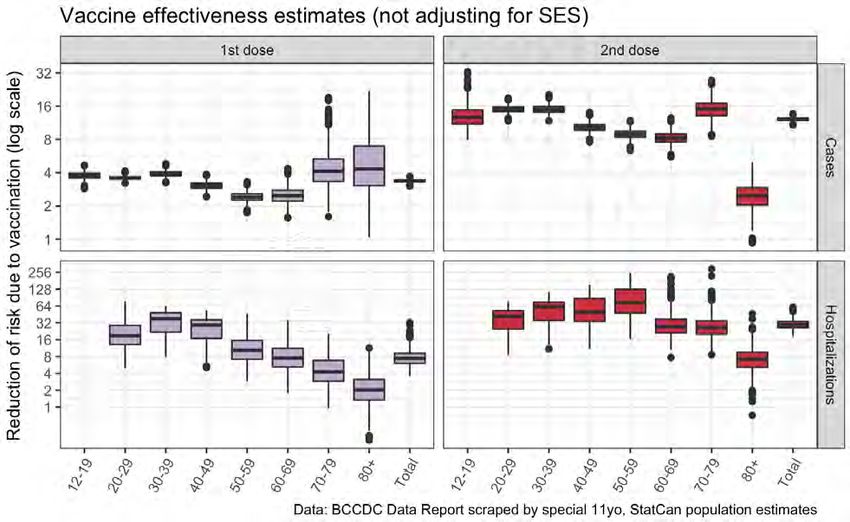
September 1, 2021
                                                                                                                                             BC COVID-19 Modelling Group
  Model fits to BC data (August 30)

                                                                                                                                                 Recent
                                                                                                                                                 measures and
                                                                                                                                                 the public’s
                                                                                                                                                 response have
                                                                                                                                                 nearly stopped
                                                                                                                                                 growth in the
                                                                                                                                                 Interior and have
                                                                                                                                                 significantly
                                                                                                                                                 slowed growth in
                                                                                                                                                 all other regions.

Source (D. Karlen). See www.pypm.ca. These models have no age structure. Fits include past vaccination schedule. Overall growth in BC is currently at 1.8% per day   9
(corresponding to a 40 day doubling time if this rate were to continue), but rates are currently in transition due to recent mandates in BC.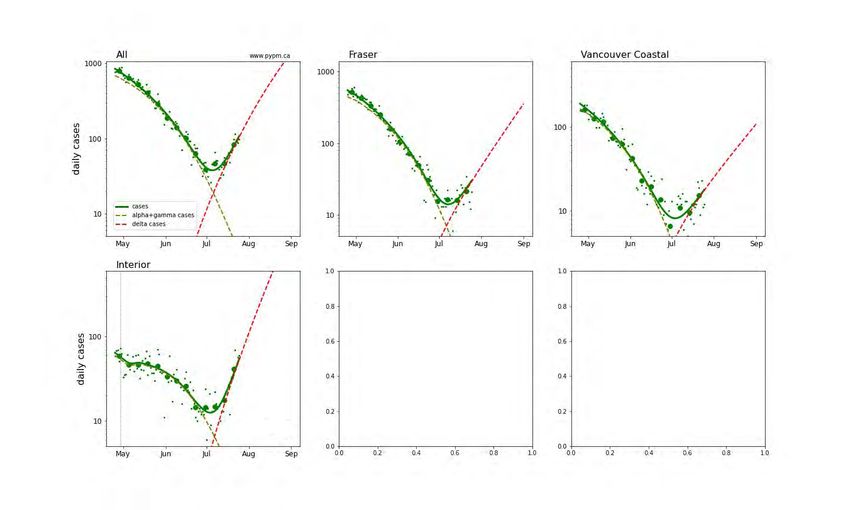
September 1, 2021
                                                                            BC COVID-19 Modelling Group

Will recent BC-wide mandates reverse growth?
The BC-wide mask mandate became effective August 25th. Will this be enough?
We do not yet know. Growth rates have begun to slow, but we need about 2 weeks of
case data after a shift in restrictions to estimate growth with any confidence.
The following considerations suggest that the BC mask mandate may just stop growth,
but a shift to more indoor activities may counteract that:
 ●   The Interior continues to exhibit growth, at a slower rate, despite a mask mandate in
     the Central Okanagan (effective July 29) and in the Interior (effective August 21st).
 ●   A 2020 study comparing states in the USA found that mask mandates reduced the
     daily growth rate by ~2% per day, which would flatten the current growth in BC.
 ●   In October 2020, growth rates increased significantly as activities moved indoors.
A BC mask mandate could make a bigger difference, however, if more people wear
masks (higher adherence) and if we use better masks (higher efficacy). [Reviewed here]
                                                                                                  10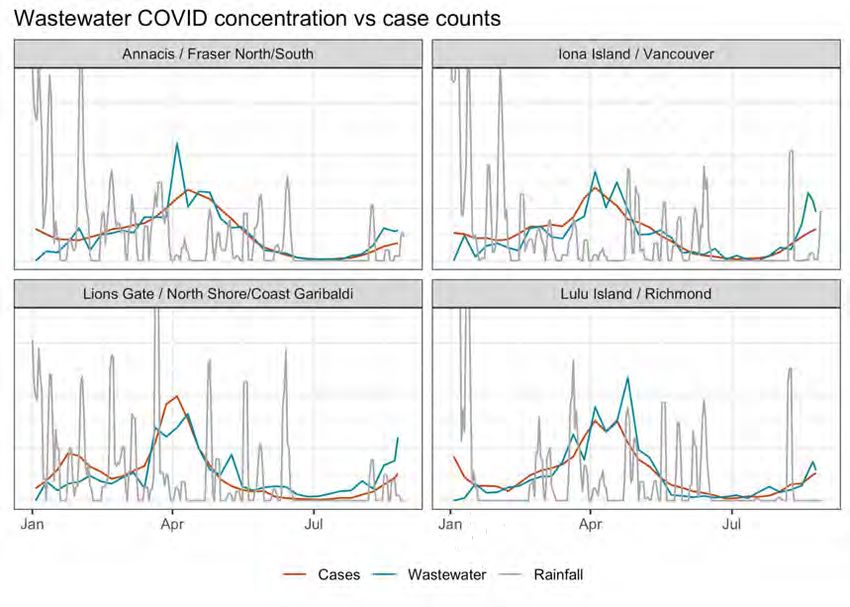
September 1, 2021
                                                                      BC COVID-19 Modelling Group

Impact on Health Care

The rising number of cases is creating an increasing health impact in British
Columbia, with increasing numbers of patients in hospital and in ICU.

Recently, more patients in hospital are requiring ICU, possibly due to the
observed rise in severity due to Delta seen in other jurisdictions.

                                                                                             11
September 1, 2021
BC COVID-19 Modelling Group
Hospital and ICU occupancy over time
Hospitalization and ICU
occupancy continue to rise,
tracking the rise in COVID-19
cases, with a slight delay as
symptoms develop.
12
Source (J. von Bergmann) Case data from BC COVID-19 Database (http://www.bccdc.ca/health-info/diseases-conditions/covid-19/data). STL trend lines on log scale.September 1, 2021
BC COVID-19 Modelling Group
Hospital and ICU occupancy over time
Both hospital and ICU occupancy
have risen exponentially through
August.
The number of patients in ICU has
grown faster than those in hospital
(daily growth rates of 0.065 versus
0.046).
Although many factors may
contribute, the Delta variant that
now predominates (98% of BC
cases) has been found to be more
severe in other jurisdictions*, which
may explain the faster growth in
cases needing ICU care.
Source (S. Otto) Case data from BC COVID-19 Database (http://www.bccdc.ca/health-info/diseases-conditions/covid-19/data). Curves show an exponential model fit.
*Singapore study found that Delta was 4.9 times more likely to lead to an oxygen requirement, ICU admission, or death among unvaccinated hospitalized patients; see 13
overview of Delta severity in CBC article.September 1, 2021
BC COVID-19 Modelling Group
Hospital and ICU occupancy over time
Of those patients in hospital,
the fraction in ICU has thus
recently increased.
Although many factors may
contribute, the Delta variant
that now predominates (98% of
BC cases) has been found to
be more severe in other
jurisdictions*.
Source (J. von Bergmann) Case data from BC COVID-19 Database (http://www.bccdc.ca/health-info/diseases-conditions/covid-19/data). STL trend lines on linear
scale. *Singapore study found that Delta was 4.9 times more likely to lead to an oxygen requirement, ICU admission, or death among unvaccinated hospitalized patients; 14
see overview of Delta severity in CBC article.September 1, 2021
BC COVID-19 Modelling Group
Estimating demands on health care
Effect of The COVID-19
BC-wide pandemic is tracked
mask using positive tests
mandate not (cases), yielding an
yet known infection model
(green curve).
The infection model
projects hospital
Effect of occupancy well.
BC-wide
mask Recent hospital
mandate
occupancy is lower
not yet
known
than projected, while
ICU occupancy is
higher.
15
Source (D. Karlen). See www.pypm.ca. These models have no age structure. Fits include past vaccination schedule.September 1, 2021
BC COVID-19 Modelling Group
Vaccines protect against COVID cases and hospitalization
People who are fully vaccinated
are on average 29 times less
likely to require hospitalization.
No vaccinated 12-19 year olds
Vaccine protection is even
went to hospital!
stronger for younger adults.
Importantly, while this analysis
corrects for age class, it does
not account for socio-economic
status and other important
correlates of risk.
Source (J. von Bergmann) Data from BC Data Summary (August 19) summarizing health outcomes by vaccination status and age from July 17-August 17. Bootstrap 16
sampling conducted to give the 25-75% quantile (boxes), with whiskers spanning 2.5-97.5% of samples. See details in blog.September 1, 2021
BC COVID-19 Modelling Group
Vaccines protect against COVID cases and hospitalization
Vaccines protect less against
getting a case of COVID (top)
or hospitalization (bottom) after
only one dose (left).
Getting a second dose boosts
protection substantially across
all age classes (right).
No vaccinated 12-19 year
No vaccinated 12-19 year
olds went to hospital!
olds went to hospital!
The most elderly members of
BC remain most vulnerable, but
they are still 12 times less likely
to be hospitalized if fully
vaccinated.
Source (J. von Bergmann) Data from BC Data Summary (August 19) summarizing health outcomes by vaccination status and age from July 17-August 17. Bootstrap
17
sampling conducted to give the 25-75% quantile (boxes), with whiskers spanning 2.5-97.5% of samples. See details in blog.September 1, 2021
BC COVID-19 Modelling Group
Vaccination rates
The recent announcement of a vaccine passport required to access many non-essential services in British
Columbia has led to an uptick in first dose vaccinations, rising in the last week from 3702 daily (August
17-23) to 6839 daily (August 24-30).
Nevertheless, this is a small fraction of the 733,000 eligible people who are unvaccinated (August 30th).
While first dose vaccinations are not required until September 13, getting vaccinated as soon as possible will
have a greater impact on the pandemic and help to avert stricter social mandates:
● The earlier people get vaccinated, the earlier they are personally protected. Our immune system
response matures over time, rising substantially only after ~3 weeks.
● The earlier people get vaccinated, the less likely they will infect others. The sooner we get
vaccinated, the sooner we can protect those around us, reducing transmission rates.
In order to substantially lower the large rise in cases and hospital demand projected in October (see August
18th report), we encourage unvaccinated individuals to get vaccinated as early as possible.
19September 1, 2021
BC COVID-19 Modelling Group
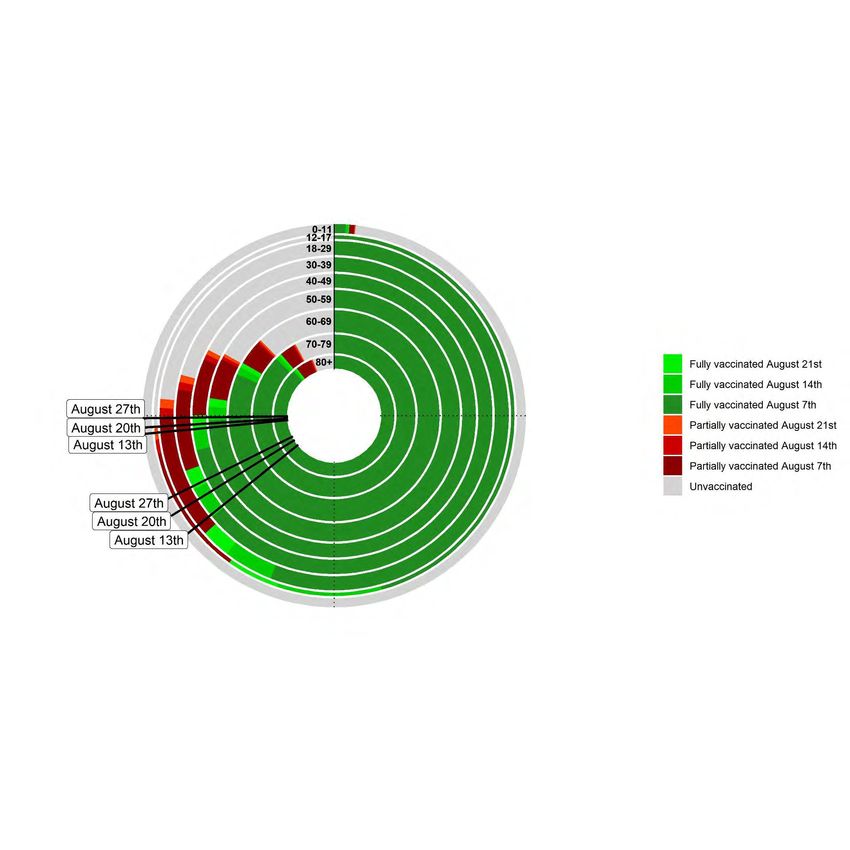
Closing the circle: Vaccination status by age
August 28th update includes data through August 21st, 2021
Slow progress on 1st doses:
The fraction of BC’s entire
population with at least one dose
has sped up, but only slightly,
rising ~0.9% per week.
Slowing progress on 2nd doses:
The fraction of BC’s population who
are fully vaccinated shows slowing
growth, now rising ~1.5% per week.
Source (B. Wiley). Design by Blake Shaffer (https://blakeshaffer.shinyapps.io/app_vaccines/) BC Vaccination data from
https://health-infobase.canada.ca/covid-19/vaccination-coverage/, with area of each circle segment proportional to BC’s population in that age class. BC 2021 Population 20
projections for vaccination percentages from BC Stats: https://www2.gov.bc.ca/gov/content/data/statistics/people-population-community/population/population-projectionsSeptember 1, 2021
BC COVID-19 Modelling Group
Vaccination progress
Vaccine passports announced
in BC (August 23) and in
Quebec (July 8) have been
followed by a slight rise in first
dose vaccinations.
22September 1, 2021
BC COVID-19 Modelling Group
Vaccination helps
We continue to see a major effect of vaccination levels across Community Health Service Areas (CHSA).
For the most recent two-weeks of cases, communities with 70% of eligible people vaccinated have four
times more COVID-19 cases than those with 90% vaccination.
Average daily case rate/100,000
(August 13 - August 25)
Vaccines protect, even against Delta,
e.g., these studies from the UK:
● 8.3-fold lower infection ratesa
● 2.6-fold lower chance of
hospitalization if infectedb
→ Vaccination double protects
Vaccination % in CHSA p < 0.0001
(at least one dose, 12+) permutation test
Source (S. Otto). BCCDC data portal’s surveillance dashboard data; see maps for regions
that would most benefit from community vaccination drives (accessed August 30, 2021). http://www.getvaccinated.gov.bc.ca 23
a
Lopez-Bernal (2021) NEJM. b Sheikh et al. (2021) LancetSeptember 1, 2021
BC COVID-19 Modelling Group
Alberta and Saskatchewan
Like BC, Alberta and Saskatchewan have experienced
● rapid growth in delta infections starting in July
● growth in COVID hospital and ICU occupancy consistent with expectations
given the rise in cases
The next slides show the recent case and hospital occupancy, and projections for
the following scenarios:
● No action
● Rapid expansion of vaccination
● Measures taken to reduce transmission and rapid expansion of vaccination
To reduce the burden on health care systems, measures to reduce transmission
are necessary, in addition to expanded vaccination.
24September 1, 2021
BC COVID-19 Modelling Group
Alberta and Saskatchewan case history
Growth pattern
similar to that
observed in
BC before
mandates.
Sustained
growth since
mid-July, now
at 6% (5%)
per day for
AB (SK).
25
Source (D. Karlen). See www.pypm.ca. These models have no age structure. Fits include past vaccination schedule.September 1, 2021
BC COVID-19 Modelling Group
AB, SK projections for no-action
If no action is taken,
COVID
hospitalizations
would far exceed
previous records.
26
Source (D. Karlen). See www.pypm.ca. These models have no age structure. Fits include past vaccination schedule.September 1, 2021
BC COVID-19 Modelling Group
AB, SK projections: rapid vaccination expansion
Rapid expansion of
first-dose vaccinations:
● AB: 20k/day,
● SK: 5k/day
not sufficient to avert
crisis, since immunity
takes time to acquire.
27
Source (D. Karlen). See www.pypm.ca. These models have no age structure. Fits include past vaccination schedule. Assumes expansion begins week of Sept 7.September 1, 2021
BC COVID-19 Modelling Group
AB, SK projections: measures and expanded vaccination
Measures to reduce
transmission and to
expand vaccination are
necessary to reduce the
demand on the health
care systems.
28
Source (D. Karlen). See www.pypm.ca. These models have no age structure. Fits include past vaccination schedule. Assumes changes occur on week of Sept 7.September 1, 2021
BC COVID-19 Modelling Group
Alberta cases are rising exponentially
Delta cases now predominate in Alberta (blue dots), underlying the rise in overall cases (grey).
Toal case number has been growing at a daily rate of ~0.06 (doubling time ~12 days).
Total cases
(gray shading)
Delta cases
(blue dots)*
*Recent Delta numbers are underestimated,
as variants are still being typed.
29
Data from source file https://www.alberta.ca/stats/covid-19-alberta-statistics.htm#variants-of-concern (accessed August 30, using data through August 27).September 1, 2021
BC COVID-19 Modelling Group
Final words
The Delta wave of COVID-19 infections is in transition in British Columbia.
Measures taken in the Interior have nearly stopped the growth in cases there.
In the other regions, growth rates have begun to slow.
With the mask mandate expanded to all of BC and schools reopening, transmission
rates are currently changing. Stay tuned for the next report to capture those
changes.
Hospital capacity may soon be exceeded in neighbouring provinces if action is not
taken soon.
30September 1, 2021
BC COVID-19 Modelling Group
Appendix
31September 1, 2021
BC COVID-19 Modelling Group
COVID-19 prevalence: Cases and wastewater
Wastewater is being monitored for
COVID-19 viral concentration in
Metro Vancouver.
Wastewater trends (blue) have
largely matched case numbers
(red) in 2021.
Comparing these trends will allow
us to detect major changes in the
fraction of infections that remain
undetected and to identify when
COVID-19 appears in an area
without cases.
Source (J. von Bergmann) Case data from BC COVID-19 Database (http://www.bccdc.ca/health-info/diseases-conditions/covid-19/data). Wastewater data from Metro
Vancouver (http://www.metrovancouver.org/services/liquid-waste/environmental-management/covid-19-wastewater/Pages/default.aspx). Wastewater viral concentration 32
(blue), cases in the local health region (red), and rainfall (grey) are drawn with the same average height, showing relative changes only.September 1, 2021
BC COVID-19 Modelling Group
Reminder: New app projecting vaccination status
Vaccination rates are changing globally, making it challenging
for universities, festivals, trade shows, conferences, or other
organizations who might want to quantify how at-risk their
participants are for COVID-19 infection.
We have created a browser app to estimate the numbers of
unvaccinated, partially vaccinated, and fully vaccinated people
in a group at a future date, based on data from around the
world on vaccination rates by location and age group.
While most accurate over short time frames, this app provides
event organizers a clearer picture of the susceptibility of their
participants to COVID-19.
33
Source (B. Wiley)You can also read