CRICKET MATCH OUTCOME PREDICTION USING MACHINE LEARNING - ijasret
←
→
Page content transcription
If your browser does not render page correctly, please read the page content below
|| Volume 5 || Issue 7 || July 2020 || ISSN (Online) 2456-0774
                                      INTERNATIONAL JOURNAL OF ADVANCE SCIENTIFIC RESEARCH
                                                                            AND ENGINEERING TRENDS

              CRICKET MATCH OUTCOME PREDICTION USING
                        MACHINE LEARNING
                              Pallavi Tekade 1, Kunal Markad 2, Aniket Amage 3, Bhagwat Natekar 4
                    Assistant Professor, Information Technology, JSPM’s Rajarshi Shahu College of Engineering, Pune, India 1
                         Student, Information Technology, JSPM’s Rajarshi Shahu College of Engineering, Pune, India 2 3 4
               tekade.pallavi@gmail.com 1, mkunal1999@gmail.com 2, aniketamage@gmail.com 3, bhagwatnatekar21@gmail.com 4

Abstract: - In cricket, particularly the twenty20 format is most watched and loved by the people, where no one can guess who will win the
match until the last ball of the last over. In India, The Indian Premier League (IPL) started in 2008 and now it is the most popular T20 league
in the world. So we decided to develop a machine learning model for predicting the outcome of its matches. Winning in a Cricket Match
depends on many key factors like a home ground advantage, past performances on that ground, records at the same venue, the overall
experience of the players, record with a particular opposition, and the overall current form of the team and also the individual player. This
paper briefs about the key factors that affect the result of the cricket match and the regression model that best fits this data and gives the best
predictions.
Keywords: - cricket, indian premier league, prediction of match, supervised machine learning
___________________________________________________________________________________________________
                         I INTRODUCTION                                              In Unsupervised learning, the data is not properly
                                                                           labelled so the machine has to sort the data according to patterns,
          After football, cricket is most loved and watched by             combinations without any training given. But in supervised
many individuals in the world but in India cricket is the most             learning, the data is labelled with the proper classification so the
loved sport. In the past few years, lots of research papers are            machine can easily analyze it and produce the correct result. For
published and lots of work is done which predicts the result of a          our application, the unsupervised learning models are not of any
cricket match by using the factors that affect the match outcome           use because the data of cricket matches are properly labelled. So
and they are using the supervised machine learning algorithms to           we are going to use the supervised learning models. In Supervised
predict the outcome of the match like Linear regression, support           learning, there are again two types are classification and
vector machines, logistic regression, decision tree, Bayes network,        regression. Classification is used to classify among categories like
random forest. Cricket is one of the most well-liked sports in the         red or blue and Regression is used when the output is a real
world. Especially the Twenty20 format is very popular as it is a           number like rupees or height. In our model, we are going to use
fast-paced form of the game that attracts the spectators at the            regression because the outcome will be the winning percentage
ground and the viewers at home.                                            and it is of type number.
          The Indian Premier League (IPL) is a professional                          Our main objective is to find the key factors that affect
Twenty20 cricket league that is governed by the Board of Control           the match outcome and select the best machine learning model
for Cricket in India (BCCI). The Indian Premier League is                  that best fits this data and gives the best results. Some works
conducted every year and participating teams represent a city in           already have been published in this area of predicting the outcome
India. Various natural factors affect the game, the hype has given         of a cricket match. In some paper, only a few key factors are taken
by the media, and a huge market like fantasy 11 and betting on             for prediction so the accuracy is less. Whereas in some paper the
sites has provided a lot of importance to the model. The rules of          machine learning model is not appropriate. So it is important to
the game, the skill of the players, their form, and various other          take all the key factors that can affect the match outcome and as
natural factors are very important in the prediction accuracy of the       well as to select the best model for training and testing the data.
result of a cricket match. As the technology is growing and the            This will increase the prediction accuracy drastically.
apps like fantasy 11 and betting sites are getting popular the
people going to use the predictions given by the machine learning                               II LITERATURE SURVEY
model. The use of machine learning makes life easier in many               A. Rabindra Lamsal and Ayesha Choudhary [1]
aspects. To predict the outcome of a cricket match we are not
                                                                                     In this paper, they have taken the data of matches from
going to rely on a single machine learning algorithm we are going          the official website of the Indian Premier League. That data had
to use all the machine learning algorithms. In machine learning,           many features so they analyzed the data and selected some key
there are two types of learning supervised learning and
                                                                           features. They had used the scikit-learn machine learning library
unsupervised learning.
                                                                           to pre-process the data and applied some selection models. They
                                                                           removed the low variance, univariate and recursive features. By

                                                      WWW.IJASRET.COM                                                                          44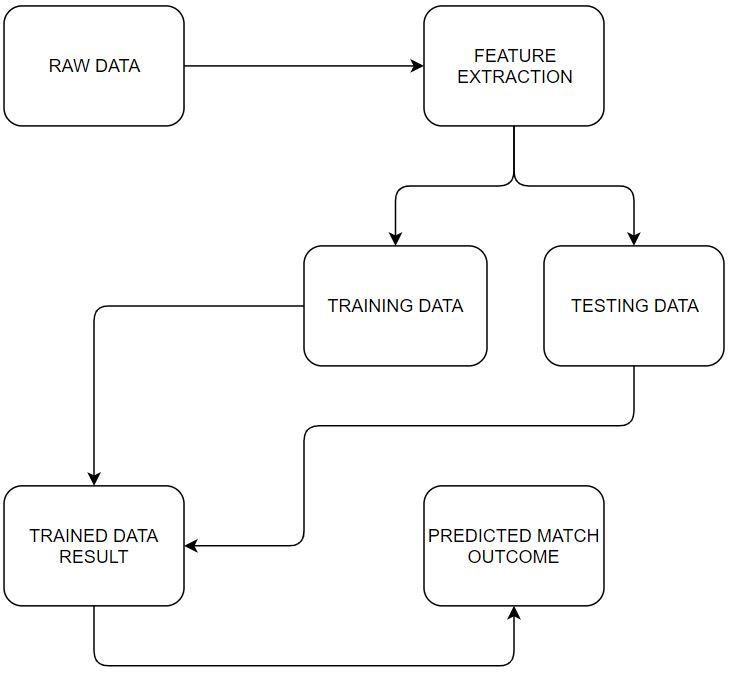
|| Volume 5 || Issue 7 || July 2020 || ISSN (Online) 2456-0774
                              INTERNATIONAL JOURNAL OF ADVANCE SCIENTIFIC RESEARCH
                                                             AND ENGINEERING TRENDS

using these feature selection models they found 5 key features         the performance of a team on the ground against a particular
from 15. The features are home team, away team, venue, toss            opponent is very important. If a team is playing on the home
winner, toss decision and winner. They had trained the Random          ground then crowd support becomes the 12th man of the team also
Forests and Multiple Linear Regression model by 10 seasons of          the players are familiar with the playing conditions. The current
IPL data and trained by the 11th season's data. 41 out of 60           form of the team and players is also important to predict the
matches their model able to classify correctly. So their accuracy is   winner. The weather condition also affects the swing of the ball
68.33% which is not so good. Limitations of this model are it uses     and the match outcome. These features can be used to train the
only 5 features and only 2 machine learning models.                    model to get better prediction accuracy.
B. Abhishek Naik, Shivanee Pawar, Minakshee Naik, Sahil                E. Geddam Jaishankar Harshit, Rajkumar S [5]
    Mulani [2]                                                                  This paper compares various supervised machine
          This paper processes the data dynamically and gives a        learning algorithms that can be used to predict the match result. A
prediction as the match progresses. Before the match starts their      dataset of 5000 one day international matches is taken from
prediction depends on the factors like batting, bowling, batting       Cricinfo and 70% is used to train the model and 30% is used to
order, captain of both the teams and batting-bowling stats on that     test the model. They are using Support Vector Machine, Logistic
ground against that opponent and after the match starts their          Regression, Decision Tree and Bayes Classifier as machine
prediction depends on batsman-bowler performance and batting-          learning algorithms. They got 60%, 65%, 67% and 72%
bowling order of particular player. They are predicting only the       respectively. So as we can see the Bayes classifier has the best
one day international (ODI) matches by using the logistic              accuracy among all.
regression and K-means clustering. In this paper, they had only
tested this model on one match which is India vs Australia happed
on 26th March 2015 at Sydney cricket ground and their prediction
was correct. Their predictions can go wrong sometimes because
they are fluctuating on every ball.
C. Singhvi, Arjun, Ashish Shenoy, Shruthi Racha and Srinivas
    Tunuguntla [3]
          In this paper, they have taken 16 features to train the
model. Features are like average runs scored by a player, the
average number of 4s and 6s hit by a player, average strike rate of
a player, number of times the player is not out, numbers of the 50s
and 100s scored by the player, total number of matches played by
a player, current and average batting position, average number of
wickets taken in a match by bowler, average economy and
average runs conceded, average number of wide and no-balls
bowled and last is average number of maiden overs bowled. They
had taken the data of all T20 matches domestic, league matches
and international. Many machine learning algorithms are used like
Randomizes Forest, Naive Bayes, Decision Trees, Linear SVM,
Non-Linear SVM and they are trained by data of 5390 T20                       Figure 1 Accuracy of different algorithms used [5]
matches. After testing the model the Support Vector Machine
                                                                       F. Akhil Nimmagadda, Nidamanuri Venkata Kalyan, Manigandla
given the best accuracy of prediction which is 63.89%.
                                                                            Venkatesh, Nuthi Naga Sai Teja, Chavali Gopi Raju [6]
D. Swetha, Saravanan.KN [4]                                                      In this paper, they are using multiple linear regression,
          In This paper only briefs about the key factors that         Logistic regression and Random Forest algorithm to predict the
cricket match depends on. No machine learning model is trained         score of t20 cricket matches of the Indian Premier League. They
to predict the match result. The factors discussed in this paper are   are also predicting the match-winner by mining the data of all the
pitch, toss, and team strength, past records, home ground              IPL matches. They are predicting the scores by calculating the run
advantage, current performance, and weather. Pitch plays a very        rate of the team by each over. They have trained their model by
important role in the match because how the ball will behave is        using data mining they have created a dataset of runs scored in
totally dependent on it. Toss is also important the teams chasing      each over of all the IPL matches. By using this data they trained
first wins more matches as the target is known and dew comes in        the multiple linear regression model and predicted the result of the
play after evening. By calculating the average of all players and      new IPL season. Their main goal is to predict the result of an ODI
the current form of players we can easily find out the team            i.e. One Day International cricket match while the game is being
strength. Past performances play a vital role in prediction, what is   played. So they are going to use this model for ODI matches also.

                                                    WWW.IJASRET.COM                                                                    45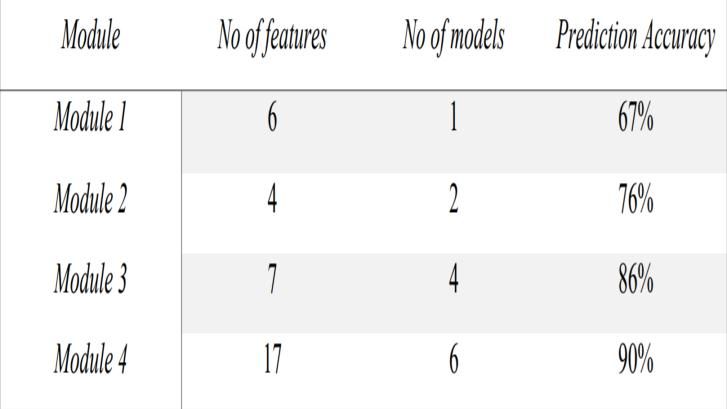
|| Volume 5 || Issue 7 || July 2020 || ISSN (Online) 2456-0774
                              INTERNATIONAL JOURNAL OF ADVANCE SCIENTIFIC RESEARCH
                                                           AND ENGINEERING TRENDS

                 III PREPARING DATASET                                  climate and also crowd support plays an important role to
                                                                        boost the confidence of players.
A. Problem with the dataset
                                                                        4. Toss
          The Indian Premier League have completed only 12                   Toss is most important than any other factor because
seasons because of which only 580 matches data is only available        bowling first on many grounds gives more advantage to the
for prediction purpose which is less compared to one-day                team because of due on the ground.
international matches and test matches. Because of issues with          5. Decision
some team franchises in some season, few teams removed and                   A decision is nothing but which choice is taken by the
some teams added. Also, some teams change their names, and              toss winning team i.e. either bat or bowl first.
some teams get discontinued. If we remove the match data of the         6. Time
teams that are not active now then we will miss some important               The Indian Premier League matches are played either in
data of the teams which are still active.                               the afternoon session or evening session.
B. Training Dataset                                                  B. Machine Learning model used
          Till now only 12 seasons have happened of Indian               1. Multiple Linear Regression
Premier League, so we are taking the first 11 seasons dataset as a           Multiple linear regression uses multiple variables to
training dataset which consists of 580 matches.                          predict a label.
C. Testing Dataset
          Till now only 12 seasons have happened of Indian                                       V MODULE 2
Premier League, so we are taking the last season i.e. 12th season
                                                                     A. Features Selected
as a testing dataset which consists of 60 matches.
                                                                         1. Pitch Conditions
D. Organizing Dataset                                                         Pitch plays an important role in the match result. If the
        The machine learning model takes data only in numbers            pitch is wet then there will be no wing and spin in that pitch. If
format so we have to convert the team names and other features           the pitch is dry then it will be good for spinners. The green
into numbers as shown in the below figure.                               pitch will be helpful for swing ballers. We classified the pitch
                                                                         condition in three types batting pitch, bowling pitch, or mix.
                                                                         2. Temperature
                                                                              The match is also affected by the temperature conditions
                                                                         of the ground. The swing and seam are dependent on the
                                                                         temperature, if cold weather is there then swing will be more.
                                                                         The temperature will be measured in two forms minimum and
                                                                         maximum.
                                                                         3. Humidity
                                                                              Humidity is nothing but a water vapor level in the air. The
                                                                         rain, dew, and fog will depend on the humidity level.
                                                                         Humidity also affects the swing and spin of the ball.
                                                                         4. Precipitation
                                                                              Precipitation measure gives how much percentage chance
                  Figure 2 Organizing Dataset                            of rain is there. It can be rain, drizzle, snow. This also affects
                                                                         the swing and spin of the ball
                          IV MODULE 1                                B. Machine Learning model used
                                                                         1. Support Vector Regression
A. Features Selected
                                                                              Support Vector Regression separate two classes plots a
    1. Team Name 1                                                       line between two classes. Support Vector Regression uses a
        This feature contains the 1st playing team name this will        support vector machine to find a line or hyperplane between
    be converted to a specific number given to that team.                classes.
    2. Team Name 2
        This feature contains the 2nd playing team name this will                               VI MODULE 3
    be converted to a specific number given to that team.            A. Features Selected
    3. Venue                                                             1. Team1 Batting Average
        If a team playing at their home ground then that team has             The player's batting average is calculated as dividing the
    a better chance to win as they are known to pitch condition,         total number of runs scored by the total number of times the

                                                  WWW.IJASRET.COM                                                                      46
|| Volume 5 || Issue 7 || July 2020 || ISSN (Online) 2456-0774
INTERNATIONAL JOURNAL OF ADVANCE SCIENTIFIC RESEARCH
AND ENGINEERING TRENDS
batsman gets out. The Team 1 Batting Average is calculated VII FINAL MODULE
by adding a batting average of all the players that are in In the final model, all the features present in module 1, 2
playing XI and dividing it by 11. and 3 are used and all the machine learning algorithms which are
2. Team2 Batting Average present in module 1, 2 and 3 are used. By calculating the
The player's batting average is calculated as dividing the aggregate percentage of all models prediction the winning team is
total number of runs scored by the total number of times the selected.
batsman gets out. The Team 2 Batting Average is calculated
by adding a batting average of all the players that are in VIII DESIGN
playing XI and dividing it by 11. A. Architecture
3. Team1 Bowling Average
The bowler's bowling average is calculated as dividing
the total number of runs conceded by the total number of
wickets taken. The Team 1 Bowling Average is calculated by
adding the bowling average of all the players that are in
playing XI and dividing it by 11.
4. Team2 Bowling Average
The bowler's bowling average is calculated as dividing
the total number of runs conceded by the total number of
wickets taken. The Team 2 Bowling Average is calculated by
adding the bowling average of all the players that are in
playing XI and dividing it by 11.
5. Team1 Economy
The bowler's bowling economy is calculated as dividing
the total number of runs conceded by the total number of overs
bowled. The Team 1 Bowling Economy is calculated by
adding the bowling economy of all the players that are in
playing XI and dividing it by 11.
6. Team2 Economy Figure 3 Architecture
The bowler's bowling economy is calculated as dividing This above architecture of our project shows that we
the total number of runs conceded by the total number of overs extracted the key features from the raw data and then split it into
bowled. The Team 2 Bowling Economy is calculated by a training dataset and testing dataset. The machine learning
adding the bowling economy of all the players that are in model then trained using the training dataset and tested using the
playing XI and dividing it by 11.l testing dataset. The model then predicts the match outcome.
B. Machine Learning model used B. Class Diagram
1. Decision Tree Regression
Decision Tree Regression is used to predict a class by
learning the decision rule from the features used to train the
model and it is a supervised machine learning algorithm.
2. Random Forest Regression
Random Forest Regression is capable of both
classification and regression tasks by using multiple decision
trees and using a technique of bagging.
3. Naive Bayes
Naive Bayes classifier is a probabilistic machine learning
model that is used for classification of the testing data given.
Naive Bayes finds the probability of events and based on this
it classifies the label.
4. Logistic Regression
Logistic regression is used when the label contains only
two values like happy or unhappy.
Figure 4 Class Diagram
WWW.IJASRET.COM 47|| Volume 5 || Issue 7 || July 2020 || ISSN (Online) 2456-0774
INTERNATIONAL JOURNAL OF ADVANCE SCIENTIFIC RESEARCH
AND ENGINEERING TRENDS
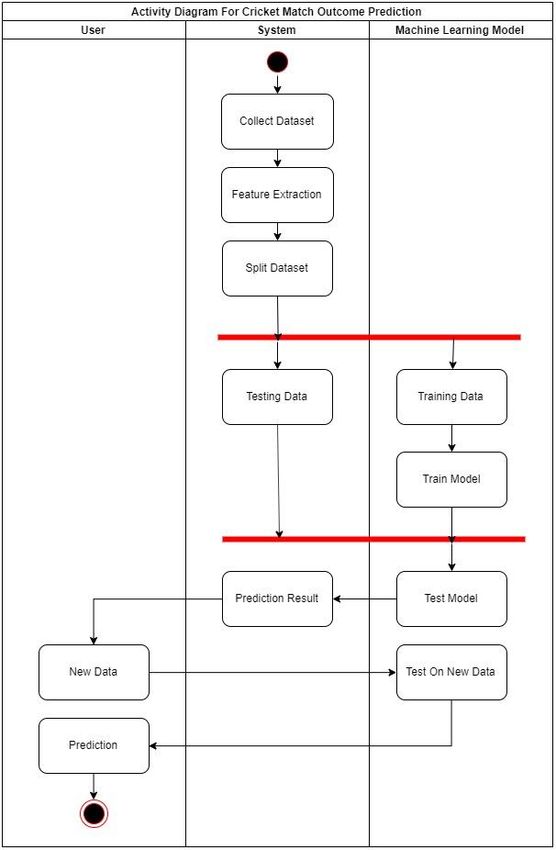
In the class diagram, there are 5 classes. The user has D. Activity Diagram
new data of match for prediction. The model can be trained and
tested using a dataset. Match dataset contains all the features and
labels. Match dataset is split into training and testing datasets.
C. Use Case Diagram
Figure 6 Activity diagram
E. Sequence Diagram
Figure 5 Use Case Diagram Figure 7 Sequence diagram
WWW.IJASRET.COM 48|| Volume 5 || Issue 7 || July 2020 || ISSN (Online) 2456-0774
INTERNATIONAL JOURNAL OF ADVANCE SCIENTIFIC RESEARCH
AND ENGINEERING TRENDS
IX TESTING
In testing, we have selected the 6 most important
As the above graph shows the prediction accuracy of
features for module 1 that given a prediction accuracy of 67%.
each module. We can see each module is giving more prediction
Then for module 2, we added one by one feature to these 6
accuracy
features selected for the first module. As we can see in the first
example we have added features team1 and team2 batting B. Module wise prediction accuracy
average to the 1st module's features and then again we calculated
the prediction accuracy. We got 70% accuracy 3% more than the
first module accuracy. So we selected these features for the
second module. In the second example, we have added features
team1 and team2 batting strike rate to the 1st module's features
and then again we calculated the prediction accuracy. We got
66% accuracy 1% less than the first module accuracy. So we
discarded these features for the second module. So like this, we
tested the accuracy of all the features and if they showed more
accuracy then we have selected them else all others are
discarded.
Figure 9 Module wise prediction accuracy
X RESULT
A. Prediction accuracy As the above table shows the prediction accuracy of
each module and how many features are used to feed the machine
learning model and how much machine learning models are used.
We can see each module is giving more prediction accuracy than
the previous module. We have selected 6 main key features for
the first module and only one machine learning algorithm that
given a prediction accuracy of 67%. Then for the second module,
we added one by one feature to this 6 features selected for the
first module and compared the prediction accuracy with the first
modules prediction accuracy, If we get the prediction accuracy
greater than the first module then we keep the feature for the
module 2 else we discard the feature.
XI CONCLUSION AND FUTURE WORK
In this paper, we selected 17 key features and 6 machine
learning models that give the best possible prediction accuracy.
As we can see in the below table all the papers are using a
different number of features and different machine learning
algorithms. Also, they are targeting different cricket formats.
Some papers have only discussed features whereas some papers
have discussed which machine learning algorithm will be best.
The lowest accuracy is of [3] which is 63.05% and the highest
accuracy is of [8] which is 85%. So we analyzed every paper and
found all the key factors that increased prediction accuracy and
algorithms that predicted with the best accuracy. The highest
prediction accuracy is 85% and in our paper, we are getting an
Figure 8 Prediction accuracy in percentage accuracy of nearly 90%. By using this model we are going to
predict the outcome of twenty 20 matches, one-day international
WWW.IJASRET.COM 49|| Volume 5 || Issue 7 || July 2020 || ISSN (Online) 2456-0774
INTERNATIONAL JOURNAL OF ADVANCE SCIENTIFIC RESEARCH
AND ENGINEERING TRENDS
matches, and test matches also. This model can be used for “Cricket score and winning prediction using data mining”,
predicting the outcome of other sports also like football, hockey, International Journal of Advance Research and Development,
tennis, baseball, rugby, etc. Volume: 3 Issue: 3 (2018)
[7] Raza Ul Mustafa, M. Saqib Nawaz, M. Ikram Ullah Lali,
Tehseen Zia, Waqar Mehmood, “Predicting The Cricket Match
Outcome Using Crowd Opinions On Social Networks: A
Comparative Study Of Machine Learning Methods”, Malaysian
Journal of Computer Science, Volume: 30(1) (2017)
[8] Muhammad Yasir, LI CHEN, Sabir Ali Shah, Khalid Akbar,
M.Umer Sarwar, “Ongoing Match Prediction in T20
International”, International Journal of Computer Science and
Network Security, Volume: 17 Number: 11 (November 2017)
[9] A.N.Wickramasinghe, Roshan D.Yapa, “Cricket Match
Outcome Prediction Using Tweets and Prediction of the Man of
the Match using Social Network Analysis: Case Study Using IPL
Data”, International Conference on Advances in ICT for
Figure 10 Accuracy of all papers Emerging Regions, ICTer: 442 (2018)
REFERENCES [10] Ayush Kalla, Nihar Karle, Sushant Wagle, Sandeep Utala,
[1] Rabindra Lamsal and Ayesha Choudhary, “Predicting “AutoPlay - Cricket Score Predictor”, International Journal of
Outcome of Indian Premier League (IPL) Matches Using Engineering Science and Computing, Volume: 8 Issue: 4 (April
Machine Learning”, arXiv:1809.09813 [stat.AP] (September 2018)
2018)
[11] Kaluarachchi, Amal, and S. Varde Aparna. ”CricAI: A
[2] Abhishek Naik, Shivanee Pawar, Minakshee Naik, Sahil classification based tool to predict the outcome in ODI cricket.”
Mulani, “Winning Prediction Analysis in One-Day-International 2010 Fifth International Conference on Information and
(ODI) Cricket Using Machine Learning Techniques”, Automation for Sustainability. IEEE, 2010
International Journal of Emerging Technology and Computer
[12] Pedregosa, Fabian, et al. ”Scikit-learn: Machine learning in
Science, Volume: 3 Issue: 2 (April 2018)
Python.” Journal of Machine Learning Research 12.Oct (2011):
[3] Arjun Singhvi, Ashish Shenoy, Shruthi Racha and Srinivas 2825-2830.
Tunuguntla. “Prediction of the outcome of a Twenty-20 Cricket
[13] Sankaranarayanan, Vignesh Veppur, Junaed Sattar, and Laks
Match.” (2015).
VS Lakshmanan. ”Auto-play: A Data Mining Approach to ODI
[4] Swetha, Saravanan.KN, “Analysis on Attributes Deciding Cricket Simulation and Prediction.” SDM. 2014
Cricket Winning”, International Research Journal of Engineering
and Technology (IRJET), Volume: 04 Issue: 03 | (March 2017)
[5] Geddam Jaishankar Harshit, Rajkumar S, “A Review Paper
on Cricket Predictions Using Various Machine Learning
Algorithms and Comparisons among Them”, International
Journal for Research in Applied Science & Engineering
Technology (IJRASET), IJRASET17099 (April 2018)
[6] Akhil Nimmagadda, Nidamanuri Venkata Kalyan,
Manigandla Venkatesh, Nuthi Naga Sai Teja, Chavali Gopi Raju,
WWW.IJASRET.COM 50You can also read