THE ANALYSIS OF THE SEISMIC SEQUENCE STARTED ON NOVEMBER 22, 2014 BASED ON ETAS MODEL
←
→
Page content transcription
If your browser does not render page correctly, please read the page content below
Romanian Reports in Physics 73, 708 (2021)

        THE ANALYSIS OF THE SEISMIC SEQUENCE STARTED ON
             NOVEMBER 22, 2014 BASED ON ETAS MODEL

             C. GHITA1, M. DIACONESCU1, R. RAICU2, I. A. MOLDOVAN1, G. ROSU2
1
    National Institute for Earth Physics, 12 Calugareni Street, Magurele 077125, Ilfov District, Romania
                   E-mails: cristi.ghita@infp.ro; diac@infp.ro; irenutza_67@yahoo.com
          2
            Military Technical Academy “Ferdinand I”, 39-49 George Coșbuc Blvd, 5th District,
                                             Bucharest, Romania
                                        Received August 30, 2020

                  Abstract. The purpose of this study consists in the analyses of ETAS
          (Epidemic-Type Aftershock Sequence) parameters for the sequence recorded on
          November 22nd, 2014 in Marasesti area. The main shock of the sequence, a moderate-
          size earthquake with ML = 5.7, at 40.9 km depth, is the largest crustal event
          instrumentally recorded at the bending of the Eastern Carpathians. The ETAS model
          parameters for the Marasesti area were estimated using the seismic events from the
          Romplus catalogue, between January 1, 2010 (00:00:00) and November 17, 2017
          (00:00:00), with magnitude between 1.2 < Mw < 5.4 and depth 0.6 < h < 70 km. The
          estimated model is applied further on an independent data set recorded in the same
          area, for automatic identification of Marasesti sequences using the residual analysis
          techniques. The studied model encourages research for evaluation of the real-time
          probability earthquake occurrence and sustains the international initiatives such as the
          Operational Earthquake Forecast (OEF)

                  Key words: ETAS model, crustal seismicity.

                                          1. INTRODUCTION

       The crustal seismicity in front of the Carpathian Bend is distributed to the
East, in a band delimited by the Peceneaga-Camena fault [1, 2], to North and East,
and to the South and it is lost to the Intramoesica fault. Seismic activity is usually
characterized by groupings in space and time, in Ramnicu Sarat subareas through
seismic sequences and seismic swarms in the Vrancioaia area [3, 4]. The crustal
seismicity has never exceeded the magnitude Mw = 5.9, for a historical earthquake
(March 1, 1894) [5] and seems to be independent to the seismic activity in the
subducted lithosphere. The major shock of the Marasesti sequence, from November
22, 2014, at 19:14, local time (ML = 5.7, MW = 5.4 and h = 40.9 km,) is the largest
event recorded in the area, during the instrumental period [6].
       The present study is an analysis of the ETAS model applied on the seismic
sequence recorded from November 22, 2014 to February 1, 2015 in Marasesti
region, between latitude 45.7 N – 46.2 N and longitude 26.8 E – 27.4 E, with local
Article no. 708                           C. Ghita et al.                                        2

magnitude 0.1 < ML < 5.7, and depth range 0< h
3 Analyses of a seismic sequence based on ETAS model Article no. 708
The b-value parameter of the Frequency Magnitude Distribution FMD is
around 1.2 and indicates the stress concentration of the region during the seismic
swarm period [9]. Figure 1 also shows the FMD. There is a sudden increase in the
number of events in a short time from the beginning of the studied sequence. Thus,
in the first 4 days, 150 events were registered out of a total of 222 events on the
entire sequence. Starting with day 5 the sequence evolution was in accordance with
Omori law [10], characterised by the p parameter. The results from Fig. 1 are
synthesized in Table 1.
Table 1
Marasesti sequence recorded on November 22, 2014- estimation values
Estimation values MBS GFT (90%)
Mc Completeness Magnitude 1.5000 1.6000
b value 1.2647 1.3842
Standard deviation of the b value 0.974E-01 0.134E+00
Many studies revealed significant variation in p and b value in different
tectonic regions, well correlated with regions under high stress or low crustal
heterogeneity, as predicted in laboratory studies [11]. The aftershocks decay rate is
measured by the Omori p parameter, with a variation value from 0.9 to 1.5 that can
be related to the structural heterogeneity, the stress and crust temperature [12, 13].
The ETAS Epidemic type aftershock sequences model have been used in
analyses of the local and regional catalogue [14, 15, 16]. In general, ETAS TM is a
stochastic point process of particular relevance for modelling coseismic stress-
triggered aftershock sequences model. The ETAS model is useful for summarizing
patterns of seismicity
In the estimation ETAS -TM we used SEDAv.1 program [17, 18, 19]. We
chose that the learning period in the coordinate grid Lat (45.45, 46. 20) and Long
(26.80, 27.48) (Fig. 2) should contain seismic events recorded from the Romplus
catalogue between November 21, 2014 (00:00:00) and 01 February 2016 (00:00:00),
with magnitude in the range 1.2 < Mw < 5.4.
The number of events in the total range of the sequence is 222. The number
of rolls is limited to NRUN = 100. The following data are obtained from the rolls:
The values of the 5 parameters of the TM model (Fig. 3), for each of the
100 runs of the Simulated Annealing (SA) algorithm;
The value of the Log-Likelihood function (LOG LIK) for each run (Fig. 4);
The expected number of events (EXP NEV) from the target period for each
run (Fig. 4);
The observed number of events (OBS NEV) in the target period for each run;
The optimal values of the parameters of the TM model, for which the
maximum value of the Log-Likelihood function is obtained.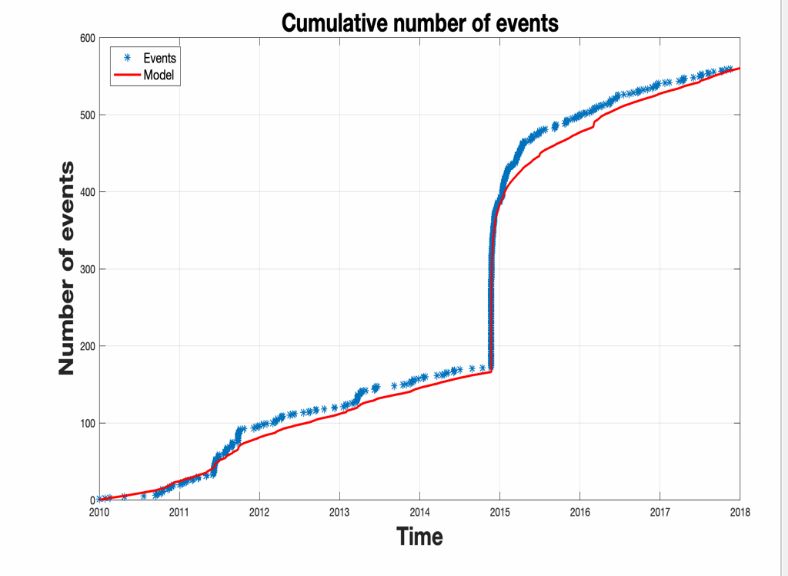
Article no. 708                               C. Ghita et al.                                         4

Fig. 2 – On the left side is presented the seismic sequence recorded at Marasesti with ML = 5.7, in the
   right side it is presented before the sequence recorded at Marasesti, where the ETAS model was
         applied for the area delimited by the red rectangle [26.80E-27.48E,45.45N-46.20N].

      Table 2 shows the results regarding the optimal values of the model parameter
ETAS TM – (LOG LIK, EXP NEV, OBS NEV) as well as the value of the median
and the confidence interval limits of 95%.

                                               Table 2
            TM ETAS parameters for the Marasesti sequences of the parameters resulting
                        from the 100 runs with 95% confidence bounds
                                                                      Confidence interval limits
          Parameter         Optimal value Median value of runs
                                                                                 95%
      µ (event/day/km2)       1.65e-03             1.56e-03              (1.40e-03, 2.16e-03)
               k              2.62e-02             2.92e-02              (2.25e-02, 3.24e-02)
               p              1.45e+00             1.47e+00             (1.41e+00, 1.49e+00)
           c (days)           7.76e-02             8.36e-02              (6.31e-02, 9.16e-02)
       α (1/magnitude)        1.57e+00             1.54e+00             (1.50e+00, 1.61e+00)
          LOG LIK           5.21256e+02          5.21138e+02        (5.20698e+02, 5.21250e+02)
          EXP NEV                222                  224                     (223, 224)
          OBS NEV                222                  222                        224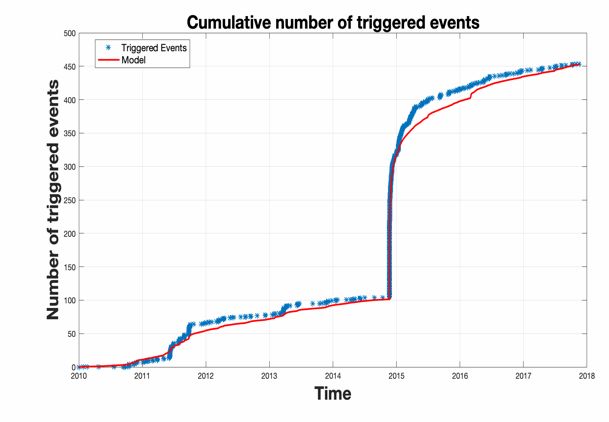
5 Analyses of a seismic sequence based on ETAS model Article no. 708
Fig. 3 – Distributions of TM model parameter values after 100 runs.
The parameter μ (shocks / day) is related to the background seismic activity.
The parameter k (shocks / day) is part of the parameter Ki
Ki ke ( M i M co ) , (1)
which depends on the shock magnitude Mi and the cut off magnitude, Mco.
The parameter α (magnitude–1) indicates the capacity to generate aftershocks
of an earthquake with a magnitude higher than the threshold value. A subunit value
of α indicates a group of seismic events occurring in a relatively short time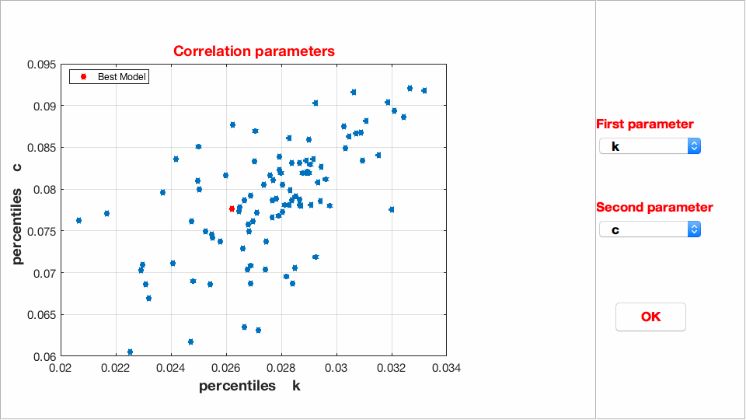
Article no. 708                            C. Ghita et al.                              6

(earthquake swarms). In the case of seismic activity characterized by a main shock
followed by aftershocks, the value of α is over 1.5.

           Fig. 4 – LOG LIK and EXP NEV parameter value distributions after 100 runs.

       The p parameter (dimensionless) represents the rate of decrease of the number of
replicas and is considered to reflect geophysical effects specific to the analysed region.
       The value of the µ parameter 1.65e-03 indicates a low background seismic
activity and the value of the parameter α 1.57 indicates a clear connection between
a main event and a series of aftershocks.
       Based on the data sets obtained from the 100 runs, the correlation graphs
(Fig. 5) can be drawn between all the pairs of parameters {µ, k, p, c, α} of the TM
model. There are clearly positive correlations between the sizes in the set {k, p, c}
and clearly negative between the parameter α and the sizes in the set.

                    Fig. 5 – Correlation graphs between TM model parameters.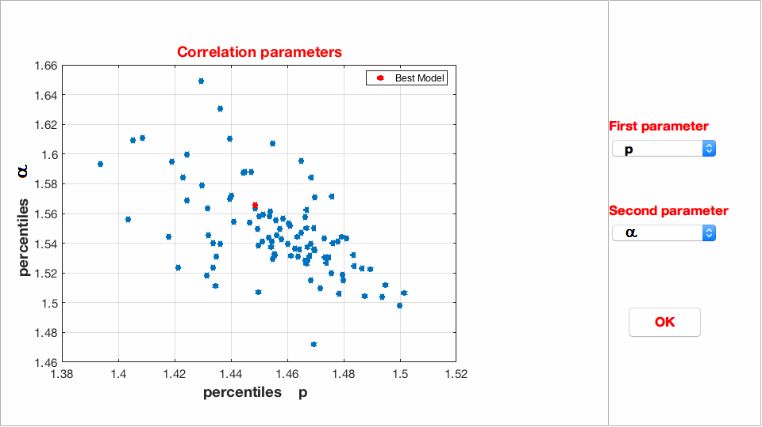
7 Analyses of a seismic sequence based on ETAS model Article no. 708
The TM model can be tested by running the residual analysis or testing the
number of events.
3. RESIDUAL ANALYSIS
In estimating the ETAS – TM model and the seismic residual, we chose the
learning period of the algorithm on the localized seismic events with Lat 45.705N –
46.180N and Long 26.800E – 27.300E coordinates.
Seismic events recorded from the Romplus catalogue are used between
January 1, 2010 (00:00:00) – November 17, 2017 (00:00:00), with magnitude between
1.2 < Mw < 5.4 and depth 0.6 < h < 70 km.
The analysis of the residual seismic activity, proposed by [14] starts from the
epidemic model, which assumes that each shock / seismic event has its own aftershock
generated with a stochastic frequency proportional to its magnitude. The general
seismic activity model assumes that the seismic data from the initial moment is
produced with the rate λ(t). The integral of the rate of event production according
to time ti is calculated:
ti t1
k e ( M J Mc )
i ( s ) ds ti ds. (2)
0 0 ti ti
( s t j c) p
The time scale is modified by integrating the event production rate, realizing
the biunivocal transformation of time moments {ti} into the sequence {τi} and having
a distribution according to a standard stationary Poisson process.
If there are differences between the seismic activity and the associated model,
estimated by a standard stationary Poisson process, specific characteristics of the data
set that are not included in the initial model are detected. By this method [14], there
were detected periods of inconsistency with the Poisson model, characterized by
rates of production of events below the expected rate, called periods of seismic calm,
detected immediately before the production of major shocks or strong replicates of a
main shock.
In testing the model by residual analysis, the SEDAv.1 program was used,
using the method [17] and verifies the Poisson distribution hypothesis of the residual
through two tests:
– the RUNS test verifies that there is a temporal tendency in the periods between
events detected in the variables associated with the transformed time moments {τi};
– the Kolmogorov-Smirnov (1) test applied to a sample, which determines
whether the time variables transformed {τi} in the periods between events follow
an exponential distribution [20]
The value of the exponent p resulting from the RUNS test is p = 0.0225, and
that given by the Kolmogorov-Smirnov test is p = 0.56 (Table 3).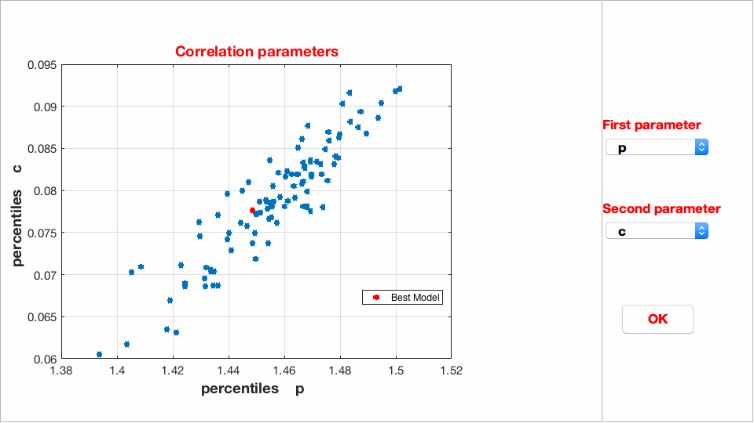
Article no. 708                              C. Ghita et al.                                         8

                                               Table 3
    The ETAS parameters – TM-technique was applied for the area delimited by the red rectangle
    [26.80E-27.48E,45.45N-46.20N] in period January 1, 2010 (00:00:00) – November 17, 2017
          (00:00:00), with magnitude between 1.2 < Mw < 5.4 and depth 0.6 < h < 70 km

     Parameter          Optimal value      Median value of runs     Confidence interval limits 95%
         µ                3.61 e-02             3.52e-02                  (2.93e-02, 3.85e-02)
         k                6.29 e-03             6.88 e-03                   (5.94-03, 7.3-02)
         p                   1.07               1.07+00                  (1.06e+00, 1.08e+00)
         c                2.42 e-02             2.49e-02                 (5.82 e-03, 2.91e-02)
         α                1.96 e+00            1.94 e+00                 (1.54e-04, 1.98e+00)
     LOG LIK            –3.32404 e+02        –3.32597 e+02           (–4.0957e+02, –3.32409+02)
     EXP NEV                 560                   562                            562
     OBS NEV                 559                   559                            559

        Residual analysis for the Marasesti sequence – illustrated in Fig. 6 shows no major
inconsistencies regarding the background activity compared to the statistical model, the
data is recorded in the period 2010–2018 for the total number of events 559 events.

                   a)                                                  b)

                                                 c)
    Fig. 6 – (Color online) Residual analysis for the Marasesti sequence: a) cumulative number of
     events; b) cumulative plot of observed events (blue points) in the Marasesti region, together
         with the expected cumulative distributions (red line); c) number of triggered events.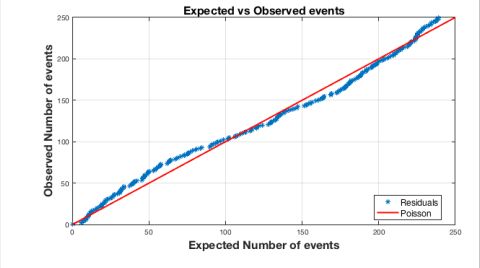
9 Analyses of a seismic sequence based on ETAS model Article no. 708
The comparative results between the data provided by the model (estimated)
and the observed ones are given in Table 4. We observe close values between the
total number of expected and estimated events, both for the events belonging to the
background seismic activity and for the triggered ones.
Table 4
Residuals Analysis
Expected number of Observed number of
events events
Total number of the events 559.95 559
Expected number of background events 105.6 105
Observed number of triggered events 248.6111 247.7894
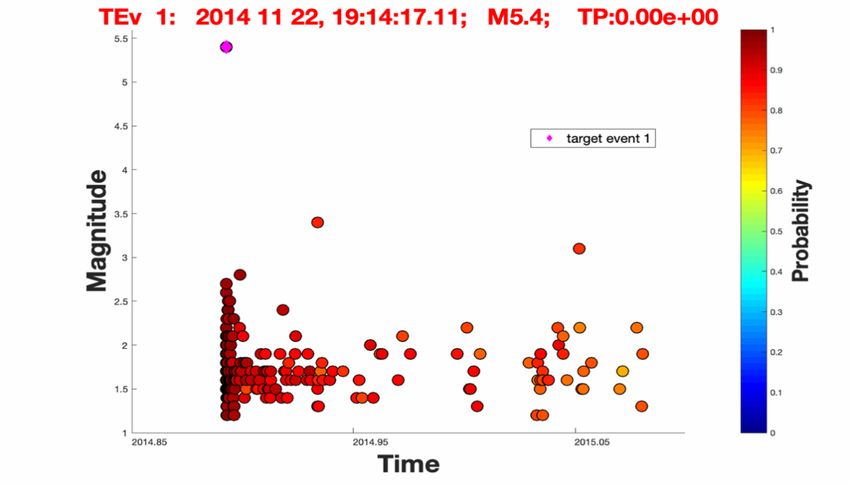
4. IDENTIFICATION OF A SEISMIC SEQUENCE
Seismic sequence identification is one of the main objectives of this paper
and is graphically presented in Fig. 7.
For the identification of the seismic sequence from Marasesti from November 22,
2014 were used the test parameters from the ETAS applied on the Romplus
catalogue presented in Table 2.
Statistical parameters were calculated for the coordinates Lat (45.705, 46. 180)N
and Long (26.800, 27.300)E.
The test was successfully recorded with threshold probability of 0.95% (PL).
Fig. 7 – Identification of Marasesti sequence on November 22, 2014.
The figure shows the time-magnitude plot of the identified events.Article no. 708 C. Ghita et al. 10
A stochastic model was used after [20] and implemented in SEDAv1.0. The
model for the Marasesti crustal area was obtained by using NRUNS-type statistical
tests after [21] associated with a threshold probability PL in detecting the occurrence
of a running sequence seismic events from the Romplus catalogue.
5. RESULTS AND DISCUSSIONS
To identify Marasesti seismic sequences with a stochastic method we applied
the tests on a set of 559 crustal events. These tests were validated with a threshold
probability PL > 95% as seen in Fig. 7.
The distribution of b reveals a high concentration of stress, b value 1.2 was
used to perform the GFT 90% (Goodness-of-fit test), including seismic swarm.
The main objective of this paper was materialized by the creation of an
ETAS catalogue with the calculation parameters specific to the location surface of
the seismic events related to the Marasesti sequence on November 22, 2014.
The achievement of this objective encourages further research for increasing
the sequence ETAS database in Romania by modelling the statistical algorithms
that use the background seismicity in order to estimate the main shock of a seismic
sequence correlated with precursors in general.
Thus, in a time-dependent forecast, the probabilities P(t) depend on the
information I(t) available at time t when the forecast is made.
The most useful information for operational forecasting comes from seismic
catalogues and the geological history of surface ruptures.
The application of these modern calculation techniques by stochastic methods
is of major importance for estimating regional and local seismic hazard.
Acknowledgements. The study was supported by the projects: Nucleu Program MULTIRISC
Project PN19080102, supported by MCI and Phenomenal Project PN-III-P2-2.1-PED-2019-1693,
480PED/2020 supported by UEFISCDI. This work has also received funding from the European
Union’s Horizon 2020 Research and Innovation Program under Grant Agreement No 821046.
REFERENCES
1. M. Diaconescu, A.Craiu, D. Toma-Danila., G.M.Craiu, and C. Ghita, Main active faults from the
eastern part of Romania (Dobrogea and Black Se), Part I: Longitudinal and faults system, Rom.
Rep. Phys. 71 (1), 702 (2019).
2. M. Diaconescu, A.Craiu, I.A. Moldovan, E.G. Constantinescu, and C. Ghita, Main active faults
from eastern part of Romania (Dobrogea and Black Sea). Part II: Transversal and oblique faults
system, Rom. Rep. Phys. 71 (2), 708 (2019).
3. E. Popescu and M. Radulian, Râmnicu Sărat (Romania) seismic sequence of December 6-8, 1997:
source time function and scaling relations of the earthquake parameters, Rom. J. Phys. 46, 515–530
(2001).
4. E. Popescu and M. Radulian, Source parameters for the earthquake sequence occurred in the
Ramnicu Sarat area (Romania) in November-December 2007, Rom. J. Phys. 56, 265–278 (2011).11 Analyses of a seismic sequence based on ETAS model Article no. 708
5. A.P. Constantin, I.A. Moldovan, A. Craiu, M. Radulian, and C. Ionescu, Macroseismic intensity
investigation of the November 2014, M=5,7 Vrancea (Romania) crustal earthquake, Annals of
Geophysics 59, 5 (2016).
6. A. Craiu, C. Ghita, M. Craiu, M. Diaconescu, M. Mihai, and L. Ardeleanu, The source
mechanism of the seismic event during the sequence of the moderate size crustal earthquake of
November 2, 2014 Vrancea Region Romania, Annals of Geophysics 61 (6), 666 (2018).
7. S. Wiemer and M. Wyss, Minimum magnitude of complete reporting in earthquake catalogues:
examples from Alaska, the Western United States, and Japan, Bull. Seism. Soc. Am. 90, 859–869
(2000).
8. A. Cao and S. Gao, Temporal variation of seismic b-values beneath North-Eastern Japan island
arc, Geophys. Res. Lett. 29 (9), 48.1–48.3 (2002).
9. C. Ghita, M. Diaconescu, I. A. Moldovan, E. Oros, E.G. Constantinescu, Spatial and temporal
variation of seismic b-value beneath Danubian and Hateg-Strei seismogenic area, Rom. Rep. Phys.
72(1), 704 (2020).
10. B. Enescu, D. Enescu, and K. Ito, Values of b and p: their variations and relation to physical
processes for earthquakes in Japan and Romania, Rom. J. Phys. 56, 590–610 (2011).
11. E. Popescu, B. Grecu, M. Popa, M. Rizescu, and M. Radulian, Seismic source properties
indications of lithosphere irregular structure on depth beneath Vrancea region, Rom. Rep. Phys.
55, 303–321 (2003).
12. T. Utsu, Y. Ogata, and R.S Matsuura., The centenary of the Omori formula for a decay law of
aftershock activity, J. Phys. Earth 43, 1–33 (1995).
13. K. Ito and B.D. Enescu, Heterogeneous structure and b and p values relating to the rupture of the
2000 Tottori-Ken Seibu earthquake, Proceedings of the International Symposium on Slip and
Flow Processes in and below the Seismogenic Region, Sendai, Japan 78(1) 78–6 (2001).
14. Y. Ogata, Statistical Models for Earthquake Occurrences and Residual Analysis for Point
Processes, J. Amer. Statist. Assoc. 83, 9–27 (1988).
15. Y. Ogata, Space-Time Point-Process models for Earthquake Occurrences, Ann. Inst. Stat. Math.
50, 379–402 (1988).
16. Y. Ogata, ISM Computer Science Monographs, The Institute of Statistical Mathematics 33, 423
(2006).
17. A.M. Lombardi, Some reasoning on the RELM-CSEP Likelihood-Based Tests, Earth Planets
Space 66, 4 (2014).
18. A.M. Lombardi, Estimation of the parameters of ETAS models by Simulated Annealing, Sc. Rep.
Nature Publishing Group 5, 8417 (2015).
19. A.M. Lombardi, SEDA a software package for the Statistical Earthquake Data Analysis: a tutorial
application to the 2009 L’Aquila and the 2012 Emilia (Italia) sequences, Annals of Geophysics
60, SO216 (2017).
20. A.M. Lombardi, W. Marzocchi, Evidence of clustering and nonstationarity in the time distribution
of large worldwide earthquakes, Journal of Geophysical Research 112, 209–225 (2007).
21. J. Zhuang, Y. Ogata, and D. Vere-Jones, Analyzing earthquake clustering features by using
stochastic reconstruction, Journal of Geophysical Research 109, 1–17 (2004).You can also read