CanopyTO - IE11.1 - Attachment 1 - City of Toronto
←
→
Page content transcription
If your browser does not render page correctly, please read the page content below
IE11.1 - Attachment 1

         CanopyTO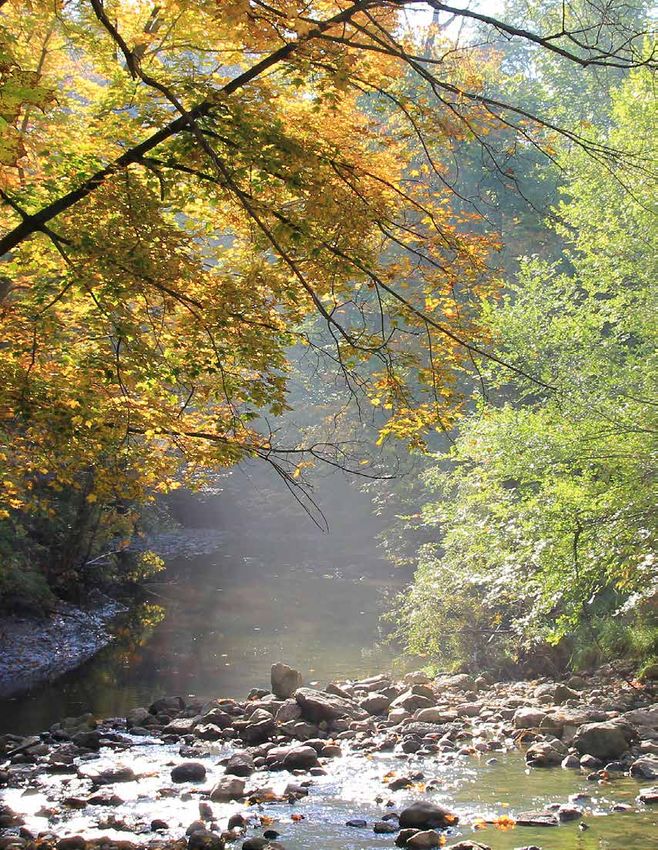
Page 2 | CanopyTO
SUMMARY OF FINDINGS
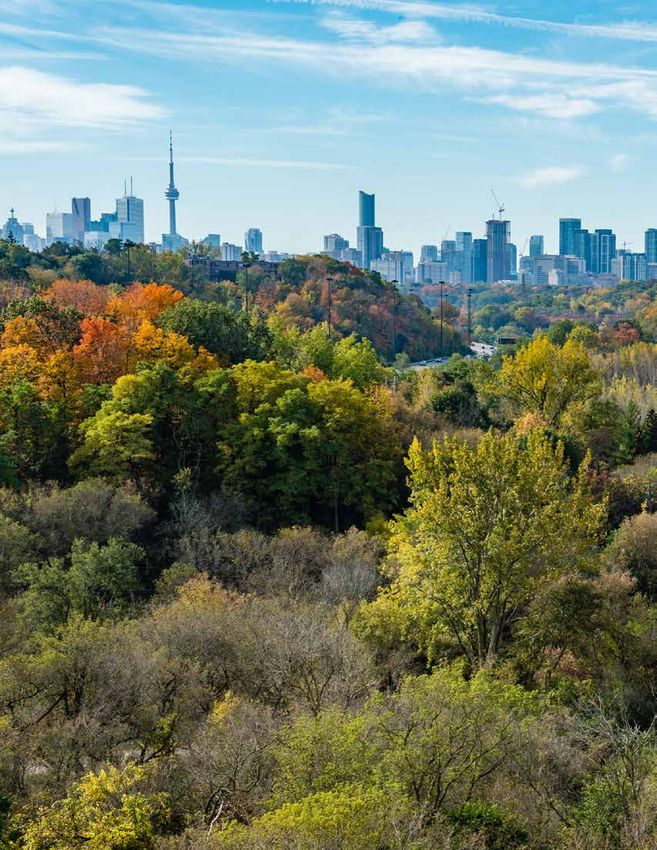
Toronto’s canopy cover and total tree population has
increased over the last 10 years.
Toronto’s canopy cover increased from 26.6% to 28.4%
between 2008 and 2018. The City’s tree population
increased from 10.2 million to 11.5 million trees.
Street trees are making a signifcant contribution
to the urban forest.
The condition of street trees has improved significantly,
with a 25% increase in trees rated as good or excellent.
While representing only 5.4% of Toronto’s urban forest,
street trees provide 19.4% of the total structural value.
The composition and condition of the urban forest has seen
positive and negative changes.
The distribution of trees by size class improved with more
larger-growing trees and more young trees. The overall
condition rating of trees and shrubs has declined. Invasive
species have increased in the city’s parks and ravines.
Impervious land cover is increasing across the city.
Impervious land cover has increased by 1.4% since 2008.
Plantable space across the city has decreased by 2%
while nonplantable space increased by 3%. The most
land area converted from pervious to impervious is on
Single Family Residential lands.
CanopyTO | Page 3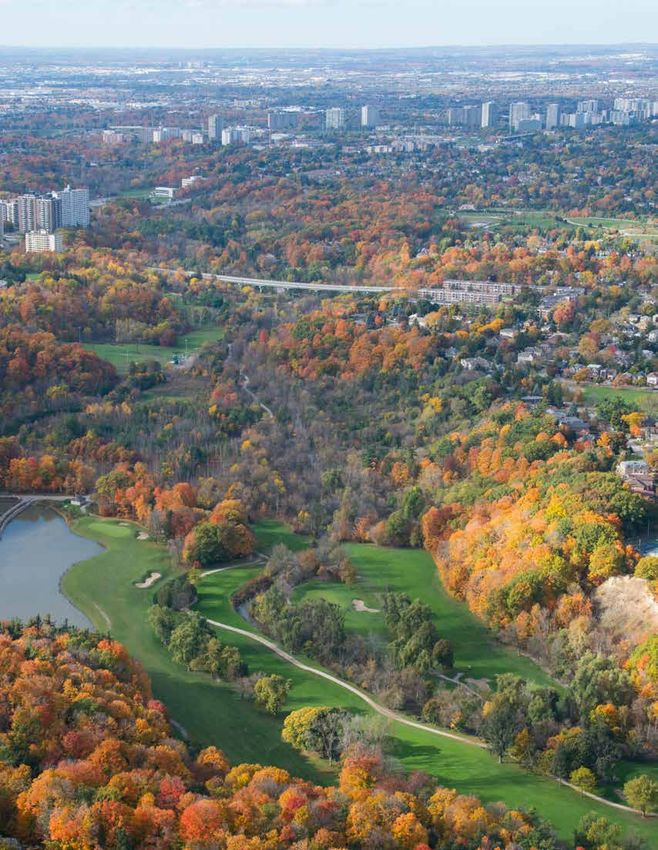
PURPOSE OF THE                                       USING THE RESULTS
2018 TREE CANOPY STUDY                               Much like the findings from the first canopy
In order to monitor changes in the structure         assessment informed the first Strategic Forest
and function of the urban forest, the City’s         Management Plan, findings from the 2018 Tree
Strategic Forest Management Plan 2012-2022           Canopy Study will help the City make evidence-
recommended that a canopy assessment be              based decisions in the development of the next
undertaken every 10 years. The 2018 Tree             Strategic Forest Management Plan, due in 2023.
Canopy Study presents an update to the first         Using methodologies established by Canadian
canopy assessment initiated in 2008 and              and international jurisdictions, studies of this
described in Every Tree Counts: A Portrait of        kind are an important part of the adaptive
Toronto’s Urban Forest.                              management cycle. The Strategic Forest
The purpose of this 2018 Tree Canopy Study           Management Plan recommended that canopy
is to:                                               assessments be undertaken every 10 years in
                                                     order to understand and respond to changes in
    • Update information on the current              the urban forest.
      composition, structure and distribution
      of Toronto’s urban forest                      The 2018 Tree Canopy Study provides an update
                                                     on the current state of the urban forest and how
    • Quantify the ecological services and           it has changed from the previous assessment.
      benefits provided by the urban forest          The study’s findings will be used to inform the
                                                     development of future strategic directions and
    • Identify opportunities for increasing          priority actions necessary to support a healthy,
      sustainable tree cover                         resilient urban forest. Findings presented in the
    • Compare and evaluate current conditions        2018 Tree Canopy Study will also help inform the
      to the baseline conditions                     implementation of the Ravine Strategy and the
                                                     Biodiversity Strategy.

SCOPE OF THE
2018 TREE CANOPY STUDY
The 2018 Tree Canopy Study provides a snapshot
of current conditions, measures changes since
the last canopy assessment and identifies issues
and trends affecting the urban forest. It provides
data on the extent, size class, composition and
condition of the urban forest. It also provides
information about the amount and dollar value
of several key ecological services provided by the
urban forest.

                                                                                         CanopyTO | Page 5
CRIME
                                                                                         REDUCTION

                                                                     FOOD
                                                                  PRODUCTION

                                        BEAUTIFICATION                                            CONNECTIONS
                                          AND SENSE                                                   TO
                                           OF PLACE                                                 NATURE
                                                                    RAINFALL
                                                                  INTERCEPTION

                         AIR
                    PURIFICATION                                                        HEALTH
                                                                                          AND
                                                                                        HEALING
                                                NOISE                                                    CONCENTRATION
                                              MITIGATION                                                      AND
                                                                       BUILDING                            LEARNING
                                                                        ENERGY
                                                                       SAVINGS

                                                                                           EVAPO-
                                   WILDLIFE
                                                                                        TRANSPIRATION
                                   HABITAT

                                                         SHADE
                                                          AND
                                                        COOLING
                                                                               SOCIAL
                                                                           STRENGTHENING                 RECREATION

                                              HEALTHY                        NUTRIENT
                                                SOIL                          CYCLING                      WATER
                                                                                                          STORAGE

                                                          IMPROVED                     CARBON
                                                        INFILTRATION                SEQUESTRATION

BENEFITS OF TREES
Page 6 | CanopyTO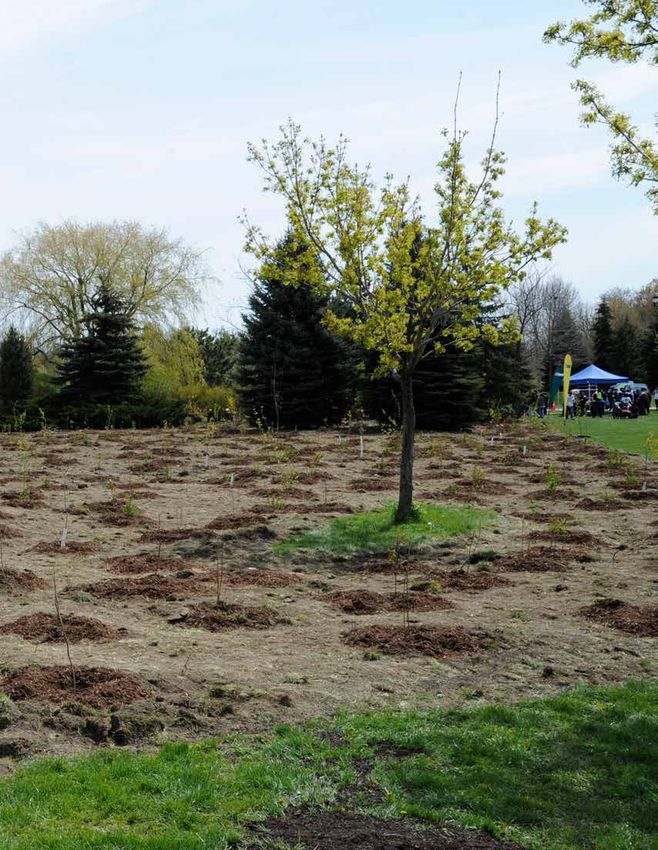
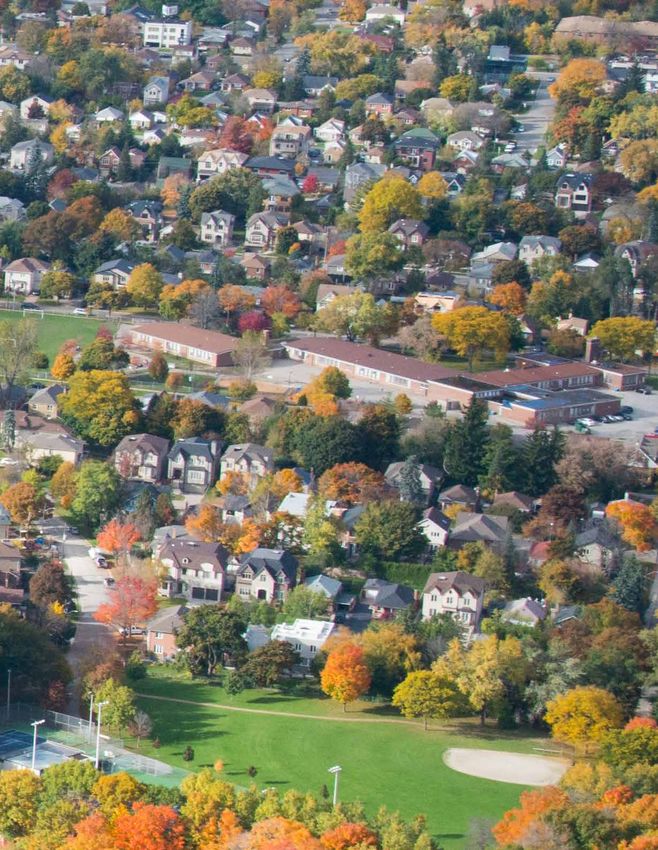
Toronto’s canopy cover and total tree population has
                      increased over the last 10 years.

• In 2018, Toronto’s tree canopy cover is           • Unlike grey infrastructure, the urban forest is
  estimated at 28.4% to 31%, an increase              always changing, growing, maturing and dying.
  from the 2008 canopy cover estimate of              Canopy cover and population size are not the
  26.6% to 28%.                                       whole story. Urban forest size, condition and
  o 28.4% was derived from a random point             distribution are factors in the canopy cover
    sampling method using leaf-on satellite           story; pest threats, natural mortality, invasive
    imagery; 31% was derived from an                  species impacts, development activities and
    automated land cover classification process       climate change are realities effecting urban
    using the same leaf-on satellite imagery.         forest sustainability.
  o Canopy cover increased despite serious
    impacts due to increased development,
    the 2013 ice storm and the effects of the                      Canopy cover is the area of the tree
    Emerald ash borer.                                             population as viewed from above.
• Toronto’s tree population increased from 10.2
  to 11.5 million trees between 2008 and 2018.                     Leaf area is the total surface area of
  o Although the total population increased,                       the living leaves.
    the total leaf area decreased by about 11%
    which impacts the structural value and the                     Greater leaf area = greater benefits
    value of ecosystem services.

FIGURE 1: Canopy Cover Change in Toronto between 2008 and 2018         Random point sampling method
                                                                       is best for reliable estimates and
                                                       2018            change assessments.

                                                      28.4%            Automated land cover classification
                                        2008                           is best for mapping spatial extent
                                                                       and distribution.
                                       26.6%

                                     10.2 million   11.5 million

                                                                                           CanopyTO | Page 7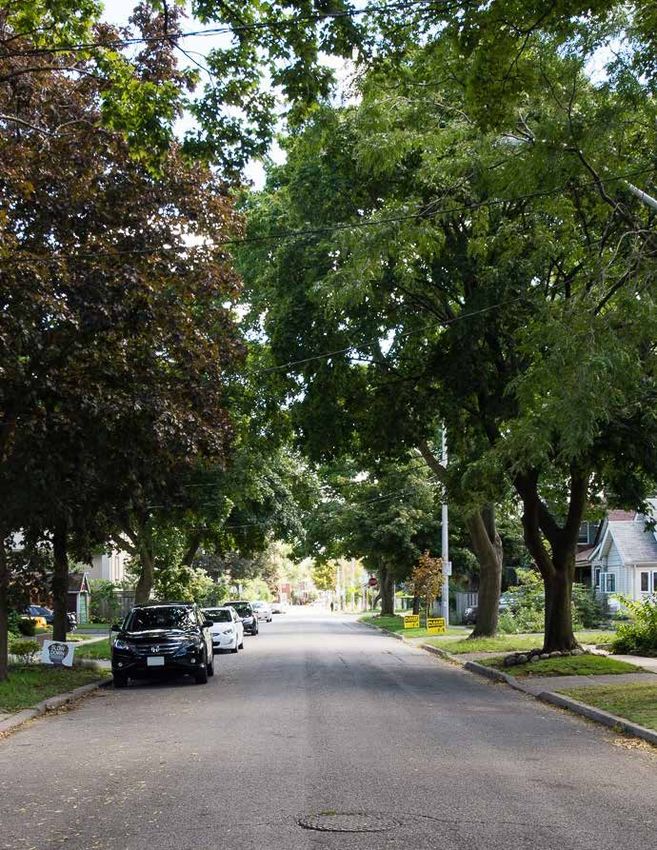
FIGURE 2: Tree Cover Distribution in the City of Toronto

• The structural value of the urban forest was             FIGURE 2: Annual Ecosystem Services Provided
  relatively unchanged since 2008, dipping                           by Toronto’s Urban Forest
  slightly from $7.1billion to $7.04 billion.
   o This change can be attributed to the
     decrease in total leaf area and tree
                                                                           $8.2 Million
                                                                           ENERGY SAVINGS
     condition rating, both of which negatively
     affect structural value and the value of
     some key ecosystem services.
                                                                           $4.0 Million
                                                                           GROSS CARBON SEQUESTRATION

                                                                           $37.6 Million
                                                                           POLLUTION REMOVAL

                                                                           $4.8 Million
                                                                           AVOIDED RUNOFF

                                                                           $55.0 Million
                                                                           TOTAL ANNUAL BENEFITS

Page 8 | CanopyTO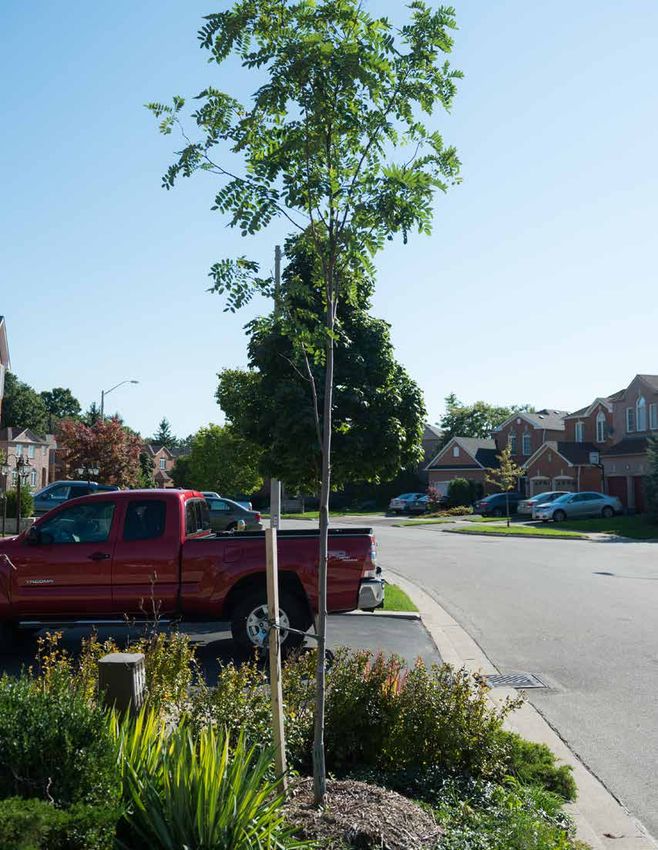
Street trees are making a signifcant contribution
                            to the urban forest.

• Street trees are trees planted within the                • Street trees contribute almost 19.4% of the
  City road allowance, in turf or specialized                structural value of the urban forest while
  planting beds.                                             making up only 5.4% of the population.
• Street tree condition has improved significantly,          o Street trees provide $1.363 billion of the
  with a 25% increase in trees rated as good or                total structural value of the urban forest,
  excellent.                                                   estimated at $7.04 billion.
  o This improvement can be attributed                       o Street trees provide $1.277 million annually
    to species selection, stock quality,                       in ecosystem services including almost 30%
    and proactive and newly planted tree                       of the total urban forest value associated
    maintenance activities.                                    with avoided runoff.
  o Proactive tree maintenance has reduced                   o The proportion of large trees (those with
    vulnerability to pests and diseases,                       diameters above 30.6cm) increased from
    improved aesthetics, increased ecosystem                   25% to 33% between 2008 and 2018
    services and property values.                              which will result in future increases in
  o Urban Forestry works with other City                       ecosystem services.
    divisions to maximize street tree success              • The street tree population of Norway maples
    by investing in technologies and practices               decreased from 22% to 13.5%.
    including the use of soil cells for downtown             o Norway maple is an invasive species that
    tree beds.                                                 can be particularly destructive to natural
                                                               areas where it can out compete native
                                                               species.
                                                             o Norway maples have a large leaf area
                                                               which means that a decrease in their
                                                               population has an associated negative
                                                               impact on ecosystem services.

FIGURE 3: Summary of Positive Trends in Street Tree Indicators

            614,227                              74.4%                             13.5%
            STREET TREES                         Street trees in                   NORWAY MAPLE
                                                 GOOD OR EXCELLENT                 In Street Tree Population
                                                 CONDITION                         Invasive

            90,000                               33.7%                             43%
            STREET TREES PLANTED                 Number of                         Number of
            Approximately 9,000 trees/year       LARGE TREES                       SMALL TREES
                                                 >30.6 cm DBH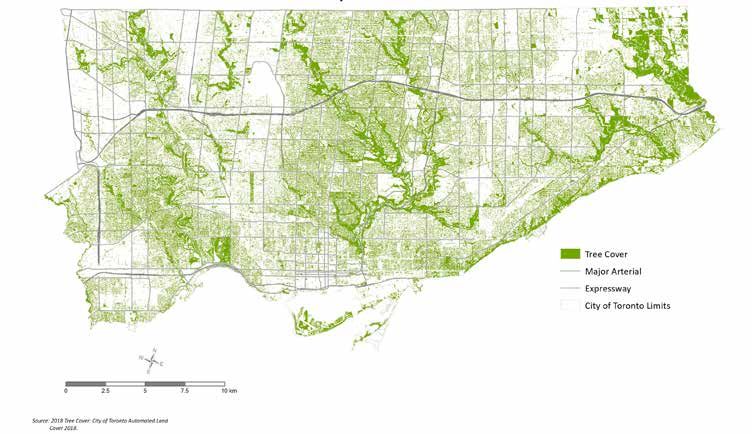
FIGURE 4: Top 10 Species of Street Trees

                            15
                                 13.5%

                                                                                                                                       With the exception of Japanese tree lilac and crab
                            12
Perecentage of Population

                                                                                                                                       apple, the top 10 species are capable of growing
                                                                                                                                       into medium and large stature trees meaning they
                            9                                                                                                          have the potential to deliver significant benefits.

                                                    6.2%
                            6
                                                                          3.8%            3.8%
                                                                                                               3.2%                 3.2%
                            3                                                                                                                       2.5%                   2.4%                   2.2%           2.0%

                            0

                                                                                                                                                                                                                 Ginkgo
                                  Norway maple

                                                     Honey locust

                                                                          Blue spruce

                                                                                           Littleleaf linden

                                                                                                                Silver maple

                                                                                                                                     Crab apple

                                                                                                                                                    Japanese tree lilac

                                                                                                                                                                            Freeman maple

                                                                                                                                                                                                  Red oak
FIGURE 5: Condition of Street Trees

                                                 74.4%
                                                                                                                               25.6%
          Street trees in
    GOOD OR EXCELLENT
           CONDITION                                                                                                           Street trees in
                                                                                                                               FAIR OR POOR
                                                                                                                               CONDITION

FIGURE 6: Street Trees by Size, 2008 to 2018

     2008                                                                       47%                                                                 28%                                                12.5%         6%   3.5% 3%
     2018                                                           43%                                                                     23.3%                                           17.4%                8.8%     4.2% 3.3%
          Ideal                                    29%                                                         23%                                  16%                                     16%             8%            12%

                                                         DBH Class                      0 to 15.2cm                               15 to 30.5cm                            30.6 to 45.7 cm.
                                                                                        45.8 to 61 cm.                            61.1 to 76.2cm                          >76.3 cm.

Page 10 | CanopyTO
FIGURE 7: Annual Ecosystem Services Provided by Toronto’s Street Trees
173,355 Tonnes
614,227 GROSS CARBON STORAGE
STREET TREES Associated Value of $19.882 Million
15.8% of total carbon stored
125.5 Tonnes
5.4% ANNUAL CARBON SEQUESTRATION
of Toronto’s
Associated Value of $330,750
TOTAL TREE POPULATION
8% of annual carbon sequestration
125.5 Tonnes
$1.363 Billion POLLUTION REMOVED ANNUALLY
19.4% OF TOTAL STRUCTURAL VALUE Associated Value of $175,450
12.9% of total annual polution removed
$1.277 Million 331,745 m3
TOTAL VALUE ANNUAL AVOIDED RUNOFF
of Annual Ecosystem Services Associated Value of $771,300
Performed by Street Trees 29% of total annual avoided runoff
Toronto maintains a database with
individual street trees as point data.
Tree species and size information were
used to carry out a benefits analysis.
Structural value is based on the trunk formula
method, which is used to calculate the
economic value of the physical tree based on
its relative size. Additional factors that can
influence value include the tree’s species,
condition, and location.
CanopyTO | Page 11Page 12 | CanopyTO
The composition and condition of the urban forest has
                       seen positive and negative changes.

• Species composition has changed slightly with             • The overall condition of the urban forest has
  more larger-growing species which will result               declined, with 70% of trees rated good or
  in future increases in structural value and                 excellent compared to 82% in 2008.
  ecosystem services.                                         o This change could be a reflection of the
• Native tree cover in parks and ravines remains                stress of climate change, including the
  relatively stable with 70% native tree species.               2013 ice storm, drought and/or heat stress,
• 50% of Toronto’s canopy is made up of species                 effects of the Emerald ash borer pest on the
  native to southern Ontario.                                   remaining ash trees as well as other insect
                                                                pest cycles such as European gypsy moth.
• The distribution of trees in the urban forest
  decreased in all size classes except for smaller            o Trees in the Single Family Residential land
  trees, those with diameters less than 15.2 cm.                use category have an above average
                                                                condition rating, with 79% rated good or
  o This change may be a factor of the loss of                  excellent.
    mature trees to the Emerald ash borer pest
    and an increase in annual tree planting over
    the last 10 years.
  o Approximately 120,000 trees and shrubs are
    planted on public land each year.

                      Tree species distribution, size and condition ratings are based on field data collected
                      at 407 permanent sample plots, established in 2008 and revisited in 2018.
                      The principle of size class distribution is to maintain a consistent proportion of young
                      trees in the population to maximize urban forest benefits, recognizing mortality is a
                      factor as trees mature. This is key to sustainable and equitable distribution of forest
                      cover across the city.

FIGURE 8: Urban Forest Trees by Size, 2008 to 2018

2008                                    68.6%                                            18%             8%      3.5% 1.9%
2018                                        72.9%                                        15.3%           6.9%    2.9% 2%

 Ideal                 40%                                      30%                10%           10%            10%

         DBH Class     2.5 to 15.2 cm    15.3 to 30.5 cm.     30.6 to 45.7 cm.   45.8 to 61 cm.        >61 cm.

                                                                                                       CanopyTO | Page 13
• About 59% of the carbon stored in Toronto’s • Invasive tree species increased from 10%
urban forest is stored by trees in the Single to 14% in parks and ravines between 2008
Family Residential land use category. and 2018.
• Toronto’s trees are estimated to provide o The increase in invasive species is not unique
$55 million in annual ecosystem services. to Toronto as the management of invasive
o $8.3 million per year in home energy savings species is a concern worldwide.
o $4.0 million per year in carbon sequestration o Urban Forestry manages 40 species of
invasive plants following best practices
o $37.9 million per year in pollution removal, promoted by the Ontario Invasive Plant
such as ozone, nitrogen dioxide, sulphur Council using physical, mechanical and
dioxide and particulate matter chemical control methods.
o $4.8 million per year in avoided runoff • Invasive shrub cover more than doubled in 10
years, from 15% to 32.5% in parks and ravines,
much of it common buckthorn.
Native Species o Common buckthorn is now the second
A species living within its natural range most prevalent species of shrub in the
that is naturally self-sustaining. urban forest.
Invasive Species o The spread of the common buckthorn was
A non-native species that aggressively also reported in Oakville’s recent 2015
out-competes native species and comes canopy study, increasing from 2% to 10.6%
to dominate the ecosystem. over the 10 year study period.
FIGURE 9: Native Versus Invasive Species by Land Use
Open Space 1 70% 14%
Institutional 63% 32%
Open Space 2 59% 13%
Residential Singles 44% 31%
Residential Multifamily 41% 23%
Native
Utility and Transportation 37% 20%
Invasive
Industrial 26% 38%
Commercial 21% 54%
Total 50% 26%
0 20% 40% 60% 80% 100%
Percentage of Total Leaf Area
Note: The remaining percentage is made up of non-invasive exotic species.
Page 14 | CanopyTOImpervious land cover is increasing across the city.
• The amount of impervious cover increased FIGURE 10: Top Three Land Uses with Increasing
across the city by 1.4% over 10 years, Pervious to Impervious Cover
from 47.9% to 49.2%.
• Looking back at data from 1999, the 19-year
trend shows impervious cover has been 113 ha
Commercial
increasing (by 3.6%) while pervious cover
is decreasing (by 6.9%).
o This change has implications for stormwater Residential 349 ha
management, water quality, retention of Singles
healthy soils, biodiversity, urban heat island
effects and the amount of potential planting
Utility and 115 ha
space for trees. Transportation
• The most land area converted from pervious to
impervious cover is found on Single Family
Residential lands, a total of 349 hectares.
o By far the greatest amount of available land
for canopy growth is found on Single Family FIGURE 11: Summary of Land Cover Change
Residential lands. Between 1999 and 2018
o Plantable space across the city has decreased 1999 2009 2018
by 2% while non-plantable space (impervious
cover) has increased by 3%.
45.6%
o The change in land cover from pervious to
Impervious 47.9%
impervious is often permanent meaning that 3.6%
the land would never again be considered 49.2%
plantable space for tree canopy expansion.
27.6%
Pervious 24%
Pervious surfaces absorb water -6.9%
that supports tree growth. Pervious 20.7%
surfaces are potential plantable
space for new tree planting. These 25.3%
surfaces include tree, grass, shrub,
Canopy 26.6%
water and bare earth land covers. 3.1%
28.4%
Impervious surfaces do not absorb
water and do not support tree 0 10 20 30 40 50
growth. Instead impervious surfaces Percentage of Land Cover
increase surface water runoff. These
surfaces include buildings, roads
and other impervious land covers.
CanopyTO | Page 15Page 16 | CanopyTO
FIGURE 12: Top Five Land Uses for Potential Canopy Growth

                           Residential                              Open Space 2             Open Space 1           Industrial    Residential
                            Singles                               Commercial, Recreational   Parks and TRCA Lands                 Multifamily
                                                                    and Agriculture Lands
                            5,292 ha                                   1,936 ha                 1,902 ha            1,733 ha        1,251 ha

FIGURE 13: Canopy Change by Land Use, 2009 to 2018

                                            8.9%

      Commercial                           8%

                                           6.3%

         Industrial                        8.7%

                                                   20.5%

      Institutional                                22%

                                                    23.1%
       Residential
       Multifamily                                  23.7%

                                                        31.4%
       Residential
           Singles                                        33.2%

                                                                  56.9%
    Open Space 1
   Parks and TRCA Lands                                            58.3%

    Open Space 2                                          31.8%
Commercial, Recreational
   and Agriculture Lands                                  33.1%

                                                14.9%
      Utility and
  Transportation                                  17.7%

                                       0
                      % Canopy 2009        % Canopy 2018

                                                                                                                            CanopyTO | Page 17
Page 18 | CanopyTO
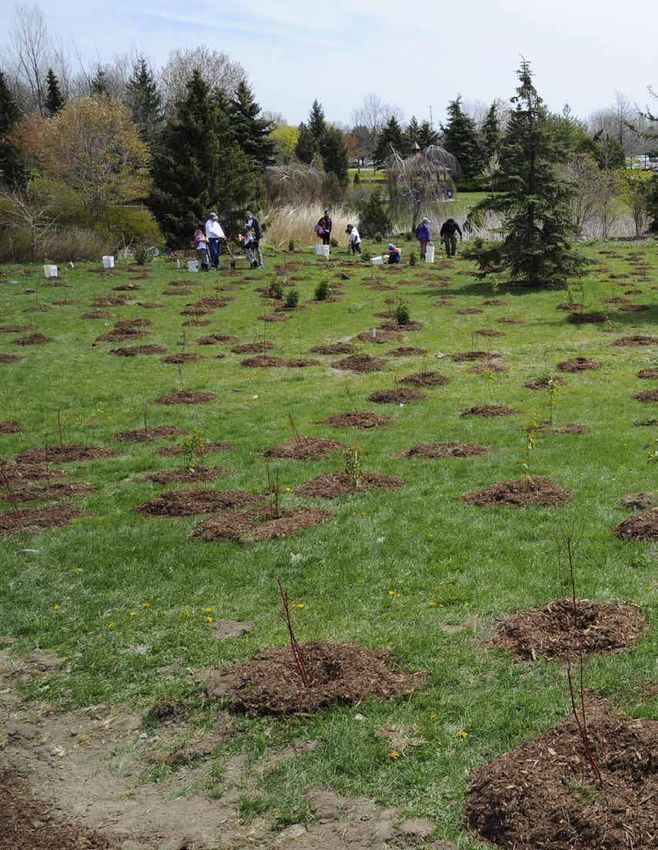
GROWING A RESILIENT URBAN FOREST                      NEXT STEPS
• Approximately 45% of the urban forest is found      • Urban Forestry will continue to analyze the
  on publicly-owned lands.                              study data, sharing this analysis with other City
  o Toronto has planted over 1 million trees            divisions and local municipalities to develop
    and shrubs since 2005. Approximately                potential responses and actions.
    120,000 trees and shrubs are planted on           • Study findings will inform delivery of current
    public land each year.                              Urban Forestry maintenance and operations
• Recognizing that 55% of the city’s land area          activities.
  is privately owned, the City initiated a suite      • Urban Forestry will continue to promote
  of grant and incentive programs to encourage          the Community Stewardship Program which
  tree planting and tree stewardship on private         supports urban forest resilience through
  land. Since 2018, 27,000 trees have                   community tree planting and stewardship
  been planted on private land through                  activities.
  these programs.                                     • Study findings will inform implementation of the
                                                        second Strategic Forest Management Plan
WHAT YOU CAN DO                                         in addition to recommended actions related to
                                                        monitoring and invasive species management in
• Consider volunteering to plant and maintain           the Ravine Strategy Implementation.
  the urban forest by checking out suggestions
  on Toronto’s website.
• Become familiar with Toronto’s tree protection
  bylaws and plan for tree and soil protection
  at the beginning of any construction project
  on your property.
• Request that Urban Forestry plant a tree on
  the road allowance in front of your home by
  contacting 311.
• When thinking of planting a tree on your
  property, it’s important to choose the right tree
  for the right location. To maximize the benefits,
  select a large-growing native species as these
  trees make the most valuable contribution to
  the urban forest.

For more information about Urban Forestry or the
2018 Tree Canopy Study, visit: toronto.ca/trees

                                                                                         CanopyTO | Page 19
toronto.ca
You can also read