Comparing Cereal Rye Seeding Dates and Rates In Corn - Year 2

Page created by Josephine Oconnor
 
CONTINUE READING
Comparing Cereal Rye Seeding Dates and Rates In Corn - Year 2
EXPERIMENT

                                                   Farmer-Led Research
                                                                                                                      2021
 Comparing Cereal Rye Seeding Dates                                                                             Staff Contact
 and Rates In Corn – Year 2                                                                                 Hayley Nelson - (515) 232-5661
                                                                                                             hayley@practicalfarmers.org

  In a Nutshell:
  • Strategies are needed to offset the cost of cover crops that precede corn while minimizing
    yield drag and seedling diseases and maximizing cover crop benefits.
                                                                                                                 Cooperators
                                                                                                               Jon Bakehouse – Hastings
  • In the second year of a two-year project, four cooperators compared the effects of planting                  Monty Douglas – Lenox
    a fall cereal rye cover crop earlier versus later and of reducing the seeding rate from 55 lb/ac            Alec Amundson – Osage
                                                                                                                Camden Watson – Sully
    to 28 lb/ac on indicators of corn crop success and cover crop performance.
  Key Findings:                                                                                                      Funding
  • Only one cooperator was able to reduce the seeding rate of rye without sacrificing rye                            USDA-NRCS
    biomass, soil health or corn yield. At the remaining farms, reducing the rye seeding rate
    reduced biomass with different impacts on soil health and corn yield.                                        Collaborator
  • Seeding rye earlier compared to later consistently resulted in more biomass, and two                  Erin Ogle – Taylor County Soil and
                                                                                                         Water Conservation District, Natural
    cooperators who generated more biomass as a result of seeding early were able to do so                 Resources Conservation Service
    without sacrificing corn yield.
  • At one farm, corn yields where rye was seeded late were greatest irrespective of the seeding
    rate, and corn yields were lowest where rye biomass was seeded early and at the high rate. An
    economic analysis for this site revealed greater returns on investments from seeding later
    at the reduced rate compared to seeding earlier, but this does not account for any long-term
    financial (or environmental) benefits cover crops may provide.

 BACKGROUND                                     The cooperators compared combinations          Furthermore, of the two cooperators that
                                                of two cereal rye seeding rates (28 lb/ac,     had their fields sampled for the presence
 To increase the number of corn and
                                                55 lb/ac) and two seeding dates (early,        of corn seedling diseases, both found that
 soybean acreage planted to cover crops,
                                                late) and measured their effects on cereal     neither reducing the seeding rate nor
 growers will require strategies for
                                                rye biomass, corn yield, rye groundcover,      planting later helped to reduce disease
 maximizing cover crop benefits while
                                                soil health and corn seedling disease. Their   pressure in their corn.
 keeping costs low and minimizing yield
                                                objective was to determine if seeding
 drag in corn. Unlike soybean seedlings,                                                       Four cooperators conducted this trial
                                                early might allow them to reduce the
 corn seedlings are particularly sensitive to                                                  again in 2020 to verify findings from the
                                                volume and cost of cover crop seed they
 competition with cover crops for sunlight,                                                    first year. They evaluated the effects of the
                                                plant without sacrificing corn health and
 water and nutrients, and they run the                                                         same treatments (early, late; 55 lb/ac, 28
                                                cover crop benefits.[3] They also hoped to
 risk of becoming infected with diseases                                                       lb/ac) on cereal rye biomass, soil health,
                                                determine if seeding cereal rye at 55 lb/
 transmitted from cereal rye if certain                                                        corn yield and profitability.
                                                ac later in the season might be worth the
 management precautions are not taken.
                                                expense and allow them to recuperate
 [1]
     Currently, best management practices
                                                any potential losses of cover crop benefits
 dictate that a cereal rye cover crop be
                                                caused by delayed fall planting.
 terminated two weeks prior to planting
 corn to avoid these risks; however, this       Generally, they found that while reducing
 shortens the growing period of cereal rye,     the seeding rate of rye did reduce cover
 which may lessen its benefit.                  crop costs without sacrificing the success
                                                of the subsequent corn crop or soil health,
 A group of seven PFI cooperators conducted
                                                the practices of reducing the seeding
 experiments on their farms in 2019 to
                                                rate as well as seeding later both had the
 evaluate strategies intended to maximize
                                                undesirable consequence of reducing cereal     Jon Bakehouse planted his late-seeded rye 30 days
 cover crop benefit while minimizing costs
                                                rye biomass at five farms and groundcover      after planting his early-seeded cereal rye. The rye
 and damage to a subsequent corn crop.[2]
                                                at the only farm that measured it.             pictured here was seeded early (Oct. 21, 2019) at 55
                                                                                               lb/ac and is 30 days old. Photo taken Nov. 20, 2019.

Page 1 of 6                                            PRACTICAL FARMERS OF IOWA                                                   Published 2021
                                                         www.practicalfarmers.org
Comparing Cereal Rye Seeding Dates and Rates In Corn - Year 2
METHODS
Design
Cooperators established treatments the fall of 2019 by planting cereal rye in strips on each of the seeding dates and at each of the seeding
rates (Table 1). Cereal rye followed soybean at all sites. At each farm, growers arranged treatment strips in a split-plot randomized
complete block design. In this design, a block of land is divided into two whole plots and the levels of the seeding date treatment (early,
late) are randomly assigned to a whole plot. After assigning treatments to whole plots, both whole plots are further divided into two
subplots to which the levels of the seeding rate treatment (28 lb/ac, 55 lb/ac) are randomly assigned (Figure A1). Growers replicated each
treatment four times for a total of 16 strips at each farm. This design allowed us to conduct statistical analyses and assess the effects of
the seeding date and seeding rate treatments.

                                   TABLE 1. Fall field operations and treatment establishment in 2020.
                                                                         RYE SEEDING                   RYE SEEDING DATES
 FARM                   STRIP SIZE               RYE VARIETY               METHOD                  EARLY                    LATE
 Bakehouse              15 ft x 795 ft                 Elbon               8-in. drill              Oct. 21                 Nov. 20
 Douglas               42 ft x 1,040 ft              Unknown               10-in. drill             Oct. 30                 Nov. 15
 Amundson              40 ft x 2,350 ft                VNS                 15-in. drill             Oct. 20                 Oct. 30
 Watson                 15 ft x 600 ft                 Elbon              7.5-in. drill             Oct. 18                 Nov. 2

The spring after establishing rye treatments, cooperators chemically terminated rye and planted corn in all strips (Table 2).

                                   TABLE 2. Rye termination and corn planting management in 2020.
                               RYE TERMINATION                                               CORN PLANTING
                                                                                                                       POPULATION
 FARM                    DATE             HERBICIDES & RATES                 DATE              ROW SPACING              (seeds/ac)
                                          Accuron Flexi (2.25 qt/ac),
 Bakehouse               Apr. 21               Durango DMA                  Apr. 30                 30 in.                  33,500
                                                 (24 oz/ac)
 Douglas                 Apr. 20                   Roundup                  Apr. 23                 30 in.                  32,000
                                            Glyphosate (36 oz/ac),
 Amundson                May 3            Atrazine (1 pt/ac), Resicore      Apr. 23                 30 in.                  34,000
                                                   (2 pt/ac)
                                             Roundup (32 oz/ac),
 Watson                  Apr. 20                                            Apr. 21                 30 in.                  34,600
                                              Acuron (54 oz/ac)

Weed and nutrient management was unique at each farm and was applied equally to all strips.
Bakehouse applied 70 lb N/ac and 55 lb S/ac as UAN(32) and ammonium thiosulfate on April 22 – one day after terminating rye and eight
days before planting corn. Bakehouse applied an additional 70 lb N/ac on June 16 as UAN(28).
Amundson applied 24 lb N/ac and 14 lb S/ac as UAN(32) and ammonium thiosulfate on Apr. 23. On June 6, he applied 140 lb N/ac as
UAN(32).
Watson applied 130 lb N/ac as ammonium nitrate on April 8. Watson applied an additional 30 lb N/ac as UAN(32) in the same pass as his
cover crop termination herbicide on April 20.
Douglas applied 165 lb N/ac as anhydrous on April 15.

Page 2 of 6                                               PRACTICAL FARMERS OF IOWA                                          Published 2021
                                                            www.practicalfarmers.org
Measurements                                                                          experiment, reducing the seeding rate did not result in statistically
                                                                                      less rye biomass. This may be related to the uncharacteristically
Cooperators sampled aboveground cereal rye biomass before or
                                                                                      wet fall following planting the cover crop as well as very low
within eight days following the date of terminating rye (Table 3).
                                                                                      moisture throughout April prior to terminating the cover crop on
Samples were collected into paper bags from within quadrats no
                                                                                      May 3, 2020 (Figure A2).
smaller than 1 ft2 and from a minimum of two arbitrarily placed
quadrats in each strip. Rye biomass samples were air-dried then                       At all four sites, delaying the rye seeding date resulted in less rye
weighed.                                                                              biomass (Table 4).

           TABLE 3. Sampling dates at each farm in 2020.                                      TABLE 4. Rye biomass (lb/ac) by seeding date and
                      RYE                   SOIL                   CORN                                    seeding rate in 2020.
 FARM               BIOMASS                HEALTH                  YIELD                                     SEEDING RATE
 Bakehouse            4/20/20                6/12/20               9/19/20             FARM                55 lb/ac      28 lb/ac       DIFF.          LSD
 Douglas              4/28/20                6/22/20              10/17/20             Bakehouse             412 a         240 b          172          123
                                                                  10/16/20,            Douglas               256 a         140 b          116           22
 Amundson             4/29/20                6/12/20
                                                                  10/18/20
                                                                                       Amundson               68 a          55 a          13            23
 Watson               4/19/20                6/13/20              10/30/20             Watson                 97 a          59 b          38            25
Cooperators sampled soil in June (Table 3). In each strip, they                                              SEEDING DATE
collected ten soil cores to a 6-in. depth from randomly selected
                                                                                       FARM                 EARLY         LATE          DIFF.          LSD
locations and mixed them thoroughly. Samples were sent to
AgSource Laboratories (Ellsworth, IA) to determine the burst of                        Bakehouse             479 a         173 b          306          123
CO2-C released from rewetted soil (Solvita assay).                                     Douglas               277 a         119 b          158           22

Cooperators harvested corn individually from each strip and                            Amundson               79 a          44 b          35            23
recorded grain yield and moisture (Table 3). Yields were adjusted                      Watson                103 a          52 b          51            25
to standard moisture (15.5%).                                                          Treatment means within a row that differ by more than the least
                                                                                       significant difference (LSD) are followed by different letter-rankings
Data analysis                                                                          and are considered statistically different at the 95% confidence level.
To evaluate the effects of the rye seeding date and rate treatments
                                                                                      Soil health
on cover crop biomass, soil health and corn yield, we calculated
averages for each measurement in each treatment combination                           Solvita soil health tests revealed no difference in the burst of soil
then used t-tests to compute least significant differences (LSDs) at                  CO2-C at all farms as a result of reducing the rye seeding rate from 55
the 95% confidence level. The difference between each treatment or                    lb/ac to 28 lb/ac (Table 5). Delaying planting had no impact on soil
treatment combination’s average for a given measurement at each                       health for three farms, but resulted in a statistically smaller burst of
farm is compared with the LSD. Differences greater than or equal                      CO2-C at Douglas’ farm.
to the corresponding LSD indicate the presence of a statistically
                                                                                      Corn yield
significant treatment effect, meaning one treatment or treatment
combination outperformed the other and that cooperator can                            Seeding rye at 55 lb/ac compared to 28 lb/ac led to reduced corn
expect the same results to occur 95 out of 100 times under the same                   yields at Bakehouse’s farm, while yields at Douglas’ farm were
conditions. Differences smaller than the LSD indicate a difference                    greater in the treatment seeded at 55 lb/ac (Table 6). Corn yields
is not statistically significant and the treatment or treatment                       between both seeding rate treatments at Amundson’s farm were
combination had no effect for a given measurement.                                    statistically similar (Table 4).
RESULTS AND DISCUSSION                                                                Seeding rye later compared to earlier had no effect on corn yields at
                                                                                      Bakehouse’s and Amundson’s farms. At Douglas’ farm, yields were
                                                                                      greater in the early-seeded rye strips.
                                                                                      At Watson’s, the presence of a strong interaction between the
                                                                                      effects of seeding date and seeding rate on corn yield allowed us to
                                                                                      compare the four treatment combinations rather than comparing
                                                                                      the effects of seeding rate and seeding date separately. The
                                                                                      greatest corn yields at Watson’s occurred when rye was seeded late
                                                                                      (Figure 1). There was no difference in yields between either
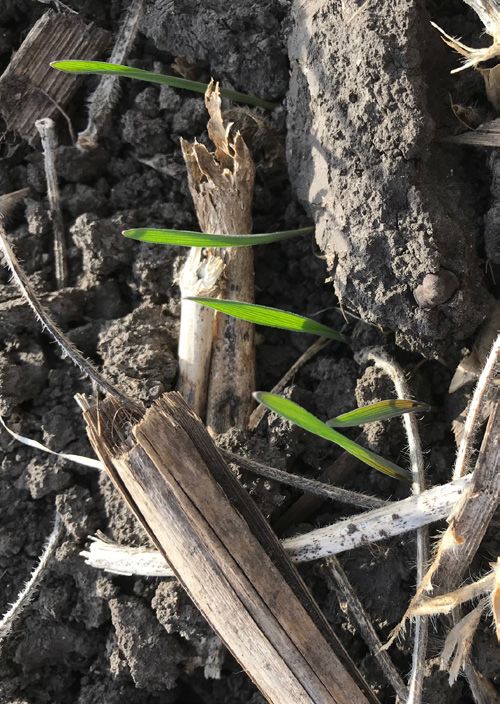
Adjacent treatment strips at Jon Bakehouse’s show cereal rye seeded at the same       seeding rate when rye was seeded late. The lowest corn yields
rate but on different dates – Oct. 21, 2019 (left) and Nov. 20, 2019 (right). Photo   occurred when rye was seeded early and at the full rate.
taken April 7, 2020.

Rye biomass
Reducing the seeding rate from 55 lb/ac to 28 lb/ac resulted in
less rye biomass at three of four farms (Table 4). In Amundson’s

Page 3 of 6                                                        PRACTICAL FARMERS OF IOWA                                                    Published 2021
                                                                     www.practicalfarmers.org
TABLE 5. Soil CO2-C burst (ppm) by seeding date                               TABLE 6. Corn yield (bu/ac) by seeding date and
                      and seeding rate in 2020.                                                      seeding rate in 2020.
                          SEEDING RATE                                                                              SEEDING RATE
 FARM                  55 lb/ac     28 lb/ac          DIFF.      LSD           FARM                              55 lb/ac          28 lb/ac        DIFF.               LSD
 Bakehouse                58 a        51 a              7         11           Bakehouse                           160.8 b           165.5 a           4.7             4.4
 Douglas                  40 a        39 a              1          5           Douglas                             175.4 a           172.9 b           2.5             1.3
 Amundson                 46 a        45 a              1          8           Amundson                            213.1 a           211.9 a           1.2             2.4
 Watson                   63 a        66 a              3         12                                                SEEDING DATE
                          SEEDING DATE                                         FARM                               EARLY              LATE          DIFF.               LSD
 FARM                  EARLY         LATE             DIFF.      LSD           Bakehouse                           161.3 a           165.0 a           3.7             4.4
 Bakehouse                55 a        54 a              1         11           Douglas                             174.5 a           173.8 b           0.8             1.3
 Douglas                  42 a        37 b              5          5           Amundson                            211.8 a           213.2 a           1.4             2.4
 Amundson                 42 a        49 a              7          8           Treatment means within a row that differ by more than the least
 Watson                   61 a        69 a              8         12           significant difference (LSD) are followed by different letter-rankings
                                                                               and are considered statistically different at the 95% confidence level.
 Treatment means within a row that differ by more than the least
 significant difference (LSD) are followed by different letter-rankings
 and are considered statistically different at the 95% confidence level.

Economic considerations                                                                                       Watson -- Corn Yield
                                                                                                    300
At Watson’s farm, the ROI (return on investment) was greatest for                                                                      LSD = 4 bu/ac
the treatment seeded late and at the reduced rate (Table 7). Its ROI                                250          219 b             214 c          226 a              229 a
was $861.55/ac – only $7.23/ac greater than the ROI for seeding                       bushels per acre
later at the full rate. Seeding later at the reduced rate generated an                              200
extra $32.47/ac to $58.80/ac than seeding earlier, while seeding
later at the full rate generated an extra $25.24/ac to $51.57/ac                                    150
than seeding earlier. These values do not take into consideration
                                                                                                    100
any potential long-term financial benefits of cover cropping. On-
farm research conducted by Jack Boyer has shown that reducing                                            50
his typical fertilizer rate by 50 units on a field with a 6-year history
                                                                                                               R1 R2 R3 R4       R1 R2 R3 R4   R1 R2 R3 R4       R1 R2 R3 R4
of cover cropping saved him $26/ac.[4] While ROIs at Watson’s farm                                       0
                                                                                                                Early-28          Early-55      Late-28           Late-55
were greater in the late-seeded strips compared to the early-seeded
strips, and also in the strips seeded at the reduced rate compared to                FIGURE 1. Corn yields among each treatment combination at Watson’s
the full rate on each seeding date, both seeding later and seeding at                farm. Columns represent yields for each individual strip. The average
the reduced rate resulted in less rye biomass at Watson’s.                           yield is indicated above each group of columns. Averages are followed by
                                                                                     different letter-rankings to indicate a statistically significant difference
                                                                                     at the 95% confidence level.

            TABLE 7. Cost, revenue and return on investment ($/ac) for treatment combinations at Camden Watson’s in 2020.
 OPERATION                          28 LB/AC – EARLY              55 LB/AC – EARLY                             28 LB/AC – LATE                   55 LB/AC - LATE
 Cereal rye seed ($/ac)                       7.50                         14.73                                         7.50                                14.73
 Total cost ($/ac)                            7.50                         14.73                                         7.50                                14.73
 Corn yield (bu/ac)                           219                           214                                          227.5                               227.5
 Revenue @ $3.82/bu                          836.58                        817.48                                     869.05                                 869.05
 ROI: REVENUE - COST                     $829.08/ac                    $802.75/ac                                   $861.55/ac                          $854.32/ac
 a
     Cover crop costs provided by Camden Watson.
 b
     Corn prices accessed from Nov. 2020 Iowa Cash Corn and Soybean Prices. [5]

Page 4 of 6                                                   PRACTICAL FARMERS OF IOWA                                                                        Published 2021
                                                                www.practicalfarmers.org
CONCLUSIONS AND NEXT STEPS
In the first year of these trials, no cooperators were able to reduce the cereal rye seeding rate (and therefore the cover crops costs) without
sacrificing rye biomass.[2] Seeding rye early and at the full rate was necessary to generate maximum cover crop biomass and did not
negatively impact corn yield. Results from the second and final year of these trials are mixed.
In 2020, one cooperator (Amundson) was able to reduce the seeding rate of rye from 55 lb/ac to 28 lb/ac without sacrificing rye biomass,
soil health or corn yield, whereas reducing the seeding rate at the remaining three farms (Bakehouse, Douglas, Watson) did result in
less biomass. At Bakehouse’s farm, greater biomass generated in the full-rate strips translated to reduced corn yields, and the opposite
was true at Douglas’ farm, where greater biomass in the full-rate strips translated to greater corn yields. At Watson’s farm, the trend of
rye seeded at a reduced rate resulting in less rye biomass appeared in his corn yields as greater yields where rye was seeded early at the
reduced rate versus early at the full rate; however, where rye was seeded later, seeding rate had no impact on corn yield.
Seeding rye earlier compared to later consistently resulted in greater biomass for cooperators in 2020, as it did in 2019. Only one
cooperator (Douglas) experienced a co-occurring increase in soil health due to seeding earlier in 2020. Douglas was one of only two
cooperators who experienced greater corn yields where rye was seeded later. At Watson’s farm, corn yields were greatest where rye was
seeded late irrespective of the seeding rate, and corn yields were lowest where rye biomass was seeded early and at the high rate. For
Bakehouse and Amundson, seeding rye earlier generated greater biomass without sacrificing corn yield.
Based on the results generated by 12 cooperator experiments over two years, reducing rye seeding rates may not be an effective solution
to reduce cover crop costs. Seeding at the reduced rate resulted in less rye biomass in most experiments. Whether or not seeding rye at
the full rate may help a grower to generate the same amount of biomass when weather or other circumstances delay planting as compared
to seeding rye at either rate earlier in the season is not clear from these experiments. The only farm for which an economic analysis could
be conducted showed greater returns on investments from seeding later at the reduced rate compared to seeding earlier; however, this
does not take into account any potential long-term financial benefits that cover cropping has been shown to provide.

APPENDIX – TRIAL DESIGN AND WEATHER CONDITIONS

FIGURE A1. Sample experimental design used by the cooperators. The design includes
at least four replications of the seeding-date and seeding-rate treatment combinations
(16 strips total). This design allowed for statistical analysis of the results.

Page 5 of 6                                             PRACTICAL FARMERS OF IOWA                                               Published 2021
                                                          www.practicalfarmers.org
A. Glenwood                                                                                                               B. Corning                                                                            C. Oskaloosa
                   80                                                                                                         80                                                                                                   90
                   70                                                                                                         70                                                                                                   80

                   60                                                                                                         60                                                                                                   70

                                                                                                                                                                                                                Temperature (°F)
Temperature (°F)

                                                                                                           Temperature (°F)
                                                                                                                                                                                                                                   60
                   50                                                                                                         50
                                                                                                                                                                                                                                   50
                   40                                                                                                         40
                                                                                                                                                                                                                                   40
                   30                                                                                                         30                                                                                                   30
                   20                                                                                                         20                                                                                                   20
                   10                                                                                                         10                                                                                                   10

                    0                                                                                                          0                                                                                                    0
                        J     F    M     A     M   J       J       A       S       O       N       D                                               J    F     M      A    M     J   J   A   S   O   N   D                               J     F     M     A    M   J   J   A   S   O   N   D
                   10                                                                                                         12                                                                                                   12
                                  2019                                                                                                                      2019                                                                                  2019
                    9                                                                                                                                                                                                                             2020
                                  2020                                                                                        10                            2020                                                                   10
                    8                                                                                                                                                                                                                             127-yr Avg
                                                                                                                                                            127-yr Avg
                                  127-yr Avg
                    7                                                                                                                                                                                                               8
                                                                                                                               8

                                                                                                                                                                                                                Rainfall (in.)
Rainfall (in.)

                                                                                                           Rainfall (in.)
                    6
                                                                                                                                                                                                                                    6
                    5                                                                                                          6
                    4
                                                                                                                                                                                                                                    4
                    3                                                                                                          4

                    2                                                                                                                                                                                                               2
                                                                                                                               2
                    1
                                                                                                                                                                                                                                    0
                    0                                                                                                          0                                                                                                        J     F     M     A    M   J   J   A   S   O   N   D
                        J     F    M     A     M   J       J       A       S       O       N       D                                               J    F     M      A    M     J   J   A   S   O   N   D

                        D. Osage                                                                                                                       E. Grinnell
                   80                                                                                                                             80
                   70                                                                                                                             70                                                                                        FIGURE A2. Mean monthly
                   60                                                                                                                             60
                                                                                                                                                                                                                                            temperature and rainfall during
                                                                                                                               Temperature (°F)
Temperature (°F)

                   50                                                                                                                             50
                   40                                                                                                                             40                                                                                        the study period and the long-
                   30                                                                                                                             30                                                                                        term averages at the nearest
                   20
                   10
                                                                                                                                                  20
                                                                                                                                                  10
                                                                                                                                                                                                                                            weather stations to each farm.[6]
                    0                                                                                                                              0                                                                                        A) Glenwood (Bakehouse, about
                        J     F     M      A   M       J       J       A       S       O       N       D                                               J      F      M     A    M   J   J   A   S   O   N   D
                   12
                                  2019
                                                                                                                                                  12
                                                                                                                                                                   2019                                                                     14 miles away); B) Corning
                   10             2020
                                  127-yr Avg
                                                                                                                                                  10               2020
                                                                                                                                                                   127-yr Avg
                                                                                                                                                                                                                                            (Douglas, about 11 miles away);
                    8                                                                                                                              8                                                                                        C) Osage (Amundson, about
                                                                                                                               Rainfall (in.)
Rainfall (in.)

                    6                                                                                                                              6                                                                                        4 miles away); D) Grinnell
                    4                                                                                                                              4
                                                                                                                                                                                                                                            (Watson, about 13 miles away).
                    2                                                                                                                              2

                    0                                                                                                                              0
                        J     F     M      A   M       J       J       A       S       O       N       D                                               J      F      M     A    M   J   J   A   S   O   N   D

 FUNDING ACKNOWLEDGEMENT
 This material is based upon work supported by the Natural Resources Conservation Services, U.S. Department of Agriculture, under number NR186114XXXXG003.
 Any opinions, findings, conclusions, or recommendations expressed in this publication are those of the authors and do not necessarily reflect the views of the U.S.
 Department of Agriculture.

 REFERENCES
 1.                         Acharya, J., M.G. Bakker, T.B. Moorman, T.C. Kaspar, A.W. Lenssen and A.E. Robertson. 2017. Time Interval Between Cover Crop Termination and Planting
                            Influences Corn Seedling Disease, Plant Growth, and Yield. Plant Disease. 101:591–600. https://apsjournals.apsnet.org/doi/pdf/10.1094/PDIS-07-16-0975-RE
                            (accessed April 2019).

 2.                         Nelson, H., J. Bakehouse, S. Bennett, M. Douglas, W. Fredericks, J. Gustafson, M. Jackson, D. Norby, A. Robertson, J. Acharya, E. Ogle and T. Gunther. 2020.
                            Comparing Cereal Rye Seeding Dates and Rates In Corn. Practical Farmers of Iowa Cooperators’ Program. https://practicalfarmers.org/research/comparing-
                            cereal-rye-seeding-dates-and-rates-in-corn/ (accessed February 2021).

 3.                         Gailans, S. and J. Boyer. 2015. Effect of Seeding Date on Cover Crop Performance. Practical Farmers of Iowa Cooperators’ Program. https://practicalfarmers.
                            org/research/effect-of-seeding-date-on-cover-crop-performance/ (accessed April 2020).

 4.                         Gailans, S. and J. Boyer. 2019. Does Repeated Use of a Cereal Rye Cover Crop Reduce the Need for N Fertilizer for Corn? Practical Farmers of Iowa Cooperators’
                            Program. https://practicalfarmers.org/research/does-repeated-use-of-a-cereal-rye-cover-crop-reduce-the-need-for-n-fertilizer-for-corn/ (accessed October
                            2020).

 5.                         Johanns, A. 2021. Iowa Cash Corn and Soybean Prices. A2-11. Ag Decision Maker. Iowa State University Extension and Outreach. www.nass.usda.gov/
                            Statistics_by_State/Iowa/ (accessed March 2021).

 6.                         Iowa Environmental Mesonet. 2020. IEM “Climodat” Reports. Iowa State University Department of Agronomy. http://mesonet.agron.iastate.edu/climodat/
                            (accessed December 2020).

                                                                                                                                                                                                        of Iowa
                                                                                                                                                                                PFI COOPERATORS’ PROGRAM
                                               PFI’s Cooperators’ Program helps farmers find practical answers and make informed decisions through on-farm research projects.
                                                     The Cooperators’ Program began in 1987 with farmers looking to save money through more judicious use of inputs.
                                                If you are interested in conducting an on-farm trial contact Stefan Gailans @ 515-232-5661 or stefan@practicalfarmers.org.

 Page 6 of 6                                                                                                                                                                            PRACTICAL FARMERS OF IOWA                                                                              Published 2021
                                                                                                                                                                                          www.practicalfarmers.org
You can also read