Idaho Power Company's Cloud Seeding Program
←
→
Page content transcription
If your browser does not render page correctly, please read the page content below
Idaho Power Company’s
Cloud Seeding Program

                                   Shaun Parkinson, PhD, PE

Presentation Overview

•   What is cloud seeding?
•   How we know cloud seeding works…
•   Perceptions…
•   IPC’s cloud seeding program…
    •   Payette
    •   Upper Snake
• Benefits
   e e s
    • Increased Runoff…
    • Increased Generation…

                                                              1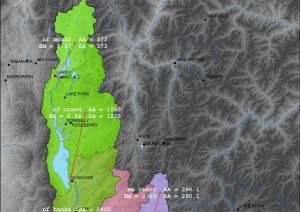
What is cloud seeding?

• The term cloud seeding has been used to describe:
    –   Fog suppression
                     i (airports)
                        ( i      )
    –   Hail suppression (reduce crop and property damage)
    –   Rainfall enhancement (water supply augmentation)
    –   Snowpack enhancement (snowpack augmentation)
• Our focus is snowpack enhancement
• In particular – IPC does winter orographic cloud seeding

Winter Orographic
Cloud Seeding
• As air is forced up and over mountains, it cools.
• If moist
        i enough, h it
                    i condenses
                          d       to form
                                     f    a cloud
                                             l d off tiny
                                                      i water droplets.
                                                              d l
• Cloud droplets do not freeze at 0°C (32°F). Instead, they supercool,
  remaining liquid at much colder temperatures.
• Eventually, ice gets introduced into these supercooled clouds, usually at
  temperatures colder than about -12°C (+10°F). Ice formation is induced
  by tiny particles called ice nuclei.

                                       .
                                       First Ice

                                                                              2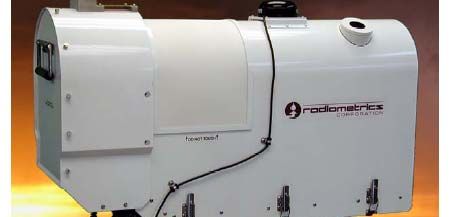
Winter Orographic
Cloud Seeding
• Once ice forms, the particles grow quickly, forming flakes that become
  large enough to fall out as snow.
                              snow
• Ice crystals continue to grow and may become large enough to fall as
  snow as they travel beyond the peak.
• As air continues over a mountain it may descend and warm. Crystals that
  haven’t fallen as snow may be too small to fall, or they may melt and
  evaporate.

                                      .
                                      First Ice

Winter Orographic
Cloud Seeding
• Cloud seeding provides additional ice nuclei that function at warmer
  temperatures allowing ice formation to begin sooner.
  temperatures,                                 sooner
• This occurs at temperatures as warm as -5oC (+23°F), though more
  effectively at -8oC (+17oF) or colder. (The majority of natural ice nuclei
  become effective between -15°C to -20°C (+5 to -4oF).)

                                . .
                 First Ice, seeding   First Ice, not seeded

                                                                               3
Winter Orographic
Cloud Seeding
• Snowfall is thus increased incrementally because more ice crystals have
a better opportunity to grow and fall as snow while over the mountain.
mountain
• Cloud seeding enhances the efficiency of converting supercooled cloud
water into snow, increasing precipitation (snowfall) efficiency.
Otherwise, this cloud water would likely pass over the mountain and
evaporate.
Cloud Seeding
Summary
• Cloud seeding provides mother nature with ice nuclei
• But, it is only effective when ice nuclei are limiting and nature is
performing the other required precipitation processes
– cloud seeding doesn’t create clouds to seed – it will not cure a drought!
• Effectiveness depends on:
– temperatures,
– available water in the atmosphere,
– ice nuclei properties,
– cloud droplet and natural ice distributions
• Several agents can be used as ice nuclei, with silver iodide (AgI)
being the most common used in commercial cloud seeding.
4Cloud Seeding
Programs - WMA
Silver Iodide Distribution
• In commercial programs, silver iodide is burned to release silver
i did particles
iodide ti l (ice
(i nuclei)
l i) off an appropriate
i t size
i tot the
th
atmosphere.
• Ground generators - Acetone – silver iodide solution is burned in a
propane flame.
• Aircraft - silver iodide is incorporated into a flare, or solution is
burned.
5Presentation Overview
• What is cloud seeding?
• How we know cloud seeding works…
• Perceptions…
• IPC’s cloud seeding program…
• Payette
• Upper Snake
• Benefits
e e s
• Increased Runoff…
• Increased Generation…
• Water Temperature Benefits…
Cloud Seeding
• Lots of evidence that it works in laboratory and controlled
conditions.
diti
• The big question – how do we know it puts snow on the ground?
• Plume tracing – UT pulsed seeding experiment
• Trace chemistry (IPC’s dual tracer)
• Aircraft data collection
6UT Pulsed Seeding
Experiment
UT Pulsed Seeding
Experiment Before Seeding Seeding After Seeding
7IPC’s Dual Tracer
Assessment
Approach
• IPC needed
d d tto ddemonstrate
t t ththatt project
j t can effectively
ff ti l putt snow in
i
target area, and that seeding increases snowpack as expected.
• Independent contractors performed assessment
• Co-located seeding and tracer generators – ground and aircraft
– Release seeding and tracer aerosols at same rate
• Nucleating particles (silver iodide) incorporated into snowpack
through either ice nucleating (seeding) process or scavenging
• Non-nucleating particles (inert tracers ) incorporated in snowpack
through scavenging process only.
Co-located Generators
8IPC’s Dual Tracer
Assessment
Approach (cont.)
• Following seeding, analyze snowpack for evaluation of trace levels
of silver, indium, and cesium as well as snowpack density
• Ratio of silver to tracer (ex. Indium) in the snow pack gives an
indication of how much silver deposited by ice nucleating vs.
scavenging processes.
Sampling Snow Pack
• Snow samples collected using ultra-trace ‘metal clean’
techniques and acid cleaned equipment.
9Analytical Methods
• Samples acidified with ultra-pure
nitric acid in class 100 clean room.
• Analysis by High Resolution
Inductively Coupled Plasma Mass
Spectrometry.
• Detection limits of ~ 300 parts per
quadrillion for silver
– 300 / 1,000,000,000,000,000 (1015)
• Think of it as a single drop of water
in a cube 368m on a side or in a
sports arena like the Idaho Center
(Nampa, ID), or 5 minutes out of
31.7 million years.
Targeting from
Chemistry Data
March 5 and 6, 2004
Control
Ground-generator Site
• Targeting of the seeding site
MC
operations was assessed by = silver
i t
integrating
ti the
th silver
il found
f d BC deposited
in the snow over a given 100 x 10 -12 g
storm period to estimate the (ppt)
total amount of silver NG
V MM
KR BM
deposited during the storm. = silver 100 g
December 6 through 9, 2004 released
MC
BC
NG
V KR BM
CM MM
Example Targeting Maps for the March
2004 and December 2004 storm periods
10Targeting Results
• The amount of silver deposited downwind of active ground
generators
t was muchh greater t than
th that
th t found
f d att the
th control
t l sites.
it
• Silver distributions show that targeting was effective.
• Indium concentrations were generally very low
– Silver not from scavenging
• Evidence for targeting by aircraft was found in the target area
• Thee project
p ojec layout
you andd ope
operations
o s can
c effectively
e ec ve y hit thee target
ge area
e
with both ground generators and aircraft.
Trace Chemistry
Summary
• Snowpack conditions during assessment were 74% and 65% of
normall (lack
(l k off storms
t limited
li it d seeding
di opportunities).
t iti )
• During 2004-2005, DRI concluded cloud seeding revealed an
overall average increase of 7%. Individual storm events ranged
between 7% and 35% increases.
• Under favorable conditions, greater increases may be obtained
through longer and more frequent seeding periods.
• Moving to flares significantly increases seeding potential from the
aircraft.
11Presentation Overview
• What is cloud seeding?
• How we know cloud seeding works…
• Perceptions…
• IPC’s cloud seeding program…
• Payette
• Upper Snake
• Benefits
e e s
• Increased Runoff…
• Increased Generation…
• Water Temperature Benefits…
Downwind Effects
• Research on the subject has shown there are neutral or positive
effects
ff t (more
( precipitation)
i it ti ) from
f a well
ll run program
• A poorly run program has the potential to reduce precipitation
• To put quantities into context…
– Nature will condense about 20% of the water vapor as moist air rises over a
mountain barrier (the remaining 80% remains uncondensed).
– Winter storms are typically about 30% efficient, meaning 30% of the 20%,
or 6% of the total
total, reaches the ground.
ground
– If cloud seeding increases precipitation 15%, that amounts to 15% of the
6%, or 0.9% of the total water vapor is the additional amount cloud seeding
pulls from the atmosphere.
12Silver Toxicity
• The WMA has issued a statement on toxicity of silver originating
f
from cloud
l d seeding…
di
http://weathermodification.org/AGI_toxicity.pdf
• In summary,
“The published scientific literature clearly shows no
environmentally harmful effects arising from cloud seeding with
silver iodide aerosols have been observed; nor would they be
expected to occur. Based on this work, the WMA finds that silver
iodide is environmentally safe as it is currently being dispensed
during cloud seeding programs.”
IDEQ Review
• IDEQ reviewed cloud seeding w.r.t. water and air quality.
• Water quality - it is unlikely that cloud seeding will cause a
detectable increase in silver concentrations in target area or pose a
chronic effect to sensitive aquatic organisms.
• Air quality permit not needed based on screening thresholds.
• http://www.idwr.idaho.gov/waterboard/WaterPlanning/CAMP/ES
p://www. dw . d o.gov/w e bo d/W e g/C / S
PA/WorkingGroups/PDF/WM//2010/02-09-10_MtgPresent.pdf
13Presentation Overview
• What is cloud seeding?
• How we know cloud seeding works…
• Perceptions…
• IPC’s cloud seeding program…
• Payette
• Upper Snake
• Benefits
e e s
• Increased Runoff…
• Increased Generation…
• Water Temperature Benefits…
Idaho Power’s History
with Cloud Seeding
• At the request of shareholders – began investigating cloud seeding in 1993
• Literature review 1993 and 1994
• Climatology study 1994-95
• Contracted operational program in 1996-97
• Planned to perform internal program in 1997-98
– canceled do to no mechanism to recover project expenses and share benefits
• Reinstated in Feb 2003.
• Operational including assessment in fall of 2003
• Completed second year of assessment and third year of operations in May 2005.
2005
• In 2008 worked with HCRC&D and E Idaho Counties to enhance their program
– In 2008 installed 3 remote generators, provided meteorological data and operations guidance
– In 2009 installed 6 additional remote generators (total of 9)
– In 2010 installing 7 additional generators for HCRC&D program (total of 16)
– Purchasing data collection equipment and working with NCAR for a Phase II feasibility study
for a project in Salt and Wyoming ranges.
14Effective Program Includes
• Knowledge of:
– Storm timing – prepare for operations
– Water content – is the storm conducive to seed?
– Temperature profile
– Wind speed and direction
• The wrong combination of temperature and water content can easily lead to
reduced precipitation.
• Winds effect targeting
• Operating Criteria
• Flexibility – ability to seed a range of conditions
• Aircraft safety
– Flying a plane in storm conditions – pilot needs guidance regarding severe
ice, lightning, etc.
• Suspension Criteria
Idaho Power’s
Cloud Seeding Projects
Payette Upper Snake
in cooperation with
E. Idaho - HCRC&D
Salt and Wyoming
Ranges
15Rawinsonde
Temperature
Relative Humidity
Pressure
Wind Direction
Wind Speed
Up to 60,000’
Radiometrics M3000A
Microwave Radiometer
• Radiometers measure the power
radiated by the atmosphere at
different wave lengths. They are
passive, receive-only instruments,
meaning they emit no radiation
themselves.
• The wave length of the radiation
identifies the source of the emission
resultingg in a atmospheric
p profile:
p
– Temperature
– Relative Humidity
– Liquid Water IPC’s
16Radiometer Data
• Real time atmospheric profiling by
elevation:
Supercooled liquid
– Temperature
water
– Relative Humidity
– Liquid Water
– Vapor Density
Image courtesy of Radiometrics
Generator Types
Burn Head
Temperature Probe
Ignition Coil
Valve Box
Satellite
Solar Panel
Communication
Tower
Computer Box
Nitrogen Solution Tanks
Platform
Manual Cloud
Seeding Generator
Batteries
Propane
Remote Cloud
Seeding Generator
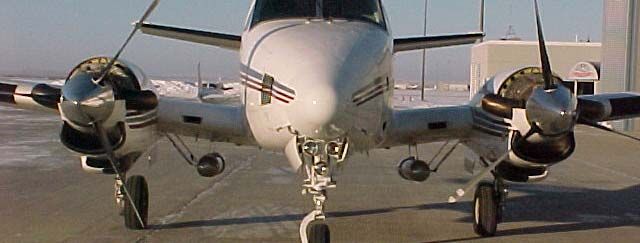
17Aircraft Seeding
Presentation Overview
• What is cloud seeding?
• How we know cloud seeding works…
• Perceptions…
• IPC’s cloud seeding program…
• Payette
• Upper Snake
• Benefits
e e s
18Target – Control
Payette
Target vs. Control Cumulative Precipitation
1987-2002 Historical Relationship and 2003-2010 Observed
58.0
Pooled target site cumulative precipitation (in.) - Oct. 15 - Apr. 15
53.0 2006 - y = 1.0893x - 4.2385
15% ABOVE R² = 0.9640
EXPECTED
48.0
43.0 2003 - 2008-
11% ABOVE 16 % ABOVE
EXPECTED EXPECTED
38.0 2009 -
15% ABOVE
2007- EXPECTED
33 0
33.0 10% ABOVE
2004 -
28.0 2005 - 5% ABOVE
26% ABOVE EXPECTED
EXPECTED
23.0 2010 -
25% ABOVE
18.0
18.0 23.0 28.0 33.0 38.0 43.0 48.0 53.0 58.0
Pooled control site cumulative precipitation (in.) - Oct. 15-Apr. 15
Operations Summary
Payette
Water (April‐July) % % TC** Silver Iodide (grams) Hours
Status
Y
Year N
Normal* l* B
Benefit
fit Total
T t l AirAi Ground
G d Ai
Air Ground
G d
2003 93% 16% 33558 23270 10288 15.4 515 start‐up (Feb‐April)
2004 74% 5% 21485 2803 18682 11.9 930 assessment
***
2005 65% 25% / 7% 27301 11122 16179 50.5 810 assessment
2006 136% 15% 113173 97710 15463 48.5 768 operational
2007 56% 10% 106082 76980 29102 51.3 1351 operational
2008 105% 16% 61147 38740 22407 29.4 1123 operational
2009 91% 15% 50274 26110 24164 17.1 1208 operational
2010 89% 25% 49823 30090 19733 17 987 operational
* Unregulated Payette Apr
Apr‐Jul
Jul volume at Horseshoe Bend '71‐'00
'71 '00 (USBR)
** TC = Target Control
*** DRI Trace chemistry average benefit
Seeding Summary All Years_10.xlsx
19Benefit Estimation
Payette
• IPC has used 3 approaches to assess benefits since DRI’s
assessment:
t
1. USBR Run-off regression equations
2. Streamflow comparison
3. Watershed modeling using IPCRFS forecasting model
USBR Regression
• USBR Equations use precipitation and SWE as input to predict
runoff
ff att specific
ifi locations.
l ti
• Target control analysis indicates precipitation increases ranging
from 5% to 16% (average over 6 years of 13%*).
• Assuming a precipitation increase of 10% from cloud seeding
results in an average of approximately 120 KAF of additional
April – July runoff at Horseshoe Bend.
*dropped highs from dry years. Retaining all years is a 16%.
20Run-off Comparison
• After running the program for a
number of years
years, a comparison of
streamflows was possible.
• By comparing streamflows, no analysis
or assumptions regarding precipitation
increases are necessary.
• Relative to the NF Payette, streamflows
in the SF Payette have increased an
average of 130 KAF per year
year.
• Average precipitation increase of 9%.
PRELIMINARY
Run-off Comparison
21Streamflow Modeling
IPC River Forecast System
• Additional runoff estimated using IPC’s
NWS
WS river
ve forecast
o ec s model.
ode .
• Model uses mean aerial temperature and
precipitation (MAT & MAP) by elevation
• Two scenarios…with and without cloud
seeding
• Without seeding – adjusted MAP down by
amounts indicated by target-control analysis
(observed data includes seeding)
• With seeding
di – usedd MAP bbased d on
observed data
• Streamflow increase nearly 200 KAF / year
Cost: $4.25 - $7.00/AF
Upper Snake Potential
Using the IPCRFS:
• Assumes 10% winter
precipitation increase (Oct
– Mar)
• Local unregulated flows
• Average increase in runoff
over period ‘49 to ’09
• DRAFT Results
22Upper Snake Opportunities
• IPC will have 16 remote generators in upper Snake this winter.
• Conduct Phase II feasibility study in Salt and Grays drainages.
– Data collection – weather balloons, radiometer, weather station
– Modeling evaluation with NCAR
Example Modeling
Results
WRF-RTFDDA Trajectory/Cloud Water Map (2 April
2010)
23Questions?
24You can also read