Newfoundland and Labrador Hurricane Season Outlook 2021
←
→
Page content transcription
If your browser does not render page correctly, please read the page content below
Newfoundland and Labrador Hurricane
        Season Outlook 2021

                          Submitted to:
            Water Resources Management Division
        Department of Environment and Climate Change
           4th Floor, West Block, Confederation Building
               PO Box 8700, St. John’s, NL A1B 4J6

                          Submitted by:
        Wood Environment & Infrastructure Solutions,
                        133 Crosbie Road
                          PO Box 13216
                      St. John’s, NL A1B 4A5

                          June 1st, 2021
                   Wood Project #: ME2112703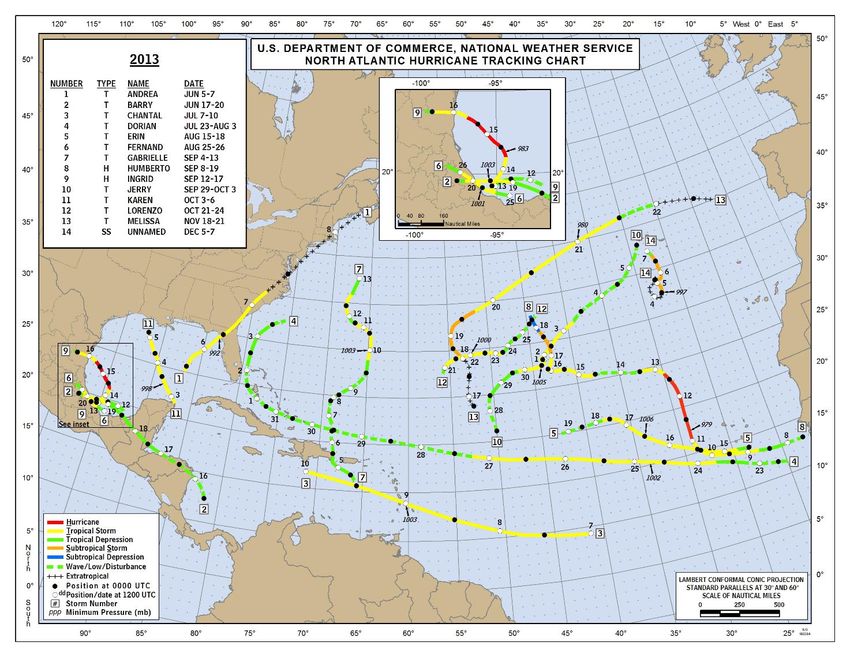
Hurricane Season Outlook 2021
                                                                 NL Water Resources Management Division

                                     Important Notice

              This report was prepared exclusively for Water Resources
              Management Division Department of Environment and Climate
              Change by Wood Environment & Infrastructure Solutions. The
              quality of the information, conclusions and estimates contained
              herein is consistent with the level of effort involved in Wood services
              and based on: i) information available at the time of preparation, ii)
              data supplied by outside sources and iii) the assumptions,
              conditions and qualifications set forth in this report. This report is
              intended to be used by Water Resources Management Division
              Department Environment and Climate Change only, subject to the
              terms and conditions of its contract with Wood. Any other use of,
              or reliance on, this report by any third party is at that party’s sole
              risk.

| June 2021                                                                                   Page 2 of 18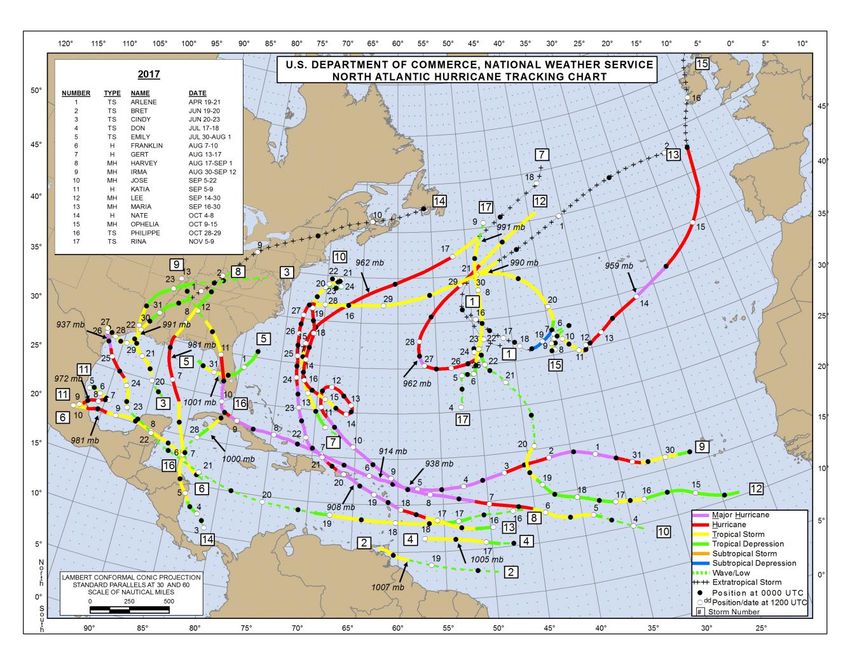
Hurricane Season Outlook 2021
                                                                                                                           NL Water Resources Management Division

                                                                                 Table of Contents

              Atlantic Hurricane Season Outlook 2021 ......................................... 4

              Historical Newfoundland and Labrador Hurricane Season .......... 10

              Analog Years and Historical Tracks ................................................. 12

              Newfoundland and Labrador Hurricane Season Outlook 2021 ... 17

              Closure............................................................................................... 18

                                                                                   Table of Figures

Figure 1. Nino Regions. ............................................................................................................................................................................ 5
Figure 2. ENSO Probability Forecast (©IRI/CPC). ........................................................................................................................... 6
Figure 3. Global SST Anomaly on April 27th (above) and May 30th (below), 2021. The red boxes show the
MDR region and the purple boxes show the Niño 3.4 region (©NOAA). ........................................................................... 8
Figure 4. Tropical storm frequency by year for Newfoundland and Labrador between 1901 and 2020. .............10
Figure 5. Tropical storm frequency by month for Newfoundland and Labrador between 1901 and 2020. ........11
Figure 6. Newfoundland tropical cyclone probability using the 1886-2016 historical track (©FSU). ....................12
Figure 7. Upper air (500 hPa) Geopotential Heights (m) composite anomaly (1981-2010 climatology) for June
through November of the analogy years (2007, 2005, 1995) (©NOAA). ...........................................................................13
Figure 8. North Atlantic Hurricane Tracking Chart (2007) (©NHC). .....................................................................................14
Figure 9. North Atlantic Hurricane Tracking Chart (2005) (©NHC). .....................................................................................15
Figure 10. North Atlantic Hurricane Tracking Chart (1995) (©NHC). ..................................................................................16
Figure 11. Newfoundland and Labrador Hurricane Season Risk Map. ...............................................................................17

Table 1. Atlantic basin 2021 hurricane forecast by NOAA, CSU, and TSR. .......................................................................... 4

| June 2021                                                                                                                                                                       Page 3 of 18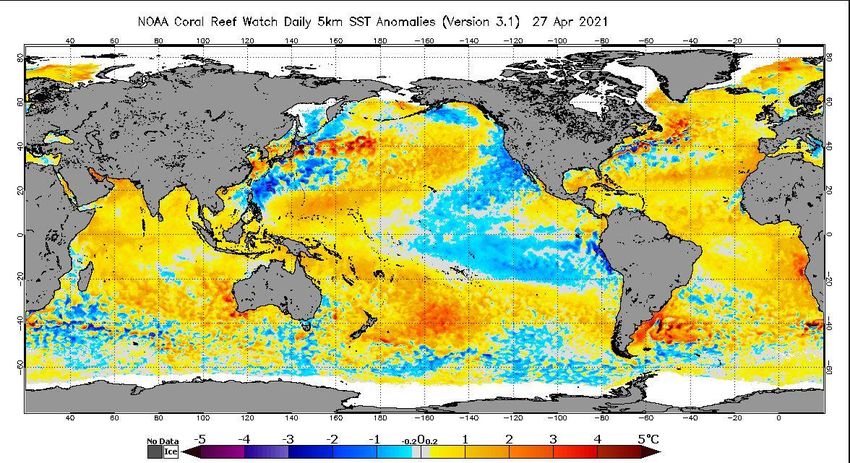
Hurricane Season Outlook 2021
                                                                NL Water Resources Management Division

              Atlantic Hurricane Season Outlook 2021
June 1st marks the beginning of the Atlantic hurricane season. Although the season stretches
for the period between June 1st to November 30th, hurricanes and tropical storms can form
prior to or beyond that period. Nevertheless, the season’s climatological activity peak occurs
around September 10th each season.
There are numerous sources of weather data used in this hurricane outlook. The major
sources are based on the prediction of the El Niño-Southern Oscillation (ENSO) condition,
Sea Surface Temperatures (SSTs) model prediction, and weather patterns. The ENSO
condition forecast has limited long-range skills. Models also have limited long-range skill in
predicting SSTs, vertical wind shear, moisture availability, stability, and predicting weather
patterns. The seasonal weather pattern prediction is an outlook to an overall season, but it
does not convey the daily and weekly changes in the pattern. The short-term variability in
the weather pattern plays a major role in the development, intensification, and track of
tropical storms and hurricanes. Furthermore, the intensity and duration of the predicted
tropical storms and hurricanes can occur under different combinations of climatic signals,
which amplifies the uncertainty of such predictions.
Several agencies issue an Atlantic hurricane season outlook, including the National Oceanic
and Atmospheric Administration (NOAA), Colorado State University (CSU), and the Tropical
Storm Risk Center (TSR). The NOAA’s 2021 Atlantic Hurricane Seasonal Outlook predicts an
above-normal season (60%), followed by a 30% chance of near-normal season and a 10%
chance of a below-normal season. Colorado State University (CSU) predicts above-normal
activity. It is worth noting that the NOAA uses a 30-year (1981-2010) based-climatology and
the CSU has updated their 30-year climatology to include (1991-2020). Meanwhile, Tropical
Storm Risk (TSR) predicts that the 2021 Atlantic hurricane season is expected to be 25-30%
above the long-term (1950-2020) normal and 5-10% above the recent (2010-2020) ten-year
normal. Table 1 below summarizes the prediction from each source.

                     Table 1. Atlantic basin 2021 hurricane forecast by NOAA, CSU, and TSR.

                                           NOAA              CSU              TSR
                   Named Storms            13-20              17               18
                    Hurricanes              6-10              8                 9
                  Major Hurricanes           3-5              4                 4

The El Niño-Southern Oscillation (ENSO) is a measure of the SST anomaly in different Niño
regions in the equatorial Pacific, as seen in Figure 1. The neutral phase is determined when
the Niño 3.4 region is within ±0.5 °C. La Niña and El Niño are terms used when the Niño
3.4 region is in the negative and positive phases, respectively.

| June 2021                                                                                   Page 4 of 18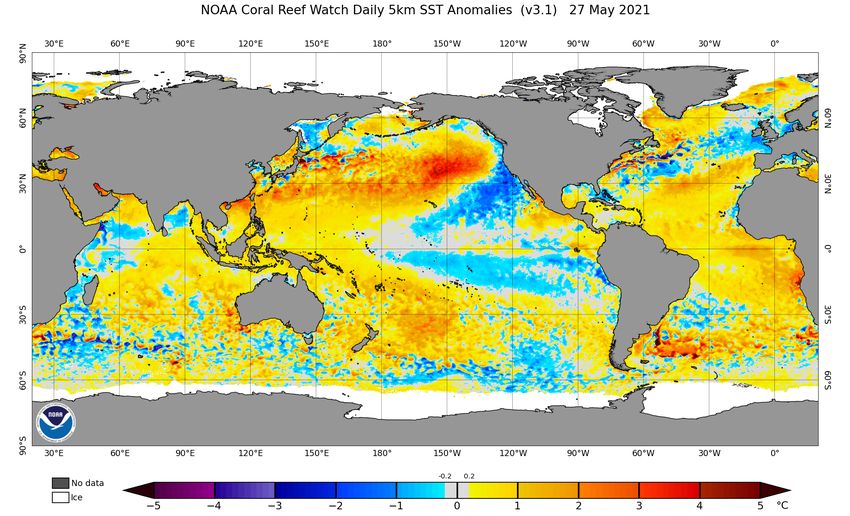
Hurricane Season Outlook 2021
                                                            NL Water Resources Management Division

                                        Figure 1. Nino Regions.

The La Niña phase is climatologically associated with weaker vertical wind shear, weaker
trade winds, and increased atmospheric instability across the Atlantic basin, which in turn
helps the overall organizational structure of any tropical storm. Meanwhile, the El Niño
phase suppresses storm organization due to stronger wind shear, stronger trade winds,
and greater atmospheric stability across the Atlantic basin. It is also worth noting that both
ENSO phases have opposite effects on the Pacific and Atlantic basins.

Figure 2 shows the probabilistic ENSO forecast based on the Niño 3.4 SST anomaly. The
figure shows that Neutral ENSO conditions are more favourable through part of this
summer, but the uncertainty in determining the Niño 3.4 SST phase increases as we head
into fall. The figure shows the probability of Neutral conditions decreases this fall with an
increasing chance of La Niña conditions. The end of the hurricane season favours La Niña
conditions, but there exists a chance of the neutral phase still being most dominant. This is
an indication of model uncertainty.

Most of the ENSO models are favouring Neutral ENSO conditions for this summer with a
wider uncertainty envelope for this fall. This trend is reflected in the above-normal Atlantic
basin hurricane season activity discussed earlier.

| June 2021                                                                            Page 5 of 18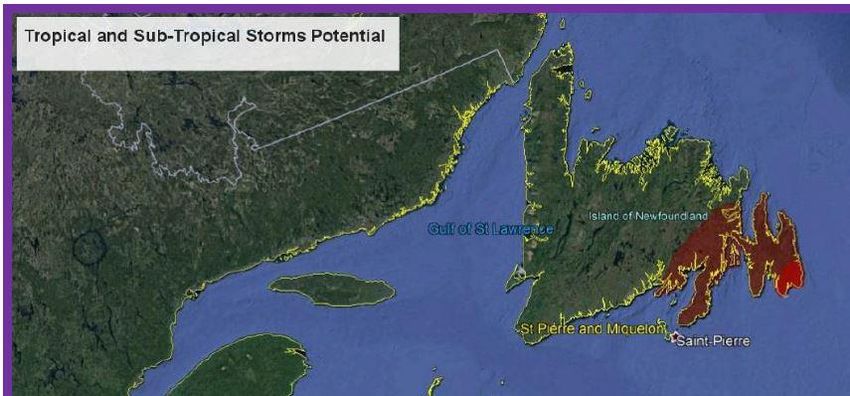
Hurricane Season Outlook 2021
                                                                             NL Water Resources Management Division

                                      ENSO state based on NINO 3.4 SST Anomaly
                                                    Neutral ENSO: +/- 0.5℃
                            80
                                70
              Probability (%)

                                60
                                50
                                40
                                30                                                                   La Niña
                                 20
                                 10                                                                  Neutral
                                  0
                                                                                                     El Niño

                                                       Time Period

                                            Figure 2. ENSO Probability Forecast (©IRI/CPC).

Hurricane season predictions consider the various and complex interactions of intra-
seasonal variables such as the ENSO and Atlantic Multidecadal Oscillation (AMO), Madden-
Julian Oscillation (MJO), mid-level moisture, and Atlantic sea level pressure and upper air
patterns. The MJO is an index that measures the variability (1 to 3 months) in the tropical
atmosphere. The AMO is a model that measures the decadal SST variability in the Atlantic
basin. The current positive phase of the AMO (above normal SST in the North Atlantic) is
conducive to lower surface pressures and moist atmospheric mid-levels over the tropical
Atlantic.

| June 2021                                                                                             Page 6 of 18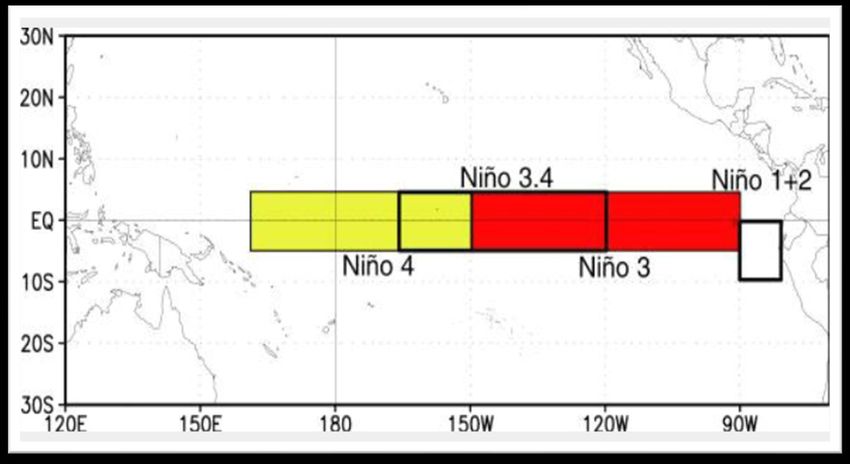
Hurricane Season Outlook 2021
                                                            NL Water Resources Management Division

The latest SST observation (Figure 3) shows a slight warming trend in the tropical Atlantic,
near the Main Development Region (MDR), 10-20 °N, and 60-20 °W (red boxes). The figure
also shows slight cooling within the Atlantic tropics between April 27th and May 27th. Such
relatively cooler temperatures are expected to be associated with drier mid-levels and higher
surface pressure in the tropical Atlantic, which in turn decreases the formation of tropical
cyclones, at least in the early part of the season. The slightly cooler anomaly in the tropical
Atlantic correlates with a weak negative phase of AMO. There is some disagreement between
the agencies on the AMO phase, given that the colder SSTs in the North Atlantic, near
Newfoundland, are usually more associated with the negative phase of the AMO, as noted
by CSU.
The increased cooling trend in the mid-Atlantic basin is of interest, especially in the main
Canadian Bioregions. This could be attributed to the combination of the strength of the
Labrador Current and the cooler air temperatures that affected the Atlantic in May.
Concurrently, there is an increase of SST in the same region due to the Gulf Stream.
Historically, the cooling trend in the Canadian Bioregions is likely to subside by July-August
and be replaced with warmer SST. The current below-normal SST in the Canadian Bioregions
is likely to negatively affect any tropical activity or storm intensifications in Atlantic Canada
for the time being.
Figure 3 also shows the near-normal SST anomaly in the Niño 3.4 region, especially just
north of the equator and can also be noticed in Figure 3 (purple boxes) between April 27th
and May 27th. But it should be noted that this trend is not stable, rather perturbed at the
current time due to the upwelling process in the Niño 1+2 (Figure 1).
Figure 3 also shows a cooling trend in the Gulf of Mexico. This trend is likely due to the
weather patterns that affected that area during May that brought an ample amount of
precipitation.

| June 2021                                                                            Page 7 of 18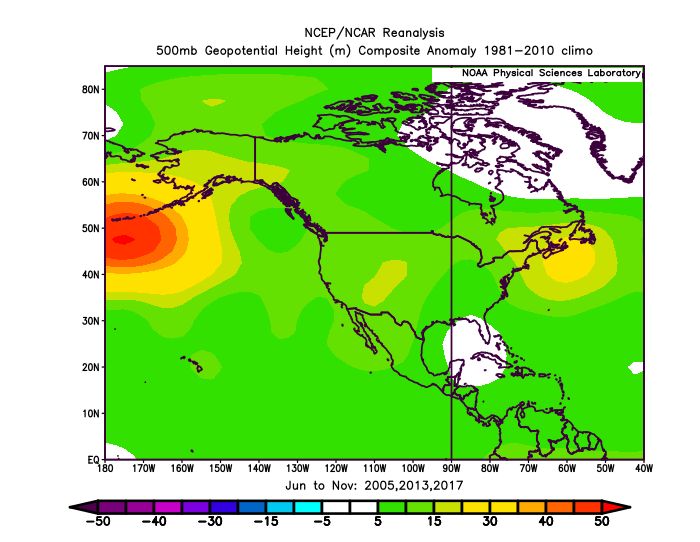
Hurricane Season Outlook 2021
                                                                 NL Water Resources Management Division

              Figure 3. Global SST Anomaly on April 27th (above) and May 27th (below), 2021. The red
               boxes show the MDR region and the purple boxes show the Niño 3.4 region (©NOAA).

| June 2021                                                                                 Page 8 of 18
Hurricane Season Outlook 2021
NL Water Resources Management Division
The latest models are consistently showing warmer SST anomaly in the MDR region and
drier conditions across the southern African Sahel region throughout this fall. Perhaps the
only exception is the few wet periods across the southern African Sahel Region in July and
part of August. Although the warmer SST can fuel thunderstorm clusters, which could
eventually lead to tropical storms, below-normal precipitation in the southern African Sahel
Region can deter the development of troughs that ultimately aid in storm development off
the coast of Africa.
The Wood Seasonal Outlook Team is anticipating an above-normal Atlantic Hurricane
Season. The anticipated SST perturbation in the Niño 3.4 region is likely to bring a noticeable
monthly variation to the tropical wave activity. The Team also predicts that the main threat
of tropical storm development would be on the western Atlantic and the Gulf of Mexico.
Such storms are likely to develop and be fueled by the weather patterns and anomalous
warmer SSTs, respectively.
| June 2021 Page 9 of 18Hurricane Season Outlook 2021
NL Water Resources Management Division
Historical Newfoundland and Labrador Hurricane Season
The archive records from the National Hurricane Centers and the Canadian Hurricane Center
records show Newfoundland being impacted by a higher number of tropical storms than
Labrador, as seen in Figure 4. The figure shows the frequency of tropical storms by year for
Newfoundland and Labrador between 1901 and 2020.
Tropical Storm Frequency by Year (1901-2020)
Labrador Newfoundland
5
4
Frequency
3
2
1
0
1901
1904
1907
1910
1913
1916
1919
1922
1925
1928
1931
1934
1937
1940
1943
1946
1949
1952
1955
1958
1961
1964
1967
1970
1973
1976
1979
1982
1985
1988
1991
1994
1997
2000
2003
2006
2009
2012
2015
2018
Year
Figure 4. Tropical storm frequency by year for Newfoundland and Labrador between 1901 and
2020.
The same records reveal the month of September as the peak month for tropical storm
activity, followed by October (Figure 5).
| June 2021 Page 10 of 18Hurricane Season Outlook 2021
NL Water Resources Management Division
Tropical Storm Frequency by Month (1901-2020)
Labrador
36
33
30
27
Frequency
24
21
18
15
12
9
6
3
0 Labrador
Jan Feb Mar Apr May Jun Jul Aug Sep Oct Nov Dec
Labrador 0 0 0 0 0 0 4 3 10 0 1 0
Newfoundland 0 0 0 0 0 4 10 12 34 16 1 0
Figure 5. Tropical storm frequency by month for Newfoundland and Labrador between 1901
and 2020.
Figure 6 shows the Florida State University (FSU) probabilistic tropical cyclones trekking over
Newfoundland using 1886-2019 historical data. Storms that affect Newfoundland most
regularly approach from the south-southwest and generally pass near or west of Bermuda
before arriving on the Newfoundland Coast.
| June 2021 Page 11 of 18Hurricane Season Outlook 2021
NL Water Resources Management Division
Figure 6. Newfoundland tropical cyclone probability using the 1886-2019 historical track
(©FSU).
Analog Years and Historical Tracks
The Niño 3.4 region SST was in the neutral, negative phase (-0.5°C) throughout April 2021.
There has been little evidence of upwelling in May and the region’s SST remains mostly
unchanged and still in the neutral phase (-0.5°C). The upwelling process is likely to be
intermittent at times, thus, producing a perturbed SST in that region and affecting the
weather patterns in the Atlantic Basin.
Given the projected ENSO conditions, the best analog years are 2005, 2013, and 2017. Figure
7 shows the upper air (500 hPa) geopotential height (m) composite anomaly based on 1981-
2010 climatology for the period from June and through to November for the combined
analog years. The main features in this figure are the anomalously lower heights over NWT
and Nunavut, higher heights over Atlantic Canada, and the lower heights over the Atlantic
Basin tropics. The progressive weather pattern from west to east is expected to enable the
lower heights over NWT and Nunavut to intrude into Atlantic Canada and thus paving the
| June 2021 Page 12 of 18Hurricane Season Outlook 2021
NL Water Resources Management Division
way for any developed storm to track through Atlantic Canada.
Figure 7. Upper air (500 hPa) Geopotential Heights (m) composite anomaly (1981-2010
climatology) for June through November of the analogy years (2005, 2013, 2017) (©NOAA).
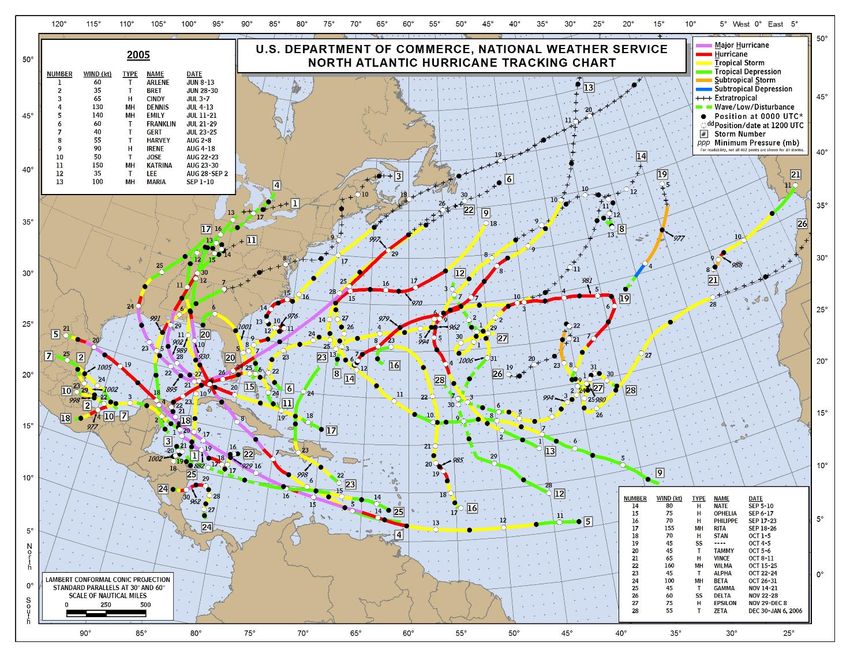
The hurricane track charts for the analog years are given in Figures 8 to 10. Generally, the
analog years are depicting an above-normal hurricane season with numerous storms
tracking into Atlantic Canada and affecting Newfoundland and Labrador.
The extratropical storms that had a direct impact on Newfoundland and Labrador were
Ophelia (Sep 2005) and Nate (Oct 2017). No impact was recorded in 2013. The center of the
remnant low pressure of post-tropical storm Andrea dissipated just south of Newfoundland
on Sep 13, 2013.
| June 2021 Page 13 of 18Hurricane Season Outlook 2021
NL Water Resources Management Division
Figure 8. North Atlantic Hurricane Tracking Chart (2005) (©NHC).
| June 2021 Page 14 of 18Hurricane Season Outlook 2021
NL Water Resources Management Division
Figure 9. North Atlantic Hurricane Tracking Chart (2013) (©NHC).
| June 2021 Page 15 of 18Hurricane Season Outlook 2021
NL Water Resources Management Division
Figure 10. North Atlantic Hurricane Tracking Chart (2017) (©NHC).
| June 2021 Page 16 of 18Hurricane Season Outlook 2021
NL Water Resources Management Division
Newfoundland and Labrador Hurricane Season Outlook 2021
The Nino 3.4 region has experienced pockets of warmer SSTs in early March, eventually
caused a fluctuation in the daily SSTs. These pockets were able to further weaken the La Nina
setup earlier in the year. The three-month average (Feb-Mar-Apr) SSTs in the Nino 3.4 region
indicated a weak La Niña that, although fluctuated from Mar-May, continued weakening
further. The latest daily SSTs indicate a neutral phase of ENSO. Wood is anticipating this
neutral phase to continue throughout this summer, but it is likely to remain in the negative-
neutral phase and continue to oscillate. The projected oscillating SST is likely to provide
preferable conditions for storm formation or leading to the weakening/strengthening of
developing tropical storms.
The western North Atlantic SSTs also depicted an oscillating pattern from above-normal in
March, to below-normal in part of April, above normal in early May, below-normal in mid-
May, before bouncing to be above-normal in late May. This region is likely to continue
exhibiting such SST oscillation through part of this summer.
Wood anticipates an above-normal Atlantic Hurricane season and a normal to slightly
above-normal storm track across Atlantic Canada, specifically affecting Newfoundland and
Labrador with extratropical storms. There is a moderate risk of a tropical storm and a low
risk of a hurricane making landfall in Newfoundland. Figure 11 depicts the associated risk
area. There is a risk of winds gusting up to 140 km/h and 100-130 mm of rainfall associated
with any hurricane making landfall.
Figure 11. Newfoundland and Labrador Hurricane Season Risk Map.
| June 2021 Page 17 of 18Hurricane Season Outlook 2021
NL Water Resources Management Division
Closure
We trust that this report meets your needs. Please do not hesitate to contact the author if you have any
questions or comments regarding the hurricane season outlook.
Yours sincerely,
Wood Environment & Infrastructure Solutions
Robert Giglio
Forecast Lead/Meteorologist
Reviewed by:
Dr. Diar Hassan
Sr. Scientist, Product and Business development
Digitally signed by
chris.innes
DN: cn=chris.innes
Date: 2021-06-02
17:44-04:00
J. Chris Innes
Discipline Lead, Met-Ocean Services
| June 2021 Page 18 of 18You can also read