HYDROLOGY OF THE UPPER GANGA RIVER - International Water Management Institute

Page created by Ted Keller
 
CONTINUE READING
HYDROLOGY OF THE UPPER GANGA RIVER - International Water Management Institute
HYDROLOGY OF THE UPPER GANGA RIVER

                                  Bharati L. and Jayakody, P

                      International Water Management Institute

Introduction

The Ganga River Basin covers 981,371 km2 shared by India, Nepal, China (Tibet) and
Bangladesh. The River originates in Uttar Pradesh, India from the Gangrotri glacier, and has
many tributaries including the Mahakali, Gandak, Kosi and Karnali which originate in Nepal
and Tibet. The focus of the present study is on the Upper Ganga - the main upper main
branch of the River. The UpperGanga Basin (UGB) was delineated by using the 90m SRTM
digital elevation map with Kanpur barrage as the outlet point (Figure 1). The total area of the
UGB is 87,787 km2. The elevation in the UGB ranges from 7500 m at upper mountain region
to 100 m in the lower plains. Some mountain peaks in the headwater reaches are permanently
covered with snow. Annual average rainfall in the UGB is in the range of 550-2500mm. A
major part of the rains is due to the south-western monsoon from July to October.

The main river channel is highly regulated with dams, barrages and corresponding canal
systems (Figure 1). The two main dams are Tehri and Ramganga. There are three main canal
systems. The Upper Ganga G Canal takes off from the right flank of the Bhimgoda barrage
with a head discharge of 190 m3/s, and presently, the gross command area is about 2 mill ha.
The Madhya Ganga canal takes off from the Ganga at Raoli barrage near Bijnor and provides
annual irrigation to 178,000 ha. The Lower Ganga canal comprises a weir across the Ganga at
Naraura and irrigates 0.5 million ha.

To provide the background hydrological information for the assessment of environmental
flow requirements at four selected ‘Environmental Flow’ (EF) sites, a hydrological model
was set up to simulate the catchment in the present state (with water regulation infrastructure)
and to generate the natural flows (without water regulation infrastructure). The report further
summarizes the hydrological information at these sites using a series of graphs which illustrate
annual runoff variability, seasonal flow distribution, 1-day flow duration curves and daily flow
hydrographs for one wet and one dry year. The document also contains a table, which lists some
typical flow characteristics at EF sites on a month-by-month basis: range of expected baseflow
discharges, number, magnitude and duration of flood events.
.

                                                                                              1
HYDROLOGY OF THE UPPER GANGA RIVER - International Water Management Institute
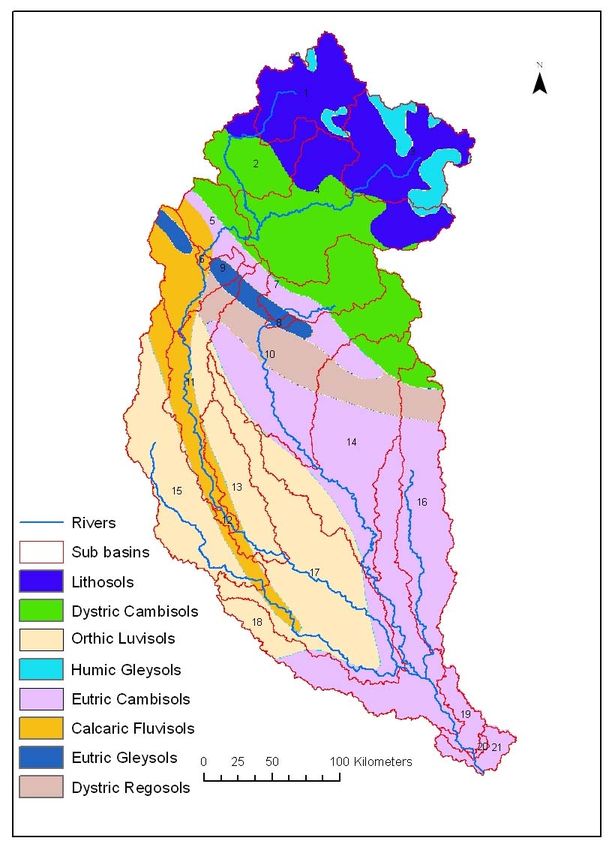
Figure 1: A map of the Upper Ganga River catchment showing the boundaries of the UGB,
location of the barrages, reservoirs, EF sites and observed data points used in the study

                                                                                       2
HYDROLOGY OF THE UPPER GANGA RIVER - International Water Management Institute
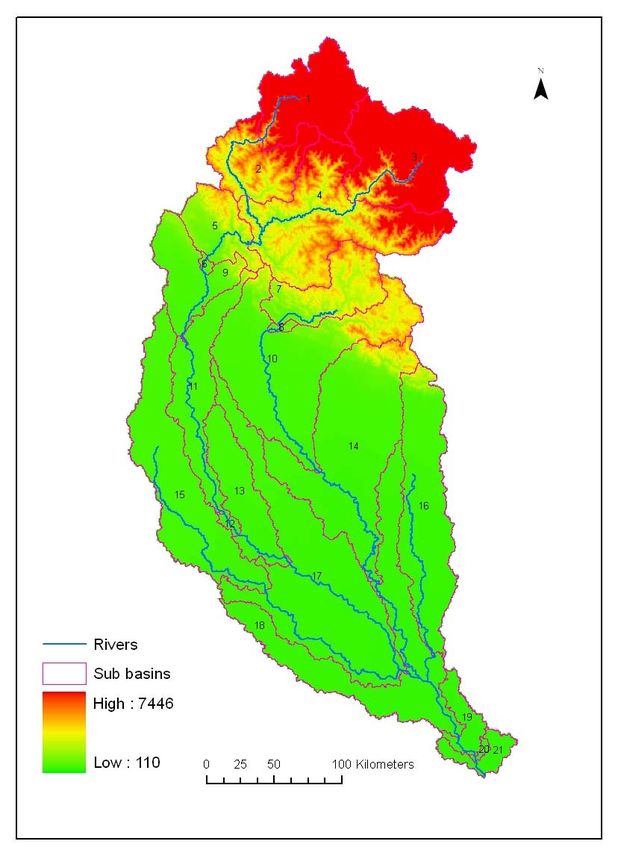
Description of the Soil and Water Assessment tool (SWAT)

SWAT is a process-based continuous hydrological model that predicts the impact of land
management practices on water, sediment and agricultural chemical yields in complex basins
with varying soils, land use and management conditions (Arnold et al., 1998; Srinivasan et
al., 1998). The main components of the model include: climate, hydrology, erosion, soil
temperature, plant growth, nutrients, pesticides, land management, channel and reservoir
routing.

Conceptually SWAT divides a basin into sub-basins. . Each sub-basin is connected through a
stream channel and further divided in to Hydrologic Response Unit (HRU). HRU is a unique
combination of a soil and a vegetation type in a sub watershed, and SWAT simulates
hydrology, vegetation growth, and management practices at the HRU level. Following
paragraphs describe the model functionality with respect to individual component of the
hydrological cycle.

The hydrologic cycle as simulated by SWAT is based on the water balance equation:
                                          n
                        SW t  SW o      (R
                                         i 1
                                                day    Q surf  E a  w seep  Q gw )      (1)

Where,

         SWt      :    Final soil water content (mm)
         SWo     :     Initial soil water content (mm)
         t       :     Time in days
         Rday    :     Amount of precipitation on day i(mm)
         Qsurf   :     Amount of surface runoff on day i (mm)
         Ea      :     Amount of evapotranspiration on day i (mm)
         wseep   :     Amount of percolation on day i (mm)
         Qgw     :     Amount of return flow on day i (mm)

Since the model maintains a continuous water balance, the subdivision of the basin enables
the model to reflect differences in evapotranspiration for various crops and soils. Thus runoff
is predicted separately for each sub-basin and routed to obtain the total runoff for the basin.
This increases the accuracy and gives a much better physical description of the water balance.
More detailed descriptions of the model can be found in Arnold et al. (1998) and Srinivasan
et al. (1998).

Model Setup

SWAT requires three basic files for delineating the basin into o sub-basins and HRUs: Digital
Elevation Model (DEM), Soil map and Land Use/Land Cover (LULC) map. Figure 2 shows
the DEM for the basin using 90m Shuttle Radar Topography Mission (SRTM) data. Figure 3
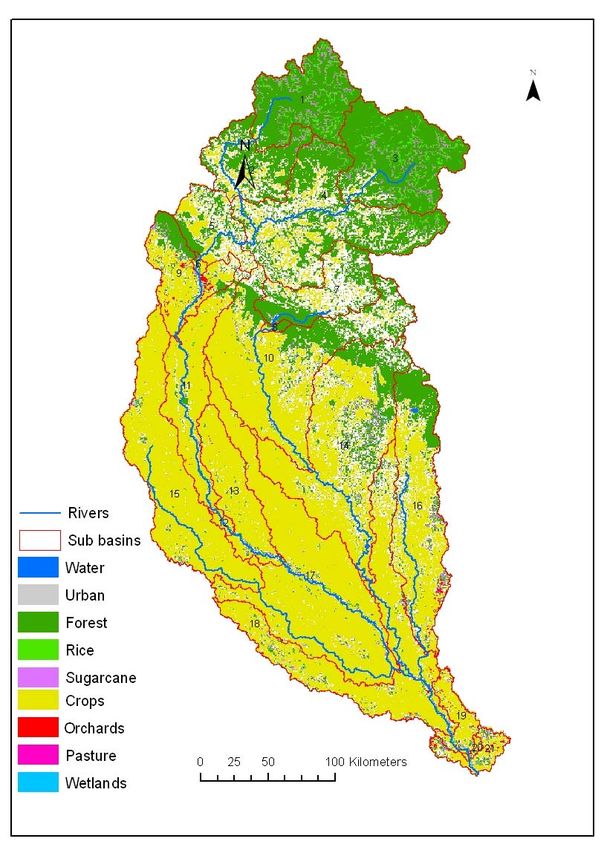
shows the land use map which was developed using the LandSat TM image from 2003.
Around 65% of the basin is occupied by agriculture. The main crop types are wheat, maize,
rice, sugarcane, bajra and potato. Around 25% of the land is covered by forests and mostly
appears in the upper mountains. Figure 4 shows the soil map for the basin. There are eight
soil types; Lithosols dominate the upper, steep mountainous areas and are very shallow and
erodible soils. Cambisols and Luvisols are found in the lower areas. Cambisols are developed
                                                                                           3
HYDROLOGY OF THE UPPER GANGA RIVER - International Water Management Institute
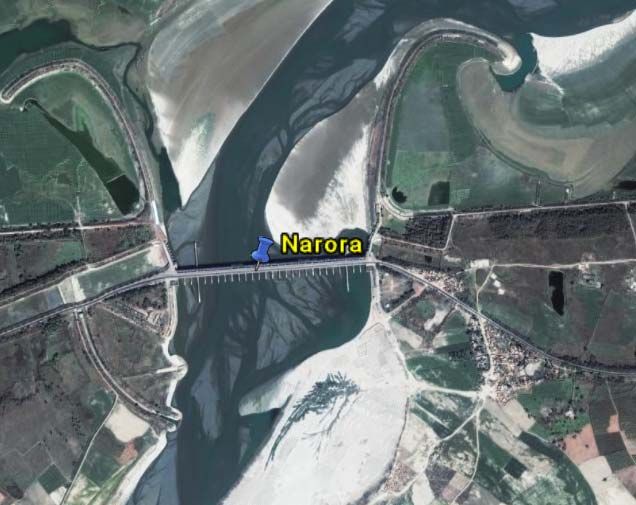
in medium and fine textured material derived from alluvial, colluvial and aeolian deposits.
Most of these soils make good agricultural land. Luvisols are tropical soils most used by
farmers because of its ease of cultivation but they are greatly affected by water erosion and
loss in fertility.

Figure 2: Digital Elevation model of the UGB with numbers and boundaries of sub-
catchments used in hydrological simulations

                                                                                           4
HYDROLOGY OF THE UPPER GANGA RIVER - International Water Management Institute
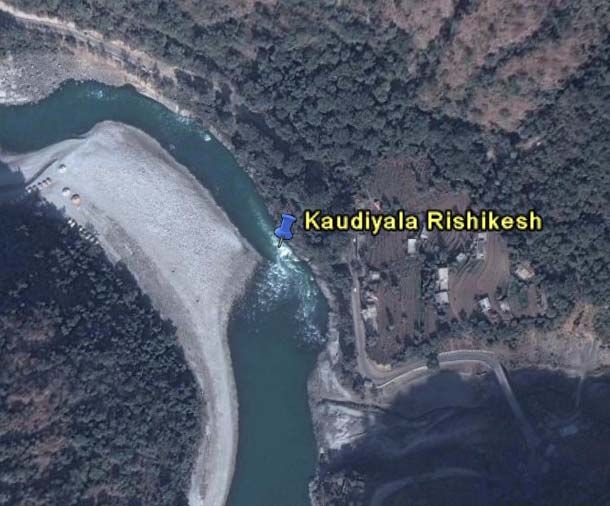
Figure 3: Land use map (2003) of UGB

                                       5
HYDROLOGY OF THE UPPER GANGA RIVER - International Water Management Institute
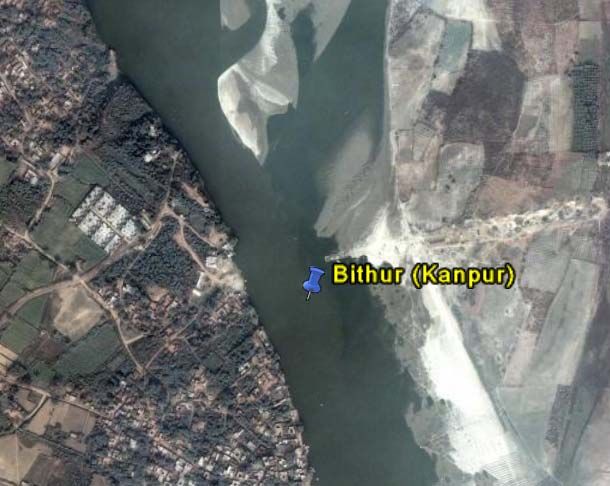
Figure 4: Soil map of the UGB based on FAO data

Available observed time series data

SWAT requires time series of observed climate data i.e. rainfall, minimum and maximum
temperature, sunshine duration, wind speed and relative humidity. Table 1 lists the climate
stations used for simulations and the location of stations can be seen in Figure 1. Data from
the climate stations are spatially interpolated by the model to produce a gridded map of
                                                                                            6
HYDROLOGY OF THE UPPER GANGA RIVER - International Water Management Institute
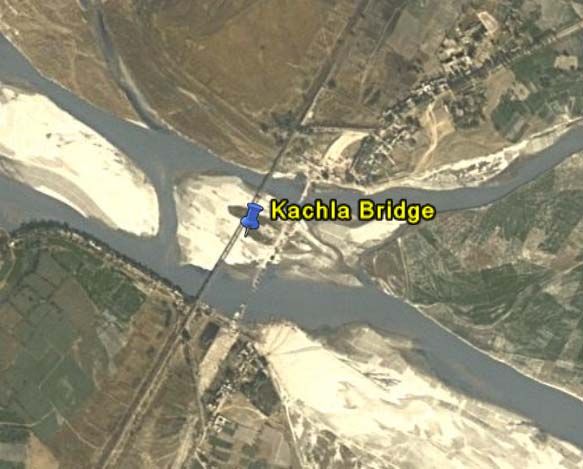
climate input. The upper parts of the basin are mountainous with peaks and valleys therefore,
the interpolated climate data may not be able to capture micro-climate variability, typical of
mountainous regions. Furthermore, there are no climate stations in the Northwest part of the
basin where there are high mountains. Therefore, the rainfall may be overestimated due to
interpolation from stations in lower elevations with higher rainfall values. Contribution of
glacier melt was not considered in the modeling due to a lack of glacier melt data.

Table 1: Details of the data at meteorological stations in the UGB

Station                  Available Record       Available Data Type
          Location
Code
                                                Rainfall, Minimum and Maximum temperature, Sunshine
42111     Dehradun*      1970-2005
                                                duration, Wind Speed, Relative Humidity
                                                Rainfall, Minimum and Maximum temperature, Sunshine
42103     Ambala*        1970-2004
                                                duration, Wind Speed, Relative Humidity
                                                Rainfall, Minimum and Maximum temperature, Sunshine
8207      Simla*         1989-2005
                                                duration, Wind Speed, Relative Humidity
                                                Rainfall, Minimum and Maximum temperature, Sunshine
42140     Roorkee*       1970-1994; 2002-2005
                                                duration, Wind Speed, Relative Humidity
                                                Rainfall, Minimum and Maximum temperature, Sunshine
42182     Delhi*         1970-2005
                                                duration, Wind Speed, Relative Humidity

42366     Kanpur         1970-1974, 1986-1995   Rainfall and Temperature only

42471     Fatehpur       1970-2005              Rainfall and Temperature only
                         1970-2005              Rainfall, Minimum and Maximum temperature, Sunshine
42189     Bareilly*                             duration, Wind Speed, Relative Humidity

42260     Agra           1970-2005              Rainfall and Temperature only

          Aligarh        1970-2005              Rainfall and Temperature only
42262
                                                Rainfall, Minimum and Maximum temperature, Sunshine
42143     Najibad*       1970-2005
                                                duration, Wind Speed, Relative Humidity
                                                Rainfall, Minimum and Maximum temperature, Sunshine
42147     Mukteshwar* 1970-2005                 duration, Wind Speed, Relative Humidity
                                                Rainfall, Minimum and Maximum temperature, Sunshine
42148     Pant Nagar*    1970-2005
                                                duration, Wind Speed, Relative Humidity

42265     Mainpuri       1970-2005              Rainfall, Temperature and Wind Speed only

42665     Shajapur       1970-2005              Rainfall, Temperature and Wind Speed only
*Significant missing values

Table 2 presents details of the flow stations used for calibration and validation of the model.
Their locations are shown in Figure 1. Due to the restrictions on Ganga data from the Central
Water Commission (CWC), only a very short time series of data at some barrages were
available. The observed flow data except for one site (Narora) are monthly time series, while
the model works with daily time step. Simulated daily flow values therefore, have to be
accumulated into monthly for comparison. This created additional uncertainty. Also, the
quality of the observed data could not be ascertained. Therefore the model was set up and
                                                                                                      7
HYDROLOGY OF THE UPPER GANGA RIVER - International Water Management Institute
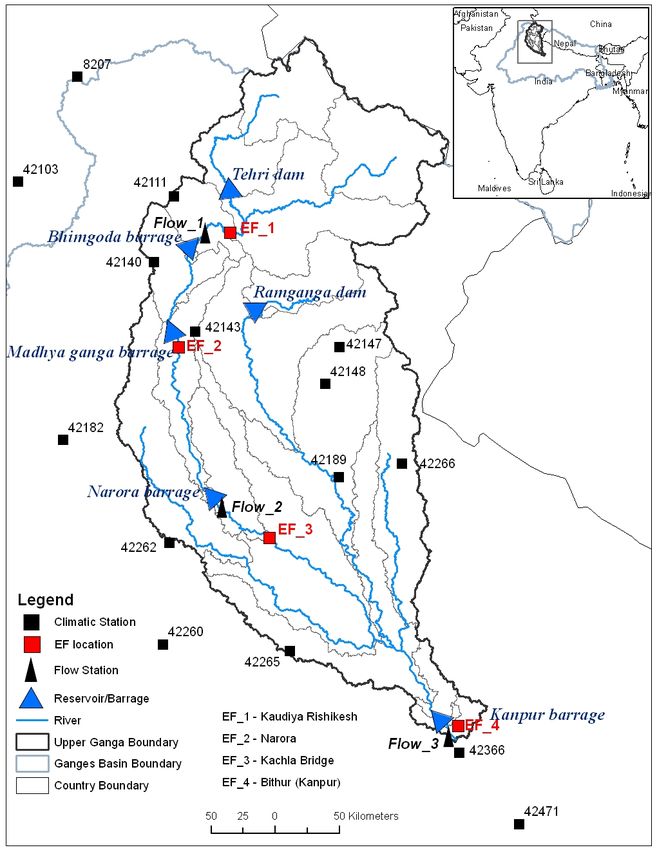
calibrated in the conditions of extreme lack of reliable observations. The use of data from
additional flow gauging stations would have greatly increased the reliability of the model
simulations. The existing dams, barrages and irrigation deliveries were incorporated in the
model.

Table 2: Details of the flow stations and data available for calibration of the model

Station code    Location     Catchment           Available               Type of data              Gauged
                             Area, km2            Record                                          MAR as %
                                                                                                  of natural
Flow_1         Bhimgoda       23,080        2002April-2005       Monthly inflow to the Barrage        59
                                            December
Flow_2         Narora         29,840        2000 Jan -2005       Monthly spill release from the        57
                                            June                 dam
Flow_3         Kanpur         87,790        2002 June – 2005     Monthly Spill release from the        77
                                            December             dam excluding dry season
                                                                 flows

SWAT Model Calibration and Validation

Table 3 presents the calibration and validation period considered for the model simulation
according to available observed flow data at the three flow sites. The period from 1st Jan 1970
to beginning of calibration period is considered as a warn-up period for simulation. Model
parameters were calibrated simultaneous for the all three flow stations. The model was
calibrated in present water use condition of the basin.

Table 3: Calibration and validation period at flow sites for model simulation

Station code      Location                  Calibration Period                     Validation Period
Flow_1            Bhimgoda             1st Apr 2002 – 31st Dec 2003           1st Jan 2004 – 31 Dec 2005
Flow_2            Narora               1st Jan 2000 – 31st Dec 2002           1st Jan 2003 – 30 Jun 2005
Flow_3            Kanpur               1st Jun 2003 – 31st Oct 2003           1st Jun 2005 – 31 Dec 2005
                                       1st Jun 2004 – 31st Oct 2004

The model performance was determined by calculating coefficient of determination (R2) and
Nash-Sutcliffe Efficiency (NSE). The calculated statistics R2 are NSE in each simulation are
presented in the Table 4. The model performance was within an acceptable range according
to model performance statistics (Liu et al., 2004) in both the calibration and validation
periods.

                                                                                                            8
Table 4: Model performance statistics at flow sites for the simulation
Station      Model                    Calibration Period                            Validation Period
code       Efficiencies   Statistic       Performance Result         Statistic         Performance Result
Flow_1         R2           0.84       (0.65 – 0.85) Very Good         0.89             (> 0.85) Excellent
              NSE           0.61          (0.50 – 0.65) Good           0.81          (0.65 – 0.85) Very Good
Flow_2         R2           0.83       (0.65 – 0.85) Very Good         0.83          (0.65 – 0.85) Very Good
              NSE           0.82       (0.65 – 0.85) Very Good         0.80          (0.65 – 0.85) Very Good
Flow_3         R2           0.67       (0.65 – 0.85) Very Good         0.90             (> 0.85) Excellent
              NSE           0.69       (0.65 – 0.85) Very Good         0.95             (> 0.85) Excellent

In addition, annual water flow volume balance was also checked to get perfectness in
calibration and the results were presented in Table 5. The flow volume balance shows higher
flow difference between observed and simulated results in flow site at Bhomgoda than the
other downstream flow sites. The flow site at Kanpur is the outlet of this study basin and
where water flow difference is below than 10%. This also shows that the model was
performing quite well in terms of water flow volume.

Table 5: Annual water flow volume at flow sites for the simulation
 Station                  Calibration Period                                     Validation Period
   code      Observed        Simulated         Difference        Observed          Simulated         Difference
 Flow_1      1152 mm          1524 mm           32.3%            1017 mm            1269 mm           24.8%
 Flow_2      905 mm           1086 mm           20.0%            697 mm             790 mm            13.4%
 Flow_3      756 mm           826 mm             9.3%            622 mm             624 mm             0.3%

In average, the results of both evaluations; performance statics and water flow volume
balance; show that the model was performed better in validation periods than in calibration in
all flow sites. In overall, the model result was little bit overestimation than the observation.

Figure 5, Figure 7 and Figure 9 show observed and simulated discharges for the inflow into
the Bhimgoda barrage, the outflow from Narora barrage and outflow from Kanpur barrage.
Figure 6, Figure 8 and Figure 10 show observed and simulated cumulative water volume plot
for the inflow into the Bhimgoda barrage, the outflow from Narora barrage and outflow from
Kanpur barrage.

                                                                                                                  9
10000                                                                                                 0

                            8000                                                                                                  200

                                                                                                                                         Rainfall [mm]
Flow [m3/s]

                            6000                                                                                                  400
                                                  Calibration                                       Validation

                            4000                                                                                                  600
                                                    R2 = 0.84                                           R2 = 0.89
                                                    NSE = 0.61                                          NSE = 0.81
                            2000                                                                                                  800

                               0                                                                                                  1000
                               Jan-02    Jul-02      Dec-02       Jun-03      Dec-03      Jun-04      Dec-04     Jun-05       Dec-05
                                                      Rainfall            Observed Flow            Simulated Flow

Figure 5: Observed and simulated flows at the Bhimgoda barrage

                             3000

                             2500
   Cumulative Volume [mm]

                                                    Calibration                                         Validation
                             2000

                             1500

                             1000

                              500

                                0
                                Jan-02       Sep-02              Apr-03          Dec-03             Aug-04           Apr-05        Dec-05

                                                           Observed Volume                Simulated Volume

Figure 6: Observed and simulated cumulative flow volume at the Bhimgoda barrage

                                                                                                                                            10
10000                                                                                              0

                               8000                                                                                           200

                                                                                                                                     Rainfall [mm]
 Flow [m3/s]

                               6000                                                                                           400

                                                    Calibration                                  Validation
                               4000                                                                                           600
                                             R2 = 0.83                                                      R2 = 0.83
                                             NSE = 0.82                                                     NSE = 0.80

                               2000                                                                                           800

                                  0                                                                                           1000
                                 Jan-00    Oct-00       Aug-01        Jun-02     Apr-03       Feb-04       Dec-04    Oct-05

                                                      Rainfall          Observed Flow          Simulated Flow

Figure 7: Observed and simulated flows at the Narora barrage

                                4000

                                3500                 Calibration                                    Validation
      Cumulative Volume [mm]

                                3000

                                2500

                                2000

                                1500

                                1000

                                 500

                                      0
                                  Jan-00   Sep-00     Apr-01       Dec-01   Aug-02   Apr-03    Dec-03      Aug-04   Apr-05    Dec-05

                                                           Observed Volume              Simulated Volume

Figure 8: Observed and simulated cumulative flow volume at the Narora barrage

                                                                                                                                          11
10000                                                                                                  0

                              8000                                                                                                   200

                                                                 Calibration                                  Validation

                                                                                                                                             Rainfall [mm]
                              6000                                                                                                   400
  Flow [m3/s]

                                                                     R2 = 0.67                                    R2 = 0.90
                                                                     NSE = 0.69                                   NSE = 0.95
                              4000                                                                                                   600

                              2000                                                                                                   800

                                    0                                                                                                1000
                                    Jan-03     May-03       Oct-03         Mar-04     Aug-04        Jan-05       Jun-05     Nov-05

                                                          Rainfall            Observed Flow          Simulated Flow

Figure 9: Observed and simulated flows at the Kanpur barrage

                              800
     Cumulative Volume [mm]

                              600
                                                             Calibration                                           Validation

                              400

                              200

                                0
                                Jan-03           Jul-03              Jan-04          Jul-04          Dec-04           Jun-05             Dec-05

                                                                Observed Volume               Simulated Volume

Figure 10: Observed and simulated cumulative flow volume at the Kanpur barrage

Simulation of natural flow conditions for the four EF sites

The names and locations of the EF sites that are used in this study are listed in Table 6 and
shown in Figure 1, with Google Earth images of their environments – in Figure 11. The
selected EFR sites are representative of the different agro-ecological zones in the study river
stretch.

Table 6: Location and names of EF sites in the UGB

Site code                               Site Name                    Latitude            Longitude
EF1                                     Kaudiyala (Rishikesh)        30°04’29” N         78°30’09” E

                                                                                                                                                   12
EF2           Narora                29°22'22” N      78°2'20” E
EF3           Kachla Bridge         27°55’59” N      78°51’42” E
EF4           Bithur (Kanpur)       26°36'59” N      80°16'29” E

Figure 11: EF site locations - Google Earth images

The calibrated model was run for the period of 1970 to 2005 (36 years) and two scenarios
were considered:

         Present-day scenario- representing the most recent condition of the basin (as if these
          conditions existed during the entire simulation period of 36 years and
         Natural conditions scenario which represent minimal human intervention in the basin
          i.e. without dams and irrigation infrastructure.

In addition to presence/ absence of the water infrastructure, land use also varied between the
present day and natural conditions. Irrigated crops such as rice, wheat, corn, bajra, sugarcane,
potato represent the major crops types during present conditions. Natural conditions’
scenario is characterized by rainfed crops such as mung bean and wheat, as well as a larger

                                                                                             13
area covered in natural forest. Parameters of the model were changed accordingly to reflect
the difference between scenarios in the model.

Simulated daily flow data were then summed up at monthly and annual time steps and are
presented in the tables and figures below. The simulated data are also used to illustrate the
characteristic features of each EF site’s flow regime. The following characteristics of the flow
regime are presented in graphic form in Figures below:

      plots of annual streamflow volumes as a time series for available period
      averaged seasonal distribution of monthly flow volumes;
      annual 1-day flow duration curves;
      daily hydrographs for one wet and one dry year

Plots of annual streamflow totals allow wet, dry and intermediate years to be quickly
identified. Averaged seasonal flow distributions illustrate the mean flows, which may be
expected in each calendar month and help to identify the wettest, driest and intermediate
months. Flow duration curve is an aggregated way to illustrate the variability of daily flows
and the range of flows experienced (in this case – in natural flow conditions). Daily
hydrographs illustrate the variability of flows in specific years of different wetness.

Table 7 contains the details of some typical flow sequences at the EFR sites for each calendar
month including the range of baseflows, magnitude, number and duration of floods. This
information was obtained from visual inspection of the simulated time series for each EF site.
The ‘baseflow range’ was estimated as the range of the density of low-flow parts of the
hydrograph in each month. When the number of floods in the table is specified as
Table 7: Typical flow characteristics for EF sites (natural conditions), where flows are in m3/s and durations are in days.

                        Jan          Feb       Mar        Apr      May                Jun           Jul          Aug           Sep         Oct         Nov        Dec
EF1- Kaudiyala /Rishikesh – area : 20,800 km2 MAR (nat)**= 43,112 MCM
Range of Base Flow 238-436         440-579    577-598   429-530   433-670          681-1593     1616-3033     3063-3805     2118-3497    1002-2030    360-925   239-353
No. of Events            0             0         0         0         0
EF1 - Kaudiyala/Rishikesh
                70000

                60000
 Volume [MCM]

                50000

                40000

                30000

                20000

                10000

                    0
                        1970

                               1972

                                       1974

                                                1976

                                                       1978

                                                              1980

                                                                     1982

                                                                            1984

                                                                                   1986

                                                                                          1988

                                                                                                   1990

                                                                                                           1992

                                                                                                                  1994

                                                                                                                         1996

                                                                                                                                1998

                                                                                                                                       2000

                                                                                                                                              2002

                                                                                                                                                      2004
                                                                                     Years
                                              Annual Natural Flow Volume                  Annual Present Flow Volume

                                                              EF1 - Kaudiyala/Rishikesh
                12000

                10000
 Volume [MCM]

                 8000

                 6000

                 4000

                 2000

                    0
                          Jan         Feb         Mar         Apr     May          Jun       Jul          Aug      Sep          Oct     Nov          Dec

                                              Natural Monthly Flow Volume                 Present Monthly Flow Volume
Figure 12: Annual flow totals (top) and average monthly flow distribution (bottom) for
Kaudiyala/Rishikesh site

                                                                                                                                                             16
EF1 - Kaudiyala/Rishikesh
                  10000
    Flow [m3/s]

                  1000

                    100
                          0%                  20%              40%                60%             80%              100%

                                                              Percentile of Exceedence
                                                                   Natural         Present

                                                       EF1 - Kaudiyala/Rishikesh
                10000
 Flow [m 3/s]

                  1000

                   100
                          1    21   41   61    81   101 121 141 161 181 201 221 241 261 281 301 321 341 361
                                                                Days since 1st January

                          Natural dry (1979)        Natural wet (1997)       Present dry (1979)   Present wet (1997)

Figure 13: Flow Duration curves (top) and example daily hydrographs (bottom) for
Kaudiyala/Rishikesh site

                                                                                                                       17
EF2 - Narora
                70000

                60000
 Volume [MCM]

                50000

                40000

                30000

                20000

                10000

                    0
                        1970

                               1972

                                       1974

                                                1976

                                                       1978

                                                              1980

                                                                     1982

                                                                              1984

                                                                                     1986

                                                                                            1988

                                                                                                     1990

                                                                                                             1992

                                                                                                                    1994

                                                                                                                           1996

                                                                                                                                  1998

                                                                                                                                         2000

                                                                                                                                                2002

                                                                                                                                                        2004
                                                                                       Years
                                               Annual Natural Flow Volume                   Annual Present Flow Volume

                                                                            EF2 - Narora
                12000

                10000
 Volume [MCM]

                 8000

                 6000

                 4000

                 2000

                    0
                          Jan         Feb         Mar         Apr      May           Jun       Jul          Aug       Sep         Oct      Nov         Dec

                                              Natural Monthly Flow Volume                   Present Monthly Flow Volume
Figure 14: Annual flow totals (top) and average monthly flow distribution (bottom) for
Narora

                                                                                                                                                               18
EF2 - Narora
                10000

                 1000
  Flow [m3/s]

                  100

                   10
                        0%                  20%              40%                  60%           80%              100%

                                                           Percentile of Exceedence

                                                                Natural           Present

                                                                   EF2 - Narora
                10000

                1000
 Flow [m 3/s]

                 100

                  10
                        1    21   41   61    81   101 121 141 161 181 201 221 241 261 281 301 321 341 361
                                                              Days since 1st January

                        Natural dry (1979)        Natural wet (1997)       Present dry (1979)   Present wet (1997)

Figure 15: Flow Duration curves (top) and example daily hydrographs (bottom) for Narora

                                                                                                                     19
EF3 - Kachla Bridge
                70000

                60000
 Volume [MCM]

                50000

                40000

                30000

                20000

                10000

                    0
                        1970

                               1972

                                       1974

                                                1976

                                                       1978

                                                              1980

                                                                      1982

                                                                             1984

                                                                                    1986

                                                                                           1988

                                                                                                    1990

                                                                                                            1992

                                                                                                                   1994

                                                                                                                          1996

                                                                                                                                 1998

                                                                                                                                        2000

                                                                                                                                               2002

                                                                                                                                                       2004
                                                                                      Years
                                               Annual Natural Flow Volume                  Annual Present Flow Volume

                                                                     EF3 - Kachla Bridge
                12000

                10000
 Volume [MCM]

                 8000

                 6000

                 4000

                 2000

                    0
                          Jan         Feb         Mar         Apr      May          Jun       Jul          Aug      Sep          Oct     Nov          Dec

                                              Natural Monthly Flow Volume                  Present Monthly Flow Volume
Figure 16: Annual flow totals (top) and average monthly flow distribution (bottom) for
Kachla Bridge

                                                                                                                                                              20
EF3 - Kachla Bridge
  Flow [m3/s]   10000

                1000

                  100
                        0%        10%     20%       30%       40%       50%      60%       70%   80%     90%      100%

                                                            Percentile of Exceedence

                                                                 Natural         Present

                                                                 EF3 - Kachla Bridge
                10000
 Flow [m 3/s]

                1000

                  100
                        1    21    41   61    81   101 121 141 161 181 201 221 241 261 281 301 321 341 361
                                                               Days since 1st January

                         Natural dry (1979)        Natural wet (1997)      Present dry (1979)    Present wet (1997)

Figure 17: Flow Duration curves (top) and example daily hydrographs (bottom) for Kachla
Bridge

                                                                                                                      21
EF4 - Bithur/Kanpur
                100000

                 80000
 Volume [MCM]

                 60000

                 40000

                 20000

                     0
                         1970

                                1972

                                        1974

                                                 1976

                                                        1978

                                                               1980

                                                                       1982

                                                                              1984

                                                                                     1986

                                                                                            1988

                                                                                                     1990

                                                                                                             1992

                                                                                                                    1994

                                                                                                                           1996

                                                                                                                                  1998

                                                                                                                                         2000

                                                                                                                                                2002

                                                                                                                                                        2004
                                                                                       Years
                                                Annual Natural Flow Volume                  Annual Present Flow Volume

                                                                      EF4 - Bithur/Kanpur
                16000
                14000
 Volume [MCM]

                12000
                10000
                 8000
                 6000
                 4000
                 2000
                    0
                           Jan         Feb         Mar         Apr      May          Jun       Jul          Aug      Sep          Oct     Nov          Dec

                                               Natural Monthly Flow Volume                  Present Monthly Flow Volume
Figure 18: Annual flow totals (top) and average monthly flow distribution (bottom) for
Bithur/Kanpur

                                                                                                                                                               22
EF4 - Bithur/Kanpur
                10000

                  1000
  Flow [m3/s]

                  100

                    10
                         0%                   20%               40%               60%            80%              100%
                                                              Percentile of Exceedence

                                                                  Natural         Present

                                                                  EF4 - Bithur/Kanpur
                10000

                1000
 Flow [m 3/s]

                 100

                  10
                         1    21   41   61     81   101 121 141 161 181 201 221 241 261 281 301 321 341 361
                                                                Days since 1st January

                         Natural dry (1979)         Natural wet (1997)      Present dry (1979)   Present wet (1997)

Figure 19: Flow Duration curves (top) and example daily hydrographs (bottom) for
Bithur/Kanpur

REFERENCES

Arnold, J.G., Srinivasan, P., Muttiah, R.S., Williams, J.R. (1998): Large area hydrologic
       modelling and assessment. Part I. Model development. J. Am. Water Resour. Assoc.
       34, 73–89.

Liu, Y.B. and Smedt, F. De (2004): WetSpa Extension, Documentation and User Manual.
       Department of Hydrology and Hydraulic Engineering, Vrije Universiteit Brussel.

                                                                                                                      23
Srinivasan, R., Ramanarayanan, T.S., Arnold, J.G. and. Bednarz, S.T. (1998): Large area
       hydrological modeling and assessment. Part II: Model application. J. Am. Water
       Resources Ass., 34(1): 91-101

                                                                                    24
You can also read