National Coastal Flood Hazard Mapping 2021 - Flood Mapping Methodology Report
←
→
Page content transcription
If your browser does not render page correctly, please read the page content below
National Coastal Flood
Hazard Mapping 2021
Flood Mapping Methodology
Report
Office of Public Works                                                National Coastal Flood Hazard Mapping 2021
                                                                              Flood Mapping Methodology Report

   National Coastal Flood Hazard Mapping
                    2021
        Flood Mapping Methodology Report
                    DOCUMENT CONTROL SHEET

                          Project Title National Coastal Flood Hazard Mapping 2021
                       Document Title Flood Mapping Methodology

 Rev          Status        Author(s)     Reviewed    Approved By     Office of Origin          Issue Date
                                             By
               Final       DF / RMcD      JMC / TH      JMC / TH             Trim              11/06/2021
  1.0
             Notes:        First issue.

             Notes:

             Notes:

             Notes:

                                                                                                      Page | i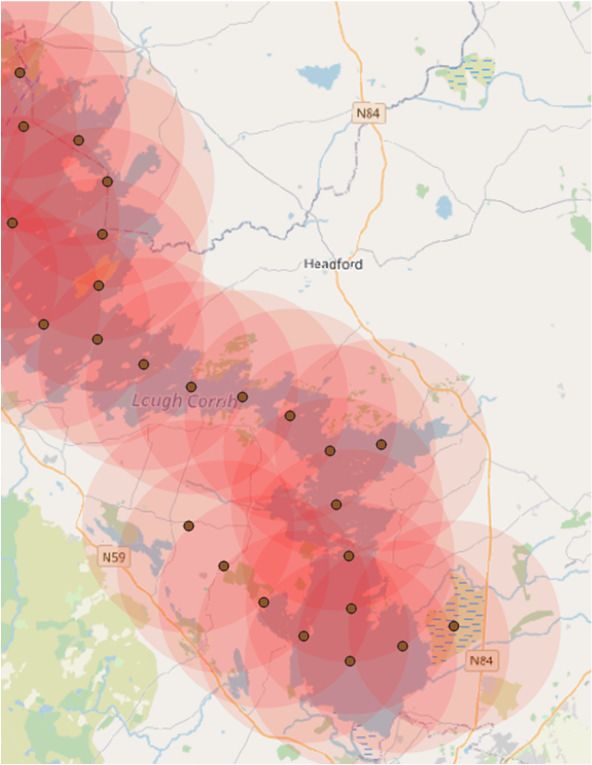
Office of Public Works                                                                                 National Coastal Flood Hazard Mapping 2021
                                                                                                               Flood Mapping Methodology Report

Table of Contents
1.0       Introduction ................................................................................................................................ 1
2.0       Data Inputs .................................................................................................................................. 1
   2.1       Extreme Water Level Data ...................................................................................................... 1
   2.2       Digital Terrain Model .............................................................................................................. 1
      2.2.1          Glacial Isostatic Adjustment............................................................................................ 3
   2.3       Coastal Mask ........................................................................................................................... 3
   2.4       Summary of Data Inputs ......................................................................................................... 3
3.0       Methodology............................................................................................................................... 4
   3.1       Overview ................................................................................................................................. 4
   3.2       Step 1 – Interpolate the Sea Level Surface ............................................................................. 5
   3.3       Step 2 – Resample the Sea Level Surface................................................................................ 7
   3.4       Step 3 – Generate the Flood Depth Raster ............................................................................. 7
   3.5       Step 4 – Generate the Flood Extent Raster............................................................................. 8
   3.6       Step 5 – Flood Extents Raster to Vector Conversion .............................................................. 9
   3.7       Step 6 – Finalise Extents Vector Outputs ................................................................................ 9
4.0       Flood Mapping Outputs ............................................................................................................ 10
   4.1       Uncertainties ......................................................................................................................... 10

Appendices
Appendix A               FME Workbench

                                                                                                                                             Page | ii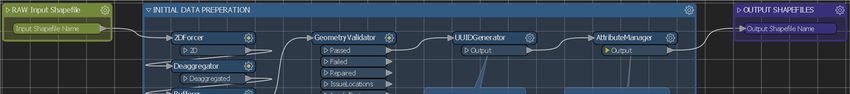
Office of Public Works National Coastal Flood Hazard Mapping 2021
Flood Mapping Methodology Report
1.0 Introduction
This report has been prepared by the Office of Public Works (OPW) Coastal and Flood Risk
Management Data Management Sections to detail the methodology used in the National Coastal
Flood Hazard Mapping 2021 project. The aim of this project is to produce updated national scale
coastal flood extent and depth maps for the 50%, 20%, 10%, 5%, 2%, 1%, 0.5% and 0.1% Annual
Exceedance Probabilities (AEPs) for the present day scenario and for the Mid-Range Future Scenario
(MRFS), High End Future Scenario (HEFS), High+ End Future Scenario (H+EFS) and High++ End Future
Scenario (H++EFS) which represent a 0.5m, 1.0m, 1.5m and 2.0m increase in sea level respectively.
2.0 Data Inputs
2.1 Extreme Water Level Data
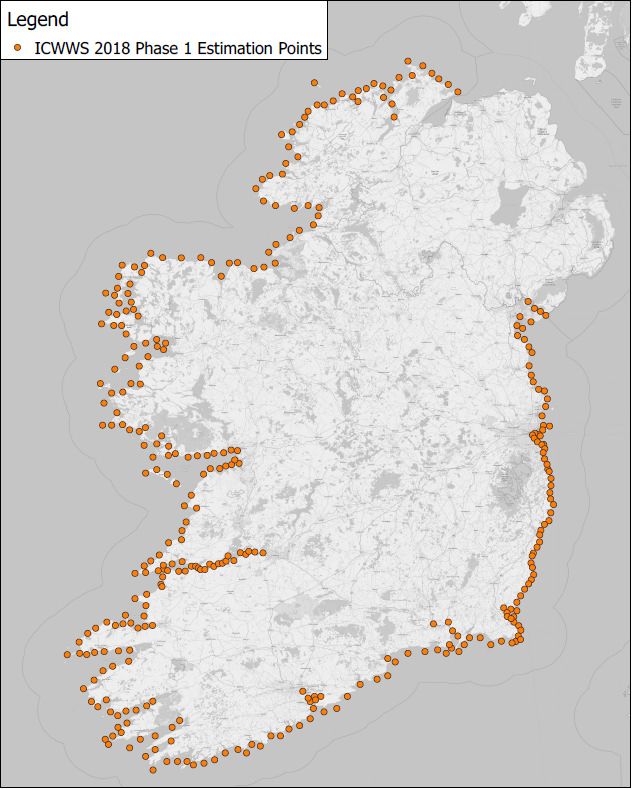
The estimated extreme water level outputs from Phase 1 of the Irish Coastal Wave and Water Level
Modelling Study (ICWWS 2018), relative to OD Malin OSGM02, were used as the input water level
data for the project. Refer to the ICWWS 2018 Phase 1 – Extreme Water Levels Technical Report (RPS,
2020) for further details on the estimation of the extreme water levels.
The location of the ICWWS 2018 Phase 1 estimation points are included in Figure 2.1.
Figure 2.1 – ICWWS 2018 Phase 1 Estimation Points (Background Map data © 2021 OpenStreetMap)
2.2 Digital Terrain Model
A national Digital Terrain Model (DTM), created by merging OPW owned and open licenced elevation
data, was used in the production of the flood extent and depth datasets. All elevation data used to
produce the national DTM was relative to OD Malin OSGM02. As the elevation data used to create the
national dataset was captured at different times using different methodologies, the accuracy of the
Page | 1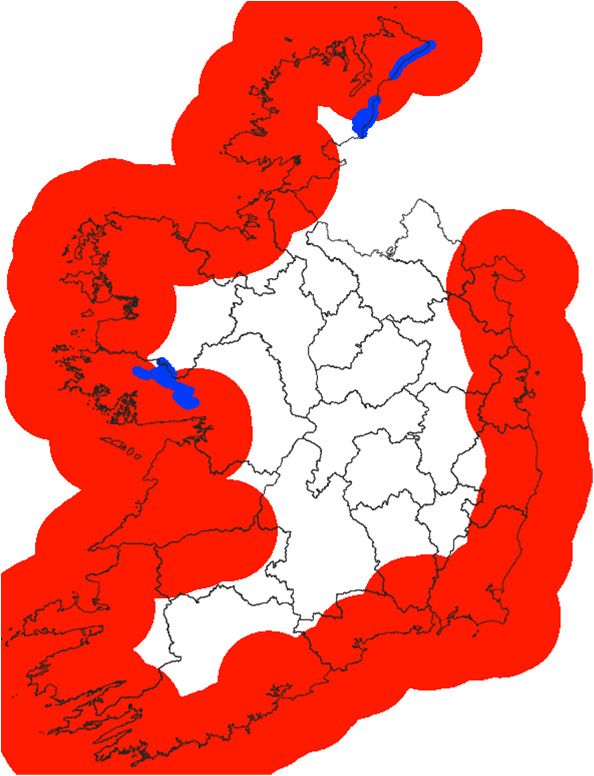
Office of Public Works National Coastal Flood Hazard Mapping 2021
Flood Mapping Methodology Report
national DTM varies depending on the source of the DTM data used. It may be noted that in some
areas a “step” in the elevation can be seen at the boundaries between datasets. The decision was
taken not to smooth these steps, in order to preserve the underlying legacy data.
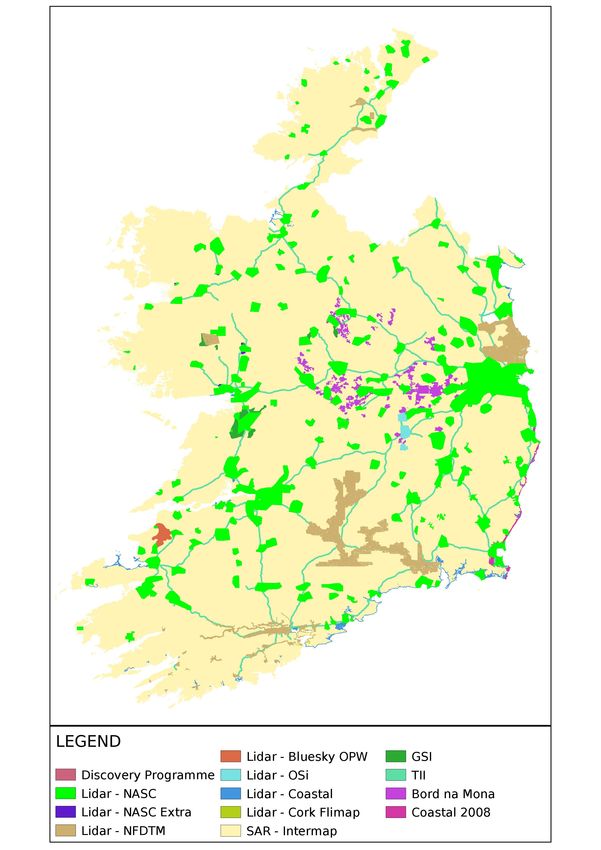
The various sources of the elevation data used to create the national DTM is included in Figure 2.2.
Figure 2.2 – National DTM Index
Page | 2
Office of Public Works                                                         National Coastal Flood Hazard Mapping 2021
                                                                                       Flood Mapping Methodology Report

2.2.1 Glacial Isostatic Adjustment
The datasets produced for the MRFS, HEFS, H+EFS and H++EFS represent a projected future scenario
for the end of century (circa 2100) and include an allowance of -0.5mm/year1 for glacial isostatic
adjustment in accordance with the Flood Risk Management Climate Change Sectoral Adaptation Plan
(OPW, 2019). For mapping purposes, the glacial isostatic adjustment allowance was applied to the
estimated extreme water levels rather than the DTM.

2.3 Coastal Mask
A coastal mask was created by the OPW to remove permanent water bodies from the outputs. The
mask was created using the following datasets:

       •   2.5km buffer of the Irish Coastal Protection Strategy Study (ICPSS) flood extent dataset (this
           was rasterised with a value of 1).
       •   OSI PRIME2 high water mark (HWM). This dataset was edited in a number of locations in order
           to refine the position of the HWM based on a comparison with aerial imagery (this was then
           converted to a polygon and rasterised with a value of 1).
       •   OSI PRIME2 water polygon dataset filtered to show only lakes, canals, rivers, ponds, open
           reservoirs and the sea polygons (these were then dissolved into a single polygon, which was
           rasterised and given a value of 0).
       •   OSI PRIME2 quarry polygon extents dataset filtered to remove any quarries which could flood,
           leaving only quarries with no direct path to the sea (these were then rasterised and given a
           value of 0).

These individual raster datasets were then merged into a single national coastal mask with the output
extents, resolution and pixel alignment matching the national DTM.

2.4 Summary of Data Inputs
The data inputs are summarised in Table 2.1.

1
    Applicable to the southern part of the national coastline only (Dublin – Galway and south of this).

                                                                                                              Page | 3
Office of Public Works                                                    National Coastal Flood Hazard Mapping 2021
                                                                                  Flood Mapping Methodology Report

Table 2.1 – Summary of Data Inputs

 Dataset                 Description                     Resolution   Coordinate       Height           Source
                                                                      Reference        Datum
                                                                      System
 ICWWS 2018 Phase        CSV file including the          n/a          Irish            OD Malin         OPW
 1 Estimation Points     coordinates and estimated                    Transverse       (OSGM02)
                         extreme water levels at the                  Mercator
                         ICWWS 2018 estimation                        (EPSG: 2157)
                         points. The MRFS, HEFS,
                         H+EFS and H++EFS water
                         levels were edited to
                         include an allowance for
                         glacial isostatic adjustment
                         as described in Section 2.2.1
 National Digital        National DTM created by         5m           Irish            OD Malin         Various
 Terrain Model           merging various sources of                   Transverse       (OSGM02)         elevation
 (DTM)                   elevation data available to                  Mercator                          datasets
                         OPW                                          (EPSG: 2157)                      available to
                                                                                                        OPW
 Coastal Mask            Developed from a buffer of      5m           Irish            n/a              Developed by
                         the ICPSS flood extents and                  Transverse                        OPW from
                         the OSi PRIME2 datasets                      Mercator                          OPW and OSi
                                                                      (EPSG: 2157)                      datasets

3.0 Methodology
3.1 Overview
The methodology developed by the OPW and used in the preparation of the national coastal flood
extent and depth datasets is summarised in Figure 3.1. The methodology utilises, in the main,
Geospatial Data Abstraction Library (GDAL)/OGR scripts incorporated into batch scripts which can be
run to complete each step. These batch scripts allow for multiple datasets to be generated from a
single script, helping to speed up the process.

                                  Step 1 – Interpolate the Sea Level Surface

                                     Step 2 – Resample the Sea Level Surface

                                 Step 3 – Generate the Flood Depth Raster

                                 Step 4 – Generate the Flood Extent Raster

                            Step 5 – Flood Extents Raster to Vector Conversion

                                     Step 6 – FInalise Extents Vector Outputs

Figure 3.1 – Methodology Overview

                                                                                                         Page | 4
Office of Public Works                                                           National Coastal Flood Hazard Mapping 2021
                                                                                         Flood Mapping Methodology Report

3.2 Step 1 – Interpolate the Sea Level Surface
The ICWWS 2018 estimation points, including an allowance for glacial isostatic adjustment for the
MRFS, HEFS, H+EFS and H++EFS, were used to interpolate a sea level surface for each AEP event
analysed. The GDAL Inverse Distance Weighted (IDW) interpolation method with nearest neighbour
searching was used to ensure that the closest points will have more influence on their surrounding
areas, resulting in a smooth surface. To optimise the processing time for this national scale
assessment, the resolution of the interpolated sea level surface was set to 100m.

There were two areas where additional points were included in the derivation of the sea level surface:
Lough Corrib and Lough Foyle and upstream of these areas. These points were added to ensure the
sea level surface generated was representative of the nearest hydraulically linked estimation point.
The estimated extreme water levels from ICWWS 2018 estimation points W6 and NW52 were assigned
to the additional points at Lough Corrib and Lough Foyle respectively. To limit the influence of these
additional points to the area of interest, the extent of the surface generated from each point was
limited to 8km. This required a number of points to be added to each area to provide sufficient
coverage for the sea level surface.

These points were then processed separately and the resulting outputs merged with the national sea
level surface outputs. Some examples of the outputs can be seen below in Figure 3.2.

Figure 3.2 – (a) Extent of Sea Surface (Red – 30km radius, Blue – 8km radius in Lough Corrib and Lough Foyle) (b) Example
of additional estimation points and extent of influence, Lough Corrib, Co. Galway. (c) Example of National Sea Surface

The sea level surface interpolation was carried out using a GDAL script similar to that outlined below.
All variables are shown in red with the values used shown in bold. Refer to Table 3.1 for details.

gdal_grid -l ncfhm_water_levels_itm_osgm02 -zfield h++_0100 -a invdistnn: power= 3.0: radius= 30000.0:
max_points= 6: min_points= 0 -ot Float32 -of GTiff -co ”NUM_THREADS=ALL_CPUS” -co ”BIGTIFF=YES” -co
”TILED=YES” -co ”COMPRESS=DEFLATE” -txe 415000 767300 -tye 515000 970000 -outsize 4551 3524 -a_srs
EPSG:2157 "ncfhm_water_levels_itm_osgm02.shp" "30km_sur_h++_0100.tif "

                                                                                                                Page | 5
Office of Public Works                                                National Coastal Flood Hazard Mapping 2021
                                                                              Flood Mapping Methodology Report

Table 3.1 – Sea Level Surface Interpolation Parameters

  Variable                  Value                                  Description
  -l                        ncfhm_water_levels_itm_osgm02          Layer name
  -zfield                   h++_0100                               The attribute/field containing the Z
                                                                   value (sea levels)
  -a                        Invdistnn                              The algorithm used for the
                                                                   interpolation (inverse distance to a
                                                                   power with nearest neighbour
                                                                   searching)
  power                     3.0                                    Weighting power
  radius                    30000.0 or 8000.0 (units are meters)   The radius of the search circle, 30km
                                                                   or 8km
  max_points                6                                      Maximum number of data points the
                                                                   algorithm will use
  min_points                0                                      Minimum number of data points the
                                                                   algorithm will use
  -ot                       Float32                                Force the output image bands to
                                                                   have a specific data type
  -of                       GTiff                                  Specify output format GeoTiff
  -co NUM_THREADS           ALL_CPUS                               Creation option, utilises all available
                                                                   threads in CPU for multi-threaded
                                                                   compression
  -co                       YES                                    BigTIFF is a TIFF variant which can
  BIGTIFF                                                          contain more than 4GiB of data
  -co TILED                 YES                                    Creates internal tiling for more
                                                                   efficient rendering
  -co COMPRESS              DEFLATE                                Sets the method of compression
  -txe                      415000 767300                          Sets georeferenced X extents of
                                                                   output file to be created
  -tye                      515000 970000                          Sets georeferenced Y extents of
                                                                   output file to be created
  -outsize                  4551 3524                              Sets the size of the output file in
                                                                   number pixels, or number of rows
                                                                   and columns.
  -a_srs                    EPSG:2157                              The coordinate reference system to
                                                                   be assigned to the raster (no re-
                                                                   projection)
                            ncfhm_water_levels_itm_osgm02.shp      Input dataset name
                            30km_sur_h++_0100.tif                  Output dataset name

The 30km and 8km resolution sea level surfaces were then merged into a single raster, with the values
in the 8km dataset overwriting the values in the 30km dataset. This was achieved using a GDAL script
similar to the one outlined below. All variables are shown in red with the values used shown in bold.
Refer to Table 3.2 for details.

gdalbuildvrt –srcnodata 0 -vrtnodata -9999 "warped_30km_sur_h++_0100"
"warped_add_8km_sur_h++_0100" "sur_h++_0100.vrt”

                                                                                                     Page | 6
Office of Public Works National Coastal Flood Hazard Mapping 2021
Flood Mapping Methodology Report
Table 3.2 – Sea Level Surface Merging Parameters
Variable Value Description
–srcnodata 0 Layer name
-vrtnodata -9999 The attribute/field containing the Z
value
"warped_30km_sur_h++_0100" Input dataset name
"warped_add_8km_sur_h++_0100" Input dataset name
"sur_h++_0100.tif” Output dataset name
3.3 Step 2 – Resample the Sea Level Surface
The sea level surface was interpolated to a 100m resolution in Step 1. In order to match the extent,
resolution and pixel alignments of the national DTM, the sea level surface was resampled down to 5m
resolution.
This process was carried out using a GDAL script similar to that outlined below. All variables are shown
in red with the values used shown in bold. Refer to Table 3.3 for details.
gdalwarp -of GTiff -te 415000 515000 767300 970000 -te_srs EPSG:2157 -tr 5 5 -tap -co
"NUM_THREADS=ALL_CPUS" -co "BIGTIFF=YES" -co "TILED=YES" -co "COMPRESS=DEFLATE"
"sur_h++_0100.vrt " "nifm_itm_sur_h++_0100_f_00.tif"
Table 3.3 – Sea Level Surface Resampling Parameters
Variable Value Description
-of GTiff Specify output format GeoTiff
-te 415000 515000 767300 970000 Sets georeferenced extents of output
file to be created
-te_srs EPSG:2157 Specifies the coordinate reference
system for the extents
-tr 55 Target resolution (meters)
-tap Target aligned pixels
-co "NUM_THREADS=ALL_CPUS" Creation option, utilises all available
threads in CPU for multi-threaded
compression
"BIGTIFF=YES" BigTIFF is a TIFF variant which can
contain more than 4GiB of data
"TILED=YES" Creates internal tiling for more
efficient rendering
"COMPRESS=DEFLATE" Sets the method of compression
" sur_h++_0100.tif " Input dataset name
" ncfhm_itm_sur_c_h++_0100_f_00.tif " Output dataset name
3.4 Step 3 – Generate the Flood Depth Raster
To generate the flood depth raster datasets, the following steps were carried out:
1. The DTM was subtracted from the sea level surface and a temporary mask created for pixel
values less than zero.
2. The DTM was subtracted from the sea level surface and multiplied by the temporary mask
generated in step 1 to remove all pixels with a value less than zero.
3. The output of step 2 was multiplied by the coastal mask to remove all permanent water
bodies.
Page | 7Office of Public Works National Coastal Flood Hazard Mapping 2021
Flood Mapping Methodology Report
A GDAL script similar to that outlined below was used. All variables are shown in red with the values
used shown in bold. Refer to Table 3.4 for details.
gdal_calc -A "ncfhm_itm_sur_c_h++_0100_f_00.tif " -B "all_island_combined_dtm.tif" -C
"ncfhm_coastal_mask_itm.tif " --outfile= "ncfhm_itm_dep_c_h++_0100 _f_00.tif” --calc= "round_(((((A-B) >
0.00) * (A-B)) * C),4)" --NoDataValue= 0 --co "NUM_THREADS=ALL_CPUS" --co "BIGTIFF=YES" --co
"TILED=YES" --co "COMPRESS=DEFLATE"
Table 3.4 – Flood Depth Raster Parameters
Variable Value Description
-A "ncfhm_itm_sur_c_h++_0100_f_00.tif " Input dataset name “A” (sea level
surface)
-B "all_island_combined_dtm.tif" Input dataset name “B” (national
DTM)
-C “ncfhm_coastal_mask_itm.tif” Input dataset name “C” (coastal mask)
--outfile "ncfhm_itm_dep_c_h++_0100 _f_00.tif” Output dataset name (depth raster)
--calc "round_(((((A-B) > 0.00) * (A-B)) * C),4)" Raster calculation which subtracts the
DTM from the sea level surface and
applies the coastal mask, resulting in
outputs depths greater than Zero with
all values rounded to four decimal
places
--NoDataValue 0 Sets the NoData value of the raster to
zero
--co "NUM_THREADS=ALL_CPUS" Creation option, utilises all available
threads in CPU for multi-threaded
compression
"BIGTIFF=YES" BigTIFF is a TIFF variant which can
contain more than 4GiB of data
"TILED=YES" Creates internal tiling for more
efficient rendering
"COMPRESS=DEFLATE" Sets the method of compression
3.5 Step 4 – Generate the Flood Extent Raster
The flood extent raster dataset was generated to make the creation of vector (polygon) datasets easier
to process. The script uses two specific variables to achieve this:
1. type= Byte
2. --co "SPARSE_OK=TRUE"
These variables, combined with compression, can reduce the size of the resulting raster dataset
considerably.
A GDAL script similar to that outlined below was used. All variables are shown in red with the values
used shown in bold. Refer to Table 3.5 for details.
gdal_calc -A "ncfhm_itm_ext_c_h++_0100 _f_00.tif" --outfile= "ncfhm_itm_ext_c_h++_0100 _f_00.tif" --
type= Byte --calc= "1*(A>0)" --NoDataValue= 0 --co "NUM_THREADS=ALL_CPUS" --co "TILED=YES" --co
"COMPRESS=DEFLATE" --co "SPARSE_OK=TRUE"
Page | 8Office of Public Works National Coastal Flood Hazard Mapping 2021
Flood Mapping Methodology Report
Table 3.5 – Flood Extent Raster Generation Parameters
Variable Value Description
-A "ncfhm_itm_sur_c_h++_0100_f_00.tif " Input dataset Name “A” (sea level
surface)
--outfile "ncfhm_itm_dep_c_h++_0100 _f_00.tif” Output dataset name (depth raster)
--type Byte Sets the raster output type to byte
--calc "1*(A>0)" Raster calculation which outputs
depths greater than zero giving all
pixels a value of 1
--NoDataValue 0 Sets the NoData value of the raster to
zero
--co "NUM_THREADS=ALL_CPUS" Creation option, utilises all available
threads in CPU for multi-threaded
compression
"BIGTIFF=YES" BigTIFF is a TIFF variant which can
contain more than 4GiB of data
"TILED=YES" Creates internal tiling for more
efficient rendering
"COMPRESS=DEFLATE" Sets the method of compression
"SPARSE_OK=TRUE" Omits empty blocks, blocks with a
value of zero or NoData
3.6 Step 5 – Flood Extents Raster to Vector Conversion
The flood extent raster dataset was transformed into a vector layer to facilitate further processing and
analysis using the data.
A GDAL script similar to that outlined below was used. All variables are shown in red with the values
used shown in bold. Refer to Table 3.6 for details.
gdal_polygonize "ncfhm_itm_ext_c_h++_0100 _f_00.tif" -f "ESRI Shapefile" "ncfhm_itm_ext_c_h++_0100
_f_00.shp"
Table 3.6 – Flood Extent Vectorisation Parameters
Variable Value Description
"ncfhm_itm_ext_c_h++_0100_f_00.tif " Input raster dataset name
-f "ESRI Shapefile" OGR format for output dataset
"ncfhm_itm_ext_c_h++_0100 _f_00.shp" Output dataset name (depth raster)
3.7 Step 6 – Finalise Extents Vector Outputs
This step was carried out to produce geometries which are optimised for use in future analysis and to
generate the required attribution.
This process was carried out in SAFE Software’s FME. The process is as follows:
1. Ensure all geometries are 2D.
2. Convert multipart geometries to single part geometries.
3. Buffer all geometries by 0.001m and dissolved results. This removes any common geometry
issues which can occur after vectorization, such as self-intersections.
4. Validate geometry based on OGC compliance.
5. Creation of attribution in line with the Flood Relief Scheme Engineering Spatial Data
Specification (OPW, 2020).
Page | 9Office of Public Works National Coastal Flood Hazard Mapping 2021
Flood Mapping Methodology Report
6. Write out final shapefiles.
An example of the FME Workbench is included in Appendix A.
4.0 Flood Mapping Outputs
National coastal flood extent and depth maps have been produced for the 50%, 20%, 10%, 5%, 2%,
1%, 0.5% and 0.1% Annual Exceedance Probabilities (AEPs) for the present day scenario, and for the
MRFS, HEFS, H+EFS and H++EFS. The flood extent and depth maps were prepared using elevation
datasets relative to OD Malin OSGM02.
The maps prepared are predictive, as they provide predicted flood extent and depth information for
a ‘design’ flood event that has an estimated probability of occurrence (e.g. the 0.5% AEP event), rather
than information for floods that have occurred in the past.
The maps have been produced at a strategic level to provide an overview of coastal flood hazard in
Ireland, and minor or local features may not have been included in their preparation. A Digital Terrain
Model (DTM) is used to generate the maps, which is a ‘bare-earth’ model of the ground surface with
the digital removal of man-made and natural landscape features such as vegetation, buildings and
bridges. This methodology can result in some of these man-made features, such as bridges and
embankments, being shown within a flood extent, when in reality they do not flood.
It should be noted that the flood extent maps indicate the predicted maximum extent of flooding, and
flooding in some areas, such as near the edge of the floodplain area, might be very shallow. The
predicted depth of flooding at a given location is indicated on the flood depth maps. The flood depth
is displayed as a constant depth over grid squares with a 5m resolution, whereas in reality depths may
vary within a given square.
No post-processing of the flood extent and depth map datasets has been undertaken to remove small
areas of flooding that are remote and isolated, small islands within the flooded area, etc. Local factors
such as flood defence schemes, structures in or around river channels (e.g. bridges), buildings and
other local influences, which might affect coastal flooding, have not been accounted for.
4.1 Uncertainties
Although widely accepted methods have been used to prepare the maps, there is a range of inherent
uncertainties within the process of preparing the flood extent and depth maps. These include:
• Uncertainties in the estimated extreme water levels: This can arise due to uncertainties in
topographic and other survey data, meteorological data, assumptions and / or approximations
in the hydraulic / hydrodynamic models in representing physical reality, assumptions in the
hydraulic / hydrodynamic modelling, datum conversions, etc.
• Uncertainties in the flood extents and depths: This can arise due to uncertainties in the
estimated extreme water levels, topographic and other survey data, assumptions and / or
approximations in the way that flooding spreads over a floodplain, etc.
Due to the various sources of potential inaccuracies in the flood extent and depth maps, a quantitative
assessment of their accuracy has not been carried out. A qualitative assessment of the maps was
carried out as part of the quality control process. The flood extent and depth maps are therefore
suitable for the assessment of flood risk at a strategic scale only, and should not be used to assess the
flood hazard and risk associated with individual properties or point locations, or to replace a detailed
flood risk assessment. The potential for inaccuracy should be recognised if these flood maps are to be
Page | 10Office of Public Works National Coastal Flood Hazard Mapping 2021
Flood Mapping Methodology Report
used for any purpose. Users of this data should refer to the associated Disclaimer, Guidance Notes
and Licence.
Page | 11Office of Public Works National Coastal Flood Hazard Mapping 2021
Flood Mapping Methodology Report
Appendix A
FME Workbench
Appendix AOffice of Public Works National Coastal Flood Hazard Mapping 2021
Flood Mapping Methodology Report
Figure A.1 – Example of the FME Workbench
Appendix AYou can also read