A Wireless Sensor Network for Weather and Disaster Alarm Systems
←
→
Page content transcription
If your browser does not render page correctly, please read the page content below
2011 International Conference on Information and Electronics Engineering
                                                         IPCSIT vol.6 (2011) © (2011) IACSIT Press, Singapore

    A Wireless Sensor Network for Weather and Disaster Alarm Systems

                                        Cholatip Yawut+ and Sathapath Kilaso
                                      Faculty of Information Technology
                   King Mongkut's University of Technology North Bangkok, Bangkok, Thailand

       Abstract. In the last few years, the occurrences of natural disasters have been continuing changing our
       lives, damaging property and life styles in many different ways. In this paper, we present a system that can be
       used to prevent enormous damage from natural disasters. In this system, a wireless sensor network based on
       Zigbee/IEEE802.15.4 standard is utilized as a weather station network sending weather information and
       disasters’ alerts. The weather information is analyzed by using decision tree techniques to announce the
       disasters’ alerts. This proposed system takes advantage of wireless sensor networks which can send signals
       over far distances by using a mesh topology, this transfers the data and also consumes low power. Therefore,
       this system can be installed in locations that are difficult to hardwire or have no access to electricity.
      Keywords: Disaster Alarm system, Wireless Sensor Network, Weather Station, Zigbee/IEEE802.15.4

1. Introduction
    Natural disasters are becoming more severe. One important reason is the results of global warming
around the world causing many of the disasters. To carefully protect people in these areas, we need a
monitoring and alarm system. In many events such as landslides and water flooding, they can be warned by a
raised alarm within in a specified period. The surveillance system’s equipment is a tool used to measure
parameters such as sample temperature, air pressure, moisture, vibration etc. These parameters will vary
depending on the requirement of the surveillance system.
    Monitoring system, the equipment used for detection is the heart of the work. The monitor system
devices are installed in different places. Sometimes it is not easy to install equipment in some areas for many
reasons such as lack of access to power or unable to connect to signal wiring. In addition, tools used for
measurements are very expensive. To resolve this problem, a wireless sensor network can be implemented to
help in data communications. The advantages of using a wireless network are: using less energy, no need for
hardwiring, and high transmission distance.
     In this research, the advantages of a wireless sensor network are taken to benefit weather monitoring
stations. Many sensor stations measure and send parameters through a wireless network server. Or if the
station is outside the server’s radius, it can send data to the nearest wireless weather station forwarding the
data to the server. In addition, the wireless sensor network is easy to maintain, devices are cheaper and uses
less energy.
    Today, the wireless sensor network is cheaper and more efficient then other systems, the high flexibility
can be used in various ways depending on the need to measure different values in the environment, it can be
used to measure the amount of carbon dioxide using gas sensors. In structure measurement, it can measure
the motion of buildings. Or in the military, it can be very important as it uses a large number of sensor nodes
to scatter in battlefield to measure temperature, vibration and movement of enemy spies and so on.
    In other research, the application of a wireless sensor network system are employed in fields such as
medical, [1] proposed an application as Personal area network system for monitoring of a patient's heart, In
agricultural, [2] used the wireless sensor network to check and control the greenhouse effect from

+
    Corresponding author. Tel.: + + 6629132500ext2728; fax: +6629122019.
    E-mail address: cholatipy@kmutnb.ac.th.
                                                               155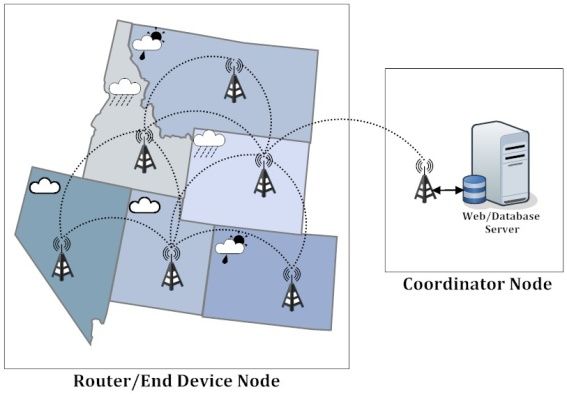
temperature, humidity, light parameter and record weather statistics for planning, and [3] presented the
development of a wireless sensor for use in various applications.
    This research uses arduino microcontroller board [4] and Xbee module to create a wireless sensor
network using decision tree to analyze the weather data and to alert when it matches with pre-conditions.

2. Related Works
2.1.    Decision Tree
     A decision tree, [5] is a diagram that a decision maker can create to help select the best of several
alternative courses of action. The primary advantage of a decision tree is that it assigns exact values to the
outcomes of different actions, thus minimizing the ambiguity of complicated decisions. Because they map
out an applied, real-world logical process, decision trees are particularly important to build "smart" computer
applications like expert systems. They are also used to help illustrate and assign monetary values to
alternative courses of action that management may take.
    In this research, the use of a decision tree will process input parameter to alarm when an inputted
parameter matches predefined conditions.

2.2.    Zigbee Standard
    ZigBee/IEEE 802.15.4 [6][7] is the only standards-based wireless technology designed to address the
unique needs of low-cost, low-power wireless sensor and control networks in just about any market. Since
ZigBee can be used almost anywhere, is easy to implement and needs little power to operate, the opportunity
for growth into new markets, as well as innovation in existing markets, is limitless.

2.3.    XBee
    XBee [7] is a device used to send and receive data wirelessly and can build up a ZigBee/IEEE 802.15.4
network reference standard. XBee functions can be divided by network topology in different ways including
the Coordinator, Router and End Device.
    •    Topology
    To create a wireless network of ZigBee, it will consist of at least two nodes including coordinator node
and sensor node types (Router/End device) to be able to communicate and work in PAN (Personal. area
network). Wireless sensor network topology an be divided into 3 topologies: Star Topology (Fig. 1-a),
Cluster Tree Topology (Fig. 1-b) and MESH Topology (Fig. 1-c).

         (a)   Star Topology             (b) Cluster Tree Topology         (c) MESH Topology

                                       Fig. 4: Wireless Network Topology
        Star topology or a Broadcast is non-specific transmission. All destinations or on the same network
can Get all the information any time (Fig. 1-a).
   The transmission of data transmission, such as E0 need contact to C0, but C0 is far from E0 and E0 can
connect to R0, and R0 is between E0 and C0, so Cluster Tree will use R0 as an intermediary (Repeater)
connecting the 2 nodes C0 and E0 (Fig. 1-b).
     Mesh topology is the most effective since data can be sent to the target in more ways; it can transfer data
to a destination even if parts of the system are lost (depending on system design) (Fig. 1-c).
    Mesh networks [3] are regularly distributed networks that generally allow transmission only to a node’s
nearest neighbours. The nodes in these networks are generally identical, so that mesh nets are also referred to
                                                        156
as peer-to-peer (see below) nets. Mesh nets can be good models for large-scale networks of wireless sensors
that are distributed over a geographic region, e.g. personnel or vehicle security surveillance systems.
• Serial Interface Protocols
Xbee module supports both transparent and API (Application Programming Interface) serial interfaces.
- Transparent Operation: when operating in transparent mode, the modules act as a serial line
replacement. All UART data received through the DIN pin is queued up for RF transmission. When RF data
is received, the data is sent out through the DOUT pin.
- API Operation: API operation [8] is an alternative to transparent operation. The frame-based API
extends the level to which a host application can interact with the networking capabilities of the module.
When in API mode, all data entering and leaving the module is contained in frames that define operations or
events within the module.
3. System Design and Implementation
Our wireless sensor network for weather and disaster alert system uses mesh network topology. The
system design is divided into two main sections consisting sensor node (Router/End Device Node) and
coordinator node (Fig. 2).
Fig. 2: System overview consists of Router/End Device Node and Coordinator Node.
3.1. Sensor Node
The sensor node consists of the microcontroller, temperature and humidity sensor, light sensor, pressure
sensor and XBee module (Fig. 3-a shows sensor node block diagram). The wireless sensor nodes are
programmed with C language (for Arduino [4]). It stays on standby for requests of data transmitted from the
server (coordinator with server). Upon receiving the request for weather data, the microcontroller will read
the data from different sensors and send the data back to the server (Fig 4-a. shows the flowchart of sensor
node process).
This experiment is set up with XBee module working in mesh topology. For data transmission, it has
only one sensor node which is the coordinator with server for data recording and processing. For the
transmission to coordinator, sensor nodes cannot directly contact the coordinator, it needs to transmit data to
sensor nodes near the coordinator.
Temperature
&Humidity Sensor
Pressure Sensor XBee
XBee
Light Sensor
Web/Database Server
Router/End Device Node Coordinator Node
(a) Sensor Node block diagram (b) Server and coordinator node block diagram
Fig. 3: System block diagram.
In the API Frame type, it can check whether the data has been sent to the server or not. When the sensor
sends data out, the server will receive it and send API Frame back to show completed state. Otherwise, it will
retransmit such as the destination offline.
157(a) Sensor node process (b) Server node process.
Fig. 4: Flow chart of Sensor node and Server node processes.
3.2. Server and Coordinator
On the server side, it has a web/database and connects with XBee (Fig. 3-a shows server and
coordinator node). The server has an application and web application to control and to manage the system.
The server will connect XBee via USB port. When opening the application and selecting serial port to
connect to the XBee sensor nodes, the system will search sensor nodes in the network and display the status
and data of the sensor node.
Requested data from the sensor node, the server will be sent API Frame via sensor nodes. When the
data is sent out, the status of delivery will change if the sensor node successfully receives the data. But if
there is no response from the sensor nodes, the system will again send the request data in a specified period.
(Fig. 4-b)
When the server receives weather data from sensor nodes, the server will check the weather data with
notification value by using decision Tree techniques. If it matches with the pre-conditions, it will notify the
system administrator and record of the notification and automatically store weather data to the database.
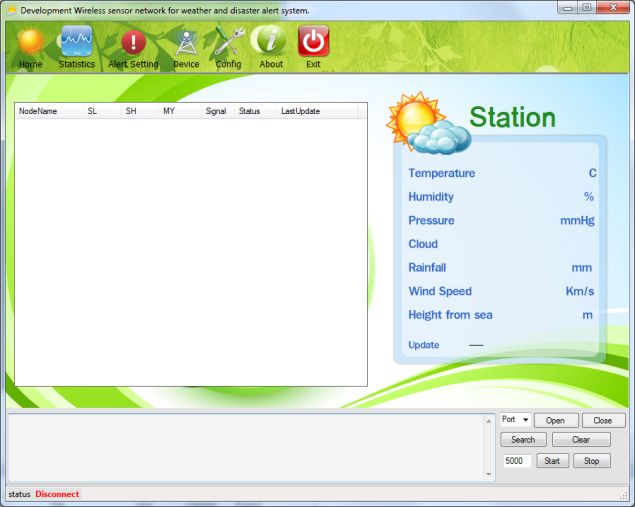
Fig. 5: Application interface.
3.3. Application
In this section, Visual studio C# is selected to develop an application used to control and display the
information (Fig. 12). The application consists of six main parts; 1) Home: Main page, 2) Statistics: Display
node information, weather and operation information 3) Alert setting: Configuration and add conditions of
the notification 4) Device: Management device in network including add, edit and delete 5) Config: Setting
the display and 6) About: About this application.
1583.4. Results
The alarm system, we used decision tree to analyze and process the data. Each parameter has 2 boundary
values in decision tree process. Testing of the system used black-box testing to test the performance and
accuracy of the system. In Table 1-a shows the boundary values and Table 1-b is the expected output with
real output. In this testing, rainfall and wind speed are simulated parameters. Testing results confirm that the
system perfectly works.
Table 1: Boundary values and Testing Results.
(a) Boundary values used in decision tree process (b) Comparing expected output with real output
Boundary value Current input
on
T0 T1 H0 H1 P0 P1 L0 L1 R0 R1 W0 W1
1 20 25 30 40 500 600 30 50 0 20 0 30
Wind speed Km/s
Temperature °C
Pressure mmHg
2 20 25 30 40 500 600 30 50 0 20 0 30 Real Expected
Rain fall mm.
Humidity %
on
3 20 25 30 40 500 600 30 50 0 20 0 30 Output output
4 20 25 30 40 500 600 30 50 0 20 0 30
Light
5 20 25 30 40 500 600 30 50 0 20 0 30
T is temperature, H is humidity,
1 25 30 510 31 10 20 Alarm Alarm
P is pressure, L is light, 2 26 33 520 32 10 20 Alarm Alarm
3 25 32 520 33 10 20 Alarm Alarm
R is rainfall, W is wind. 4 26 34 530 32 10 20 Alarm Alarm
5 27 33 525 34 10 20 Alarm Alarm
4. Conclusion
This research focuses on developing devices and tools to manage, display and alert the weather/disaster
warnings using the advantages of a wireless sensor network system in mesh topology. The system can work
over far distances. The system uses arduino microcontroller and Xbee Wireless module base on the
Zigbee/IEEE 802.15.4 standard. The developed system is very flexible and accurate. The developed system
has core competency including 1) display weather information, 2) alert when weather conditions match using
decision tree technique and 3) keep weather information statistics.
In the field testing, the specification of the device’s communication range is 1 mile at the line of sight.
When used in a real environment, the high-rise buildings, it ranges from 300 to 500 meters, the system can
work normally. The system can alert when the weather information matches with specified conditions.
5. Acknowledgements
This research is funded by Faculty of Information Technology, King Mongkut's University of
Technology North Bangkok, Bangkok, Thailand.
6. References
[1] A. Baggio, "Wireless sensor networks in precision agriculture", Workshop on Real-World Wireless Sensor
Networks (REALWSN'05), June 20-21, 2005, Stockholm, Sweden.
[2] A. Wood, G. Virone, T. Doan, Q. Cao, L. Selavo, Y. Wu, L. Fang, Z. He, S. Lin, J. Stankovic, "Wireless Sensor
Networks for Assisted-Living and Residential Monitoring", 2006 Department of Computer Science University of
Virginia Available from:
http://citeseerx.ist.psu.edu/viewdoc/download?doi=10.1.1.122.3161&rep=rep1&type=pdf
[3] F. L. LEWIS, " Wireless Sensor Networks", Associate Director for Research , The University of Texas at
Arlington
[4] Arduino, http://www.arduino.cc/ , March 2011
[5] References for business," Decision Tree ", March 2011, http://www.referenceforbusiness.com/encyclopedia/Cos-
Des/Decision-Tree.html
[6] Zigbee Alliance, "ZigBee Technology", March 2011 ,
http://www.zigbee.org/About/AboutTechnology/ZigBeeTechnology.asp
[7] P. Kinney, "ZigBee Technology: Wireless Control that Simply Works", Secretary of ZigBee BoDChair of ZigBee
Building Automation Profile WG. 2 October 2003, Communications Design Conference
[8] Digi, "XBee ZNet 2.5/XBee PRO Znet 2.5 OEM Product Manual", 2010.
159You can also read