Statistical Distribution of Novel coronavirus in Iran - Research ...
←
→
Page content transcription
If your browser does not render page correctly, please read the page content below
Preprint: Please note that this article has not completed peer review.

Statistical Distribution of Novel coronavirus in Iran
CURRENT STATUS:                    POSTED

Elham Gholami
Tehran University of Medical Sciences

Kamyar Mansori
Zanjan University of Medical Sciences

Mojtaba Soltani-Kermanshahi
Semnan University of Medical Sciences and Health Services

 msoltani@semums.ac.irCorresponding Author
ORCiD: https://orcid.org/0000-0002-6607-6249

DOI:
  10.21203/rs.3.rs-19181/v1
SUBJECT AREAS
 Infectious Diseases
KEYWORDS
 COVID-19, Infection, Distribution, Weibull

                                                   1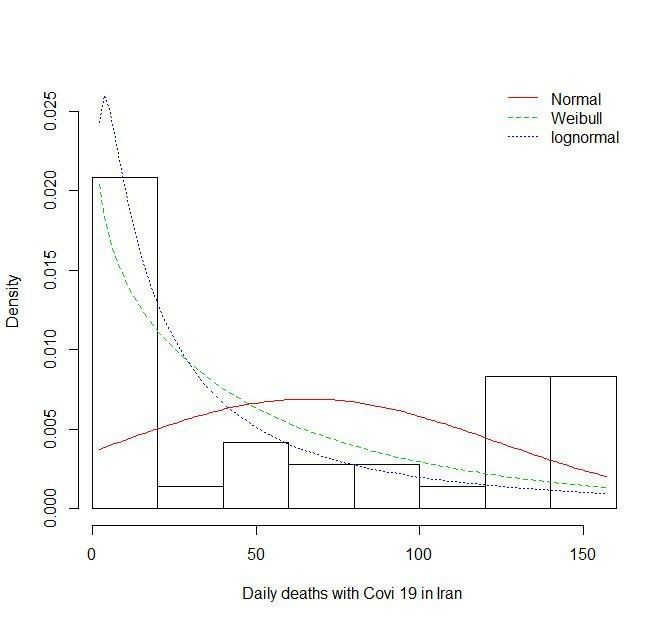
Abstract
Background The Corona Virus Disease-2019 (COVID-19) pandemic by 2019-nCoV is spreading

worldwide, and by March 27, 2020, 199 countries, including Iran, have been affected. Prevention and

control of infection is the most important priority for the public health. The behavior prediction of

COVID-19 is an important problem.

Methods In this research, we compared the different distributions of COVID-19 cases based on the

daily reported data of Iran. We used 36 initial data on new cases and deaths with confirmed 2019-

nCoV infection of Iran based on official reports from governmental institutes .We used the three types

of continuous distribution known as Normal, Lognormal and Weibull.

Results Our study showed that the weibull distribution was the best fit with the data. But the

Parameters of distribution were different between new cases and daily deaths data.

Conclusion According to the mean and median of the best fitted distribution, we can expect to pass

the peak of the disease. The death rate is decreasing. We can see the similar behaviors of covid-19 in

both Iran and China in the long run.

Background
Emerging infectious diseases, such as severe acute respiratory syndrome (SARS) and Zika virus

disease, give a significant warning to public health [1-3]. Despite significant medical researches

however, how, when and where new diseases appear are yet an origin of considerable uncertainty [4].

On 31 December 2019, the Wuhan Municipal Health Commission in Wuhan City, Hubei province, China

reported a cluster of pneumonia cases with unspecified etiology that had a history of exposure to

Wuhan's Huanan Seafood Wholesale Market (a wholesale fish and live animal market selling different

animal species). On 9 January 2020, China CDC reported that a novel coronavirus (2019-nCoV) had

been detected as the causative agent and the genome sequence was made publicly available.

Sequence analysis displayed that the newly-identified virus is belonging to the SARS-CoV clade [5]. In

an effort to prevent the prevalence, travel limitations were imposed on Wuhan from 23 January, and

have since expanded to 12 other cities, and large social gatherings annulled [6, 7]. The Corona Virus

Disease-2019 (COVID-19) pandemic by 2019-nCoV is spreading worldwide, and by March 27, 2020,

                                                    2
199 countries, including Iran, have been affected. According to worldwide statistics, the mortality rate
is 3.4%. Early symptoms of COVID-19 involves pneumonia, fever, myalgia and fatigue. To date, no
successful vaccine or antiviral agents has been clinically approved for COVID-19. Therefore,
prevention and control of infection is the most important priority for the public health [8,9].
During the 2019–20 coronavirus pandemic, Iran reported the first authenticated cases of SARS-CoV-2
infections on 19 February 2020 in Qom.[10] As of 27 March 2020, pursuant to Iranian health
authorities, there had been 2378 COVID-19 deaths in Iran with more than 32,000 confirmed
infections. Also, in the same date, Iran had the fourth highest in term of the number of COVID-19
deaths after Mainland China , Italy and Spain and the first rank in Western Asia. Accordingly, the
mean age and sex ratio (man/female) of patients were 59 years and 1.4 respectively; in Iran. Among
the deaths related to SARS-CoV-2, 59% were males and 41% females. In early March 2020, non-
Iranian-government sources stated assessment of the numbers of SARS-CoV-2 infections that were
much higher than official values [11-15].
There are considerable uncertainties in assessing the risk of this disease, due to lack of detailed
epidemiological analyses. Extensive researches into the 2019-nCoV are needed to fully elucidate its
pathway and pathogenic mechanisms, and to identify potential therapeutic targets, which can be
effective in developing the common preventive and therapeutic measures. The behavior prediction of
COVID-19 is an important problem. Therefore, in this research, we compared the different
distributions of COVID-19 cases based on the daily reported data.
Methods
We used information on new cases and deaths with confirmed 2019-nCoV infection of Iran based on
official reports from governmental institutes [13, 9]. We collected the data either directly from
governmental websites or from news sites that directly quoted governmental statements. The data
were collected in real time, and thus may be updated as more details on cases become publicly
available. The arranged data are available as the Online Supplementary Material (file S1). The latest
update to the dataset was on 27 March 2020 for cases reported through 26 March.
We performed a bootstrap method, based on case resampling, to compute the 95% confidence
3intervals (CI). We used the three types of continuous distribution known as Normal, Lognormal and
Weibull. Akaike Information Criterion (AIC) was used to identify the best fit model. We also present
the median and mean of the best fitted model to know the peak.
Normal Distribution
A normal (or Gaussian or Gauss or Laplace–Gauss) distribution is a type of continuous probability
distribution for a real-valued random variable. The general form of its probability density function is
The parameter μ is the mean or expectation of the distribution (and also its median and mode); and σ
is its standard deviation. The variance of the distribution is . A random variable with a Gaussian
distribution is said to be normally distributed and is called a normal deviate. [16]
Lognormal Distribution
A positive random variable X is log-normally distributed if the logarithm of X is normally distributed
[17],
Weibull Distribution
The probability density function of a Weibull random variable is:
Where k > 0 is the shape parameter and λ > 0 is the scale parameter of the distribution [18].
All statistical analyses were performed using package fitdistrplus in R (version 3.6.3) [19].
Results
We used 36 daily data from 21 Feb 2020 of Iran. The smallest number of new cases was 11
(22Feb2020) and the highest number was 2926 (27 March 2020). On the other hand, the smallest
4number of daily deaths was 2 (21, 22 and 23 Feb 2020) and the highest number was 157 (26 March
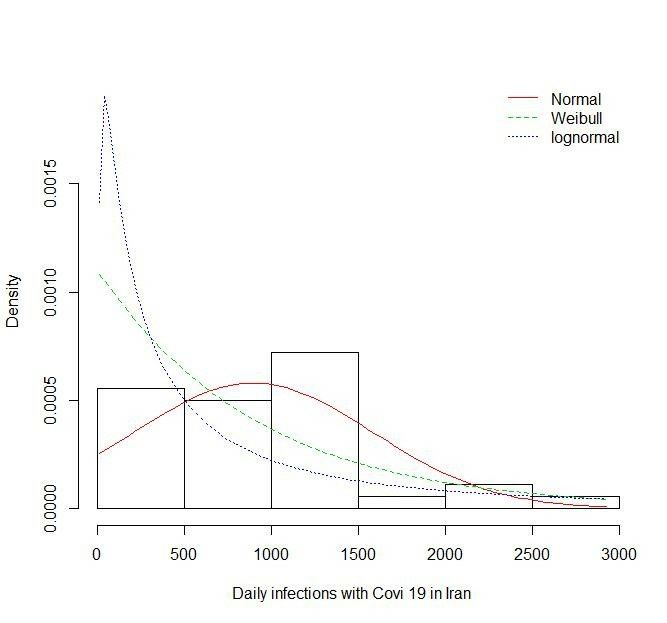
2020).The Figure1 shows the histogram of daily new cases. The graph also shows three fitted
distributions on the data.
Table 1 presents the goodness of fit of three distributions. Accordingly the best fit belongs to Weibull
distribution. With assumption of Weibull distribution for daily new cases we can say the mean, median
and mode of the data are 897.60, 624.61 and 4.59; respectively.
Table1.Goodness of fit of three distributions (Normal, Lognormal and Weibull) on Daily new Covid-19 infections in Iran
Distribution Parameters Estimation AIC
Normal Mean 897.97 576.61
Sd 688.10
Lognormal Meanlog 6.13 580.88
Sdlog 1.58
Weibull Shape 1.00 565.61
Scale 899.48
AIC: Akaike Information Criterion
The figure2 shows the histogram of daily deaths. The graph also shows three fitted distributions on
the data.
Table 2 presents the goodness of fit of three distributions. Accordingly the best fit belongs to Weibull
distribution. With assumption of Weibull distribution for daily deaths, we can say the mean, median
and mode of data are 66.44, 41.11 and zero; respectively.
Table2. Goodness of fit of three distributions (Normal, Lognormal and Weibull) on Daily new Covid-19 deaths in
Iran
Distribution Parameters Estimation AIC
Normal Mean 66.00 398.38
Sd 57.89
Lognormal Meanlog 3.44 381.86
Sdlog 1.48
Weibull Shape 0.88 376.76
Scale 62.35
AIC: Akaike Information Criterion
Discussion
On the 11 March 2020, WHO Director said “In the days and weeks ahead, we expect to see the
number of cases, the number of deaths, and the number of affected countries climb even higher. We
have therefore made the assessment that COVID-19 can be characterized as a pandemic” [20]. In the
present study, we demonstrated the distribution of Covid-19 data in Iran with various types of
5continuous distributions. One of the distributions we used was the Weibull distribution. The Weibull
distribution is related to a number of other probability distributions; in particular, it interpolates
between the exponential distribution (k = 1) and the Rayleigh distribution (k = 2 and ). Its
complementary cumulative distribution function is a stretched exponential function [21]. We used real
daily data (positive infections and deaths) reported by Ministry of Health [13, 9]. Our study showed
that the weibull distribution was the best fit with the data. But the Parameters of distribution were
different between new cases and daily deaths data. The shape parameter on the daily deaths data
was less than one; then the rate is decreasing (fortunately). On the other side the shape parameter
on the new cases data was approximately one. Thus as we say, the weibull distribution can change to
exponential distribution. We could not find any similar works to compare our results. If we use China
covid- 19 data (63 daily data), we can see the same distribution. On the other side, If we only use 36
initial China covid-19 data (similar to our data), the Lognormal distribution has the best fit. Then we
can see the similar behaviors of covid-19 in both countries in the long run.
According to the mean and median of the best fitted distribution, we can expect to pass the peak of
the disease. But, we are on the vacation of Nowruz in Iran, now. Contrary to government warnings,
many people are on the travelling. On the other side the World Health Organization (WHO) reported
an incubation period for COVID-19 between 2 and 10 days [22]. Then we can expect other peaks if we
do not follow the health instructions. There are considerable uncertainties in assessing the risk of this
event, due to lack of detailed epidemiological analyses
Conclusion
Our study showed that the weibull distribution was the best fit with the data. The death rate is
decreasing. According to the results, we can expect to pass the peak of the disease. We can see the
similar behaviors of covid-19 in both Iran and China in the long run.
Abbreviations
AIC: Akaike Information Criterion
SARS: Severe Acute Respiratory Syndrome
COVID-19: Corona Virus Disease-2019
6CI: Confidence Intervals
WHO: World Health Organization
Declarations
Ethics approval and consent to participate
Not applicable
Consent for publication
All authors have approved the manuscript and agree with its submission to the Journal of BMC
Infectious Diseases.
Availability of data and materials
The data that support the findings of this study are available from:
https://www.worldometers.info/coronavirus/
Funding
Not applicable
Competing Interests
Not applicable
Authors’ contributions
Study concept and design: Mrs. Golami, Dr. Soltani and Dr. Mansori. Acquisition of data: Mrs. Gholami.
Analysis and interpretation of data: Dr. Soltani. Drafting of the manuscript: Dr. Mansori. Critical
revision of the manuscript for important intellectual content: Mrs. Gholami, Dr. Soltani and Dr.
Mansori. Statistical analysis: Dr. Soltani.
Acknowledgements
The authors are thankful to Worldometers webmaster for providing data for this project.
References
1. Drosten, C. et al. Identification of a novel coronavirus in patients with severe acute
respiratory syndrome. N. Engl. J. Med. 348, 1967–1976 (2003).
2. Wolfe, N. D., Dunavan, C. P. & Diamond, J. Origins of major human infectious
diseases.Nature 447, 279–283 (2007).
73. Ventura, C. V., Maia, M., Bravo-Filho, V., Gis, A. L. & Belfort, R. Jr. Zika virus in Brazil
and macular atrophy in a child with microcephaly. Lancet 387, 228 (2016).
4. Wu F, Zhao S, Yu B, Chen YM, Wang W, Song ZG, Hu Y, Tao ZW, Tian JH, Pei YY, Yuan
ML. A new coronavirus associated with human respiratory disease in China. Nature.
2020 Feb 3:1-5.
5. European Centre for Disease Prevention and Control , Risk assessment: Outbreak of
acute respiratory syndrome associated with a novel coronavirus, Wuhan, China; first
update, [March 27, 2020]. Available from:
https://www.ecdc.europa.eu/en/publications-data/risk-assessment-outbreak-acute-
respiratory-syndrome-associated-novel-coronavirus
6. New York Times (2020) Toll From Outbreak Climbs in China as Infections Reach
Europe and Australia. Available at:
https://www.nytimes.com/2020/01/24/world/asia/china-coronavirus.html (Accessed:
27 March 2020).
7. Read JM, Bridgen JR, Cummings DA, Ho A, Jewell CP. Novel coronavirus 2019-nCoV:
early estimation of epidemiological parameters and epidemic predictions. medRxiv.
2020 Jan 1.
8. Farnoosh G, Alishiri G, Zijoud SR, Dorostkar R, Farahani AJ. Understanding the 2019-
novel Coronavirus (2019-nCoV) and Coronavirus Disease (COVID-19) Based on
Available Evidence-A Narrative Review. Journal of Military Medicine. 2020 Jan;22(1):1-
1.
9. Worldometer, COVID-19 Coronavirus Pandemic (Accessed: 27 March 2020). Available
at: https://www.worldometers.info/coronavirus/
10. "Iran Reports Its First 2 Cases of the New Coronavirus". New York Times. Archived
from the original on 19 February 2020. Retrieved 19 February 2020.
811. Wikipedia, 2020 coronavirus pandemic in Iran (Accessed: 27 March 2020). Available
at: https://en.wikipedia.org/wiki/2020_coronavirus_pandemic_in_Iran
12. Aftabnews agency, Corona patients in Iran (Accessed: 27 March 2020). Available at:
https://aftabnews.ir/fa/news/641753 [in Persian]
13. Ministry of Health, Some characteristic of Covid19 in Iran (Accessed: 27 March 2020).
Available at: http://behdasht.gov.ir/uploads/factsheet%204.%2026.12%20-%20fa.pdf
[in Persian]
14. Aftabnews agency, We have not yet reached the peak of Covid19 (Accessed: 27
March 2020). Available at: https://aftabnews.ir/fa/news/642341 [in Persian]
15. Ministry of Health, Daily reports of Covid19 in Iran (Accessed: 27 March 2020).
Available at: http://behdasht.gov.ir/index.jsp?
siteid=1&fkeyid=&siteid=1&pageid=54782&newsview=201158 [in Persian]
16. Weisstein, Eric W. "Normal Distribution Function". MathWorld.
17. Johnson, Norman L.; Kotz, Samuel; Balakrishnan, N. (1994), "14: Lognormal
Distributions", Continuous univariate distributions. Vol. 1, Wiley Series in Probability
and Mathematical Statistics: Applied Probability and Statistics (2nd ed.), New York:
John Wiley & Sons, ISBN978-0-471-58495-7, MR1299979
18. Papoulis, Athanasios Papoulis; Pillai, S. Unnikrishna (2002). Probability, Random
Variables, and Stochastic Processes (4th ed.). Boston: McGraw-Hill. ISBN0-07-366011-
6.
19. Delignette-Muller ML, Dutang C. fitdistrplus: An R package for fitting distributions.
Journal of statistical software. 2015 Mar 20;64(4):1-34.
20. World Health Organization, WHO Director-General's opening remarks at the media
briefing on COVID-19 - 11 March 2020 (Accessed: 27 March 2020). Available at:
https://www.who.int/dg/speeches/detail/who-director-general-s-opening-remarks-at-
9the-media-briefing-on-covid-19---11-march-2020
21. "Rayleigh Distribution – MATLAB & Simulink – MathWorks Australia".
www.mathworks.com.au.
22. Novel Coronavirus (2019-nCoV) Situation Report-7 - World Health Organization
(WHO), January 27, 2020.
Figures
Figure 1
Histogram and three fitted distributions (Normal, Lognormal and Weibull) on the daily
infections with Covid-19 in Iran.
10Figure 2
Histogram and three fitted distributions (Normal, Lognormal and Weibull) on the daily
deaths with Covid-19 in Iran
Supplementary Files
This is a list of supplementary files associated with this preprint. Click to download.
corona.iran.dat
11You can also read