A COMPOSITE TRAPEZOIDAL AND SIMPSON RULE BASED TYPE2 FUZZY SYSTEM FOR ENHANCING AFDOA-HETRO-FRBCS - sersc
←
→
Page content transcription
If your browser does not render page correctly, please read the page content below
International Journal of Advanced Science and Technology
 Vol. 29, No.02, (2020), pp. 2549-2557

A COMPOSITE TRAPEZOIDAL AND SIMPSON RULE BASED TYPE2
 FUZZY SYSTEM FOR ENHANCING AFDOA-HETRO-FRBCS
 VR. NAGARAJAN* & Dr. D. VIMAL KUMAR*
 1
 Research Scholar, Nehru Arts and Science College, and Assistant Professor, PG &
Research Department of Computer Science, Shri Narayana Guru College, Coimbatore, Tamil
 2
 Professor & Head, Nehru Arts and Science College, Coimbatore, Tamil Nadu, India,

ABSTRACT
Prediction of diseases at an early stage is the most effective way of increasing the survival rate of
people. Various data mining techniques have been proposed for early prediction of disease. One of
the most efficient methods for disease prediction is Auto tuned hybridized Firefly and Differential
search evolution Optimization Algorithm with Heterogeneous Fuzzy Rule-Based Classification System
(AFDOA-Hetro-FRBCS). In FDOA-Hetro-FRBCS, the most representative features in the dataset
were selected using a hybridized optimization algorithm and its randomness parameters are fine
tuned by AFDOA. The selected features were given as input to Hetro-FRBCS which generates rules
for disease prediction. However, the value of membership degree used in FRBCS might include
uncertainty. In order to solve the uncertainty problem in AFDOA-Hetro-FRBCS, Type-2 FRBCS
(T2FRBCS) is proposed for disease prediction. In T2FRBCS, the value of membership function is
given by a fuzzy set that increases the fuzziness of a relation. Hence it has the ability to handle the
inexact information in a logically correct manner. One of the processes in T2FRBCS is type reduction
(TR) it represents a single value as a representative of the uncertainty. In this paper, composite
Trapezoidal rule with Weighted Enhanced Karnik-Mendel (TWEKM) and composite Simpson rule
with WEKM (SWEKM) methods are used to perform TR for TFRBCS. It enhanced the defuzzification
process in TFRBCS. The whole process is named as AFDOA-Hetro-Type-2 with TWEKM FRBCS
(AFDOA-Hetro-T2TFRBCS) and AFDOA-Hetro-Type-2 with SWEKM FRBCS (AFDOA-Hetro-
T2SFRBCS) those enhanced the accuracy of disease prediction by solving the uncertainty problem.

Keywords: Disease prediction, data mining, type-2 fuzzy set, Trapezoidal rule with Weighted
Enhanced Karnik-Mendel, composite Simpson rule with Weighted Enhanced Karnik-Mendel.

1. INTRODUCTION
 Exact review of medical data supports early detection of diseases through big data
development [1] in scientific and healthcare sectors. By applying data mining techniques in big data
brings a new dimension for early detection of disease. It has the capability to handle huge volume of
clinical data. Researchers have now investigated increasing ways of implementing data mining of
clinical data to predict diseases reliably. The irrelevant features in the clinical dataset affect the
performance of early disease prediction. Moreover, the irrelevant features lead to high computational
complexity. Hence, a good collection of features is important for the high accuracy of disease
prediction.
 In order to select the most representative features from the clinical dataset, a Modified
Differential Evolution (MDE) [2] was proposed. However, this method consumes more time for
feature selection because of using a large population to handle the premature convergence problem in
MDE. This problem was resolved by using Firefly Optimization Algorithm (FOA) [3] to select the
discriminative features and it was implemented in Map Reduce framework to further reduce the
consumption time for feature selection. The selected features were given as input to the Naïve Bayes
(NB), C4.5 and Random Forest (RF) classifiers to predict lung cancer, leukemia and heart disease.
Two different methods [4] were proposed to further enhance disease prediction accuracy. One of the
methods is FOA-Homo-FRBCS where only RF classifier was used in all mappers for disease
prediction whereas in another method FOA-Hetro-FRBCS different classifier such as RF, Bayesian
Tree and NeuroTree were used in all mappers for disease prediction. The FOA has slow convergence

ISSN: 2005-4238 IJAS 2549
Copyright ⓒ 2020 SERSC
International Journal of Advanced Science and Technology
 Vol. 29, No.02, (2020), pp. 2549-2557

problem which was solved by AFDOA-Hetro-FRBCS [5] where HFDOA was used for feature
selection and AFDOA was fine tuned by AFDOA. It enhanced the feature selection process and
disease prediction accuracy effectively. However, the FRBCS used type-1 fuzzy logic system which
leads to uncertainty problem. In this paper, Type-2 FRBCS (T2FRBCS) method is introduced to
minimize the effects of uncertainties in FRBCS. This method is appropriate to incorporate uncertainty
regarding membership into fuzzy set theory. When there is no uncertainty, a type-2 fuzzy set reduced
to type-1 fuzzy set by TR process. Here, TWEKM and SWEKM methods are used to perform TR.
The TWEKM and SWEKM effectively compute the centroids end points of T2FRBCS that used to
reduce the fuzzy sets. Based on the rule generated by T2TFRBCS and T2SFRBCS, the lung cancer,
leukemia and heart disease are predicted.

2. LITERATURE SURVEY
 Ahmed et al. [6] proposed a lung cancer prediction system using data mining technique. The
data from various diagnostic centers was collected. Then, the data were pre-processed and clustered
by k-means clustering which identified the relevant and non-relevant data. Finally, the lung cancer
patients were predicted by applying the AprioriTid and decision tree algorithm on relevant data.
However, AprioriTid has the problem of high execution time and memory consumption. Bashir et al.
[7]
 proposed a multi-layered classification framework for medical decision support system. It used
combination of heterogeneous classifiers such as Support Vector Machine (SVM), Naïve Bayes (NB),
Decision Tree using the Gini Index (DT-GI), Linear Regression (LR), K-Nearest Neighbor (kNN) and
Decision Tree with Information Gain (DT-IG) and Quadratic Discriminant Analysis (QDA) for
disease prediction. It enhanced the disease prediction accuracy by using heterogeneous classifiers at
multiple layers. However, there may be controversy results obtained from the heterogeneous
classifiers which affect the efficiency of disease prediction. Daqqa et al. [8] proposed a prediction and
diagnosis method using classification algorithm to predict leukemia disease. The primary objective of
this method is to classify leukemia patients using DT, k-NN and SVM classification algorithms on the
basis of patient’s fitness, gender and age level. This method still needs improvement in terms of
accuracy. Mustaqeem et al. [9] proposed a hybrid model for cardiac disease prediction. This model was
comprised of two phases are prediction model and recommendation model. Initially, Synthetic
Minority Over-sampling Technique (SMOTE) was processed in the prediction model to balance the
dataset and then the ambiguities and noise in the dataset were removed. After the selection of optimal
features using attribute evaluation and ranker search algorithm, the selected features were processed
in SVM, Multi-Layer Perceptron (MLP) and Random Forest (RF) classifiers to predict cardiac
disease. Based on the prediction of cardiac disease, proper recommendation was given to the patients
in recommendation model. The efficiency of this model would be further enhanced by analyzing the
impact of individual features of patients. Purwanti & Calista [10] proposed an automatic detection of
lymphocyte leukemia method to detect lymphocyte leukemia. Initially, the data were collected from
peripheral blood smear single cell and the most representative features in the data were chosen using
shape feature and histogram features. The selected features were given as input to the k-NN to classify
the lymphocyte cells as normal lymphocytes and abnormal lymphocytes. However, the k values of
kNN greatly influence the efficiency of automatic detection of lymphocyte leukemia disease. Mohan
et al. [11] proposed an effective heart disease prediction technique called Hybrid Random Forest with
Linear Model (HRFLM). It used all features in the dataset without any restriction of feature selection
by making use of linear method and RF. Then, DT, language model, SVM, RF, NB and NN were
used to predict heart disease. However, accuracy level of this prediction method is low. Ali et al. [12]
proposed an expert system on the basis of stacked SVM for efficient prediction of heart disease. This
system was comprised of two SVM models. The first SVM model minimized the feature coefficients
to zero for removing the irrelevant features in the dataset. In the second SVM model, the pre-
processed data were processed to predict the heart disease. Moreover, Hybrid Grid Search Algorithm
(HGSA) was developed to fine tuned two SVM models which improved the accuracy of expert
system. However, proper selection of kernel function is more difficult in SVM.

ISSN: 2005-4238 IJAS 2550
Copyright ⓒ 2020 SERSC
International Journal of Advanced Science and Technology
 Vol. 29, No.02, (2020), pp. 2549-2557

3. PROPOSED METHODOLOGY
 In this section, the proposed AFDOA-Hetro-T2TFRBCS and AFDOA-Hetro-T2SFRBCS are
described in detail to predict different diseases. Initially, the clinical data are collected from different
datasets. The collected data is split into small blocks equal to the number of mappers. In each mapper,
AFDOA-Hetro-T2TFRBCS and AFDOA-Hetro-T2SFRBCS are processed and the results of mappers
are combined in the reducer for disease prediction.

3.1 Fuzzified the features using Type-2 Fuzzy Sets
 After the optimal selection of features using AFDOA, the type-2 fuzzy set is processed in
each mapper to fuzzified the optimal features. A normal type-2 fuzzy set ̃ can be processed as a
bivariate function on the Cartesian product, where the mapping is ̃ : × [0,1] → [0,1] is the
universe of the primary feature, , of ̃, i.e.,
 ̃ = {( , ), ̃ ( , )|∀ ∈ [0,1]} (3.1)
Eq. (3.1) is often named the point-value expression of T2FRBCS, ̃ ( , ) can also denoted as
 ( ).
A vertical slice of ̃ ( , ) is a secondary membership function which is given as follows:
 ′ ( )
 ̃ ( = ′ , ) ≡ ̃ ( ′ ) = ∫ ∈[0,1]

 (3.2)
 ̃
In Eq. (3.2), ∫ represents union over all admissible. ( ) is a simplified version of ̃ ( ′ ). Eq. (3.1) is
rewritten as,
 ̃( )
 ̃ = ∫ ∀ ∈
 (3.3)
The two-dimensional support of ̃ ( , ) is termed as Footprint Of Uncertainty (FOU) of ̃. It is
defined as follows:
 ( ̃) = {( , ) ∈ × [0,1]| ̃ ( , ) > 0} (3.4)
In Eq. (3.4), ( ̃) is bounded by higher membership function ̅ ̃ ( ) and underneath membership
function ̃ ( ).
If ̃ ( ) denotes the -cut of ̃( ), ∈ [0,1], i.e.,
 ̃( ) = { | ( ) ≥ } = [ ( ), ( )] (3.5)
For any feature ∈ , ̃( ) is treated as the following -cuts decomposition which is defined as
follows,

 ̃( ) = ⋃ [ ] = sup [ ]
 ̃
 ( ) ̃
 ∀ ∈[0,1] ( )
 ∀ ∈[0,1]
 = sup [ / ( ), ( ))] (3.6)
 ∀ ∈[0,1]
In Eq. (3.6), ∪ denotes the union operation and sup denotes the supremum. The vertical slices
representation of ̃ could be obtained by applying Eq. (3.6) in (3.3) as

 {⋃∀ ∈[0,1][̃ ( )]}
 ̃ = ∫∀ ∈

 (3.7)

Based on the above analyses, the -planes representation of ̃ can be expressed as,

 {∫ [
 ̃ ( )
 ∀ ∈
 ]}
 ̃ = ⋃∀ ∈[0,1] (3.8)

In Eq. (3.8), the -plane ̃ is the union of primary membership functions of ̃ whose secondary
membership degrees must be greater than or equal to i.e.,
 ̃ = {( , ), ̃( ) ( ) ≥ |∀ ∈ , ∀ ∈ [0,1]} (3.9)
The Eq. (3.9) is also expressed as,
 ̃ = ∫∀ ∈ ∫∀ ∈[0,1]{( , )| ̃( ) ( ) ≥ } (3.10)
Eq. (3.9) and Eq. (3.10) denote both the point-value and continuous forms, and ̃ can also be
expressed as,

ISSN: 2005-4238 IJAS 2551
Copyright ⓒ 2020 SERSC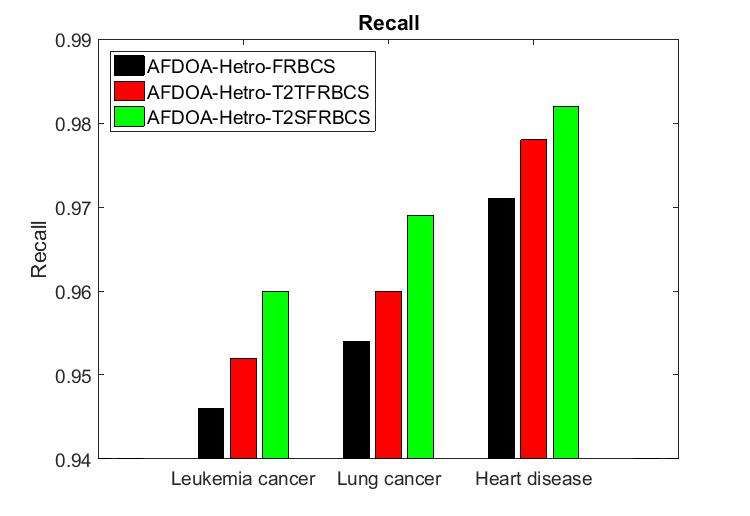
International Journal of Advanced Science and Technology
 Vol. 29, No.02, (2020), pp. 2549-2557

 ̃
 ( ) [ ( ), ( )]
 ̃ = ∫∀ ∈ = ∫∀ ∈ (3.11)
Moreover, an -plane which is raise to the -level is generally represented as ̃ , i.e.,

 ̃ = ̃ (3.12)

In Eq. (3.12), ̃ is an Type-2 fuzzy set of FRBCS whose secondary membership values equal to .
A type-2 fuzzy set can be completely distinguished by its higher membership function and underneath
membership function.

3.2 Rule generation using Type-2 Fuzzy Logic Systems
 The fuzzified features are given as input to the RF, Bayesian Tree and NeuroTree which
generates tree for disease prediction. Then, the rules are generated as
 ̃ and … is
 If 1 is ̃ , then is ̃ = 1,2, … (3.13)
In Eq. (3.13), is the number of fuzzy rules, 1 ∈ 1 , … ∈ are optimized features, ̃ ( =
1,2, … ; = 1,2, … ) are the antecedent Type-2 fuzzy sets and ̃ ( = 1,2, … ) are consequent
type-2 fuzzy sets. ̃ is used to denote the presence or absence of disease.
If = ′ , only the vertical slice ̃ ( ′ ) of antecedent type-2 fuzzy sets
 ̃ is activated, whose -cut
decomposition is
 ̃ ( ′ ) = sup [ ′ ′ ] (3.14)
 ∀ ∈[0,1] , ( ), , ( )
A firing interval is computed at the -level ̃ ( ′ ) for every fuzzy rule which is given as follows:
 ( ′ ) ≡ [ ( ′ ), ̅̅̅̅̅
 ( ′ )]

 : ( ′ ) ≡ =1 , ( ′ ) (3.15)

 ̅̅̅̅̅ ( ′ ) ≡ ,

 ( ′ )
 { =1
In Eq. (3.15), represents the minimum or product t-norm operation. If that the -plane ̃ of the
consequent Type-2 fuzzy sets at the -level is
 ̃
 ( ) [ ( ), ( )]
 ̃ = ∫∀ ∈ = ∫∀ ∈ , , (3.16)
After that, the firing interval of each fuzzy rules is intergraded with its corresponding consequent -
plane ̃ to obtain the firing rule -plane ̃ , i.e.,
 ( ̃ ) = [ ̃ ( | ′ ), ̅ ̃ ( | ′ )]

 ( )
 ̃ :
 ̃ ( | ′ ) = ( ′ ) ∗ , (3.17)

 ′ ′
 { ̅ ̃ ( | ) = ( ) ∗ , ( )
In Eq. (3.17), ∗ is the minimum or product operation. Then, combine all the ̃ ( = 1,2, … ) to get
the output -plane ̃ which is given as follows:

 ( ̃ ) = [ ̃ ( | ′ ), ̅ ̃ ( | ′ )]

 ̃ = ̃ ( | ′ ) = ̃ ( | ′ ) ∨ … ∨ ̃ ( | ′ )
 (3.18)

 ′ ′ ′
 { ̅ ̃ ( | ) = ̅ ̃ ( | ) ∨ … ∨ ̅ ̃ ( | )
In Eq. (3.18), ∨ denotes the maximum operation.

The Type-2 fuzzy sets are mapped into a Type-2 fuzzy set into Type-1 fuzzy set for defuzzification
process. The centroids of ̃ is computed to type-reduction (TR) set at the -level which is given as
follows:

 , ( ′ ) = ̃ ( ′ ) = ′ ′
 (3.19)
 ̃ ( ),
 [ ̃ ( )]

In Eq. (3.19), ∈ [0,1] and the two end points ̃ ( ′ ) and ̃ ( ′ ) can be computed by EKM
algorithm [13] as,

ISSN: 2005-4238 IJAS 2552
Copyright ⓒ 2020 SERSC
International Journal of Advanced Science and Technology
Vol. 29, No.02, (2020), pp. 2549-2557
∑ ̃ ( )
=1
̃ ( ′ ) = min ∑
(3.20)
̃ ( )
=1
̃ ( ),
̃ ( )∈{ ̅ ̃ ( )}
and
∑ ̃ ( )
=1
̃ ( ′ ) = max ∑
(3.21)
̃ ( )
=1
̃ ( ),
̃ ( )∈{ ̅ ̃ ( )}
In Eq. (3.21), represents the number of discrete points of the rule consequent primary variable. To
compute ̃ ( ′ ) and ̃ ( ′ ), WEKM algorithm is used which is given as follows,
WEKM algorithm for ̃ ( ′ )
1. Assign = [2.4]
2. Calculate = ∑ =1 ̅ ̃ ( ) + ∑
= +1 ̃ ( ), = ∑ =1 ̅ ̃ ( ) +
∑ ′
= +1 ̃ ( ) and =
3. Find ′ ∈ [1, − 1] such that ′ ≤ ′ ≤ ′ +1
4. If ( ′ == )
5. Assign ′ = ̃ ( ′ ) and =
6. else
max ( , ′ )
7. Calculate = ( ′ − ) and ′ = + ∑ =min( , ′ )+1 [ ̅ ̃ ( ) − ̃ ( )], ′ = +
max ( , ′ ) ′′ ( ′ ) ′
∑ =min( , ′ )+1 [ ̅ ̃ ( ) − ̃ ( )], = ′
′ ′′ ( ), ′ ′
8. Assign = = and =
9. Go to step 3
10. end if
WEKM algorithm for ̃ ( ′ )
1. Assign = [1.7]
2. Calculate = ∑ =1 ̃ ( ) + ∑
= +1 ̅ ̃ ( ), = ∑ =1 ̃ ( ) +
∑ ′
= +1 ̅ ̃ ( ) and =
3. Find ′ ∈ [1, − 1] such that ′ ≤ ′ ≤ ′ +1
4. If ( ′ == )
5. Assign ′ = ̃ ( ′ ) and =
6. else
max ( , ′ )
7. Calculate = ( ′ − ) and ′ = − ∑ =min( , ′ )+1 [ ̅ ̃ ( ) − ̃ ( )], ′ = −
max ( , ′ ) ′′ ( ′ ) ′
∑ =min( , ′ )+1 [ ̅ ̃ ( ) − ̃ ( )], = ′
′ ′′ ( ), ′ ′
8. Assign = = and =
9. Go to step 3
10. end if
In the above WEKM algorithm, a composite trapezoidal rule and composite Simpson rule are used to
integrate the rules. Such algorithms are named as TWEKM and SWEKM respectively. value used
in TWEKM is given as follows,
1
, = 1,
= {2 (3.22)
1, ≠ 1,
value used in SWEKM is given as follows
1
2
, = 1,
= {1, = 1 (2)& ≠ 1, (3.23)
2, = 0 (2)& ≠
ISSN: 2005-4238 IJAS 2553
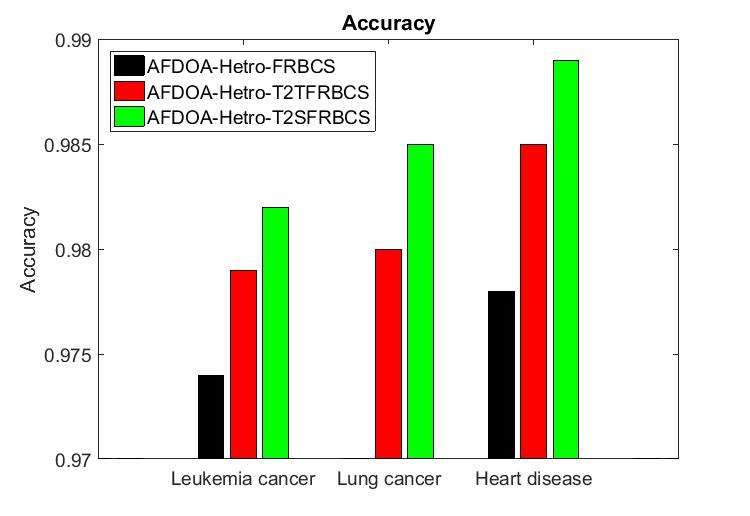
Copyright ⓒ 2020 SERSCInternational Journal of Advanced Science and Technology Vol. 29, No.02, (2020), pp. 2549-2557 In TWEKM and SWEKM, and are the switching points for the underneath and higher membership functions and ̃ ( ′ ) and ̃ ( ′ ) are the left and right end points of the centroids interval respectively. Finally, all the -planes are combined to constitute Type-1 fuzzy sets which is given as follows, = sup ( ′ ) (3.24) ∀ ∈[0,1] The value of is uniformly split into alpha-planes at 1 , 2 , … . Then the crisp output of Type-2 FRBCS is calculated as, ( ′ ) = ∑ =1 [( ̃ ( ′ ) + ̃ ( ′ )) /2] / ∑ =1 (3.25) Eq. (3.25) is the average of end points defuzzication method. Thus, the Type-2 FRBCS with TWEKM and SWEKM fuzzified and defuzzified the clinical data for disease prediction. 4. Result And Discussion The performance of AFDOA-Hetro-FRBCS, AFDOA-Hetro-T2TFRBCS and AFDOA-Hetro- T2SFRBCS are tested in terms of accuracy, precision, recall and f-measure. Here, the lung cancer, leukemia, and heart disease datasets [5] are used to test the existing and proposed disease prediction methods. 4.1 Accuracy Accuracy is the fraction of correct disease predictions over the total number of instances evaluated. It is calculated as, ( ) + ( ) = + ( ) + + ( ) where, is actual positive data (i.e., presence of disease) which are exactly predicted as positives, is the actual negative data (i.e., absence of disease) which are predicted exactly as negatives, is known negative data which are wrongly predicted as positives and is known positive data which are wrongly predicted as negatives. Figure 4.1 Evaluation of Accuracy The accuracy of AFDOA-Hetro-FRBCS, AFDOA-Hetro-T2TFRBCS and AFDOA-Hetro-T2SFRBCS methods for different datasets is shown in Figure 4.1. For the heart disease dataset, the accuracy of AFDOA-Hetro-T2SFRBCS method is 1.12% greater than AFDOA-Hetro-FRBCS and 0.41% greater ISSN: 2005-4238 IJAS 2554 Copyright ⓒ 2020 SERSC
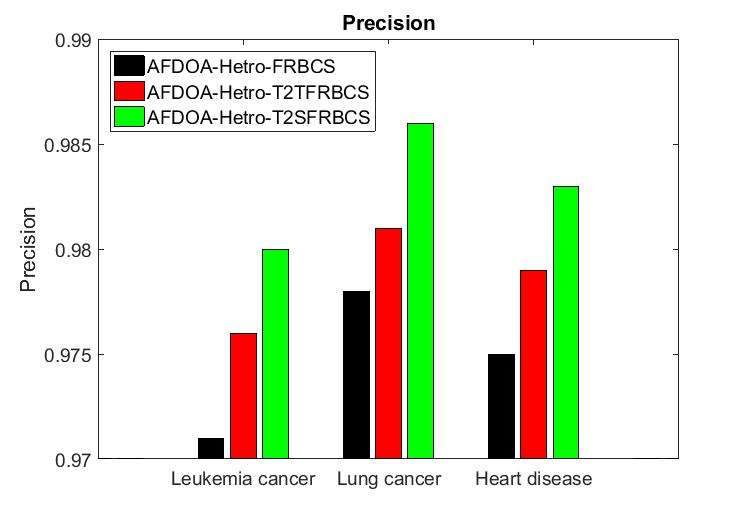
International Journal of Advanced Science and Technology
 Vol. 29, No.02, (2020), pp. 2549-2557

than AFDOA-Hetro-T2TFRBCS method. From this analysis, it is proved that the AFDOA-Hetro-
T2SFRBCS has high accuracy than other methods.

4.2 Precision
It is used to measure the positive patterns that are correctlyfrom the total predicted patterns in a
positive class. It is calculated as,

 =
 ( + )

Figure 4.2 Evaluation of Precision
The precision of AFDOA-Hetro-FRBCS, AFDOA-Hetro-T2TFRBCS and AFDOA-Hetro-
T2SFRBCS methods for different datasets is shown in Figure 4.2. For the heart disease dataset, the
precision of AFDOA-Hetro-T2SFRBCS method is 0.82% greater than AFDOA-Hetro-FRBCS and
0.41% greater than AFDOA-Hetro-T2TFRBCS method. From this analysis, it is proved that the
AFDOA-Hetro-T2SFRBCS has high precision than other methods.

4.3 Recall
It is used to measure the fraction of positive patterns that are correctly predicted. It is calculated as,

 =
 ( + )

ISSN: 2005-4238 IJAS 2555
Copyright ⓒ 2020 SERSC
International Journal of Advanced Science and Technology
 Vol. 29, No.02, (2020), pp. 2549-2557

Figure 4.3 Evaluation of Recall

The recall of AFDOA-Hetro-FRBCS, AFDOA-Hetro-T2TFRBCS and AFDOA-Hetro-T2SFRBCS
methods for different datasets is shown in Figure 4.3. For the heart disease dataset, the recall of
AFDOA-Hetro-T2SFRBCS method is 1.13% greater than AFDOA-Hetro-FRBCS and 0.41% greater
than AFDOA-Hetro-T2TFRBCS method. From this analysis, it is proved that the AFDOA-Hetro-
T2SFRBCS has high recall than other methods.

4.4 F-measure
It represents the harmonic mean of precision and recall. It is calculated as,
 .
 − = 2.
 +

ISSN: 2005-4238 IJAS 2556
Copyright ⓒ 2020 SERSC
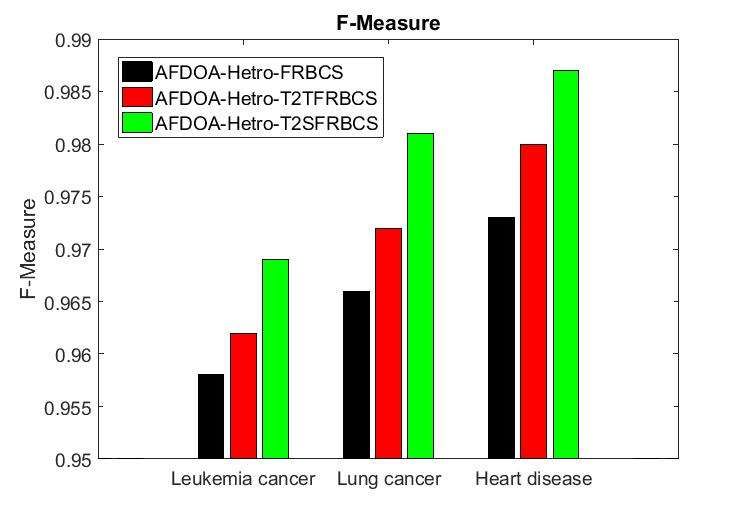
International Journal of Advanced Science and Technology
 Vol. 29, No.02, (2020), pp. 2549-2557

Figure 4.4 Evaluation of F-measure
The F-measure of AFDOA-Hetro-FRBCS, AFDOA-Hetro-T2TFRBCS and AFDOA-Hetro-
T2SFRBCS methods for different datasets is shown in Figure 4.4. For the heart disease dataset, the F-
measure of AFDOA-Hetro-T2SFRBCS method is 1.44% greater than AFDOA-Hetro-FRBCS and
0.71% greater than AFDOA-Hetro-T2TFRBCS method. From this analysis, it is proved that the
AFDOA-Hetro-T2SFRBCS has high F-measure than other methods.

5. CONCLUSION
 In this paper, the prediction accuracy of FRBCS based disease prediction method is further
enhanced by Type-2 fuzzy rule system. In T2FRBCS, primary membership and secondary
membership function to solve the uncertainty problems. The secondary membership function
increases the fuzziness of a relation by using the value of membership function given by a fuzzy set.
TR is used for the representation between Type-2 fuzzy set and Type-1 fuzzy set. It is achieved by
using Type-2 Trapezoidal FRBCS and Type-2 Simpson FRBCS. It enhances the defuzzication
process. Based on AFDOA-Hetro- T2TFRBCS and AFDOA-Hetro-T2SFRBCS, rules are generated
for lung cancer, leukemia and heart disease prediction. The experimental results prove that the
AFDOA-Hetro-T2SFRBCS method has high accuracy, precision, recall and f-measure than other
methods for disease prediction.

REFERENCES
 [1] Wang, L., & Wang, L. (2017). Disease Prediction by Machine Learning Over Big Data From
 Healthcare Communities. IEEE Access, 5, 88869-8879.
 [2] Vivekanandan, T., & Iyengar, N. C. S. N. (2017). Optimal feature selection using a modified
 differential evolution algorithm and its effectiveness for prediction of heart
 disease. Computers in biology and medicine, 90, 125-136.
 [3] Nagarajan, V. R., & Kumar, V. (2018). An optimized sub group partition based healthcare
 data mining in big data. International Journal for Innovative Research in Science &
 Tehnology (IJRST), 4(10), 79-85.
 [4] Nagarajan, V. R., & Kumar, V. (2019). An ensemble big data classification for healthcare
 data predication analysis. European Journal of Business & Social Sciences, 7(6), 160-172.
 [5] Nagarajan, V. R., & Kumar, V. (2019). Hybridized firefly and differential evolution
 optimization algorithm based feature selection for disease prediction. International Journal of
 Scientific & Technology Research, 8(10), 218-224.
 [6] Ahmed, K., Kawsar, A. A., Kawsar, E., Emran, A. A., Jesmin, T., Mukti, R. F., & Ahmed, F.
 (2013). Early detection of lung cancer risk using data mining. Asian Pacific Journal of Cancer
 Prevention, 14, 595-598.
 [7] Bashir, S., Qamar, U., Khan, F. H., & Naseem, L. (2016). HMV: A medical decision support
 framework using multi-layer classifiers for disease prediction. Journal of Computational
 Science, 13, 10-25.
 [8] Daqqa, K. A. A., Maghari, A. Y., & Al Sarraj, W. F. (2017, May). Prediction and diagnosis of
 leukemia using classification algorithms. In Information Technology (ICIT), 2017 8th
 International Conference on (pp. 638-643). IEEE.
 [9] Mustaqeem, A., Anwar, S. M., Khan, A. R., & Majid, M. (2017). A statistical analysis based
 recommender model for heart disease patients. International journal of medical informatics,
 108, 134-145.
 [10] Purwanti, E., & Calista, E. (2017, May). Detection of acute lymphocyte leukemia using k-
 nearest neighbor algorithm based on shape and histogram features. In Journal of Physics,
 853(1), 012011). IOP Publishing.
 [11] Mohan, S., Thirumalai, C., & Srivastava, G. (2019). Effective heart disease prediction using
 hybrid machine learning techniques. IEEE Access, 7, 81542-81554.

ISSN: 2005-4238 IJAS 2557
Copyright ⓒ 2020 SERSC
International Journal of Advanced Science and Technology
 Vol. 29, No.02, (2020), pp. 2549-2557

 [12] Ali, L., Niamat, A., Golilarz, N. A., Ali, A., & Xingzhong, X. (2019). An Optimized Stacked
 Support Vector Machines based expert system for the effective diagnosis of heart
 disease. IEEE Access, 7, 54007-54014.
 [13] Wu, D., & Mendel, J. M. (2008). Enhanced karnik--mendel algorithms. IEEE Transactions on
 Fuzzy Systems, 17(4), 923-934.

ISSN: 2005-4238 IJAS 2558
Copyright ⓒ 2020 SERSC
You can also read