Collecting and reporting mortality statistics for Covid-19 - Royal Statistical Society
←
→
Page content transcription
If your browser does not render page correctly, please read the page content below
Royal Statistical Society
    Official Statistics Section
 Health Statistics User Group
  Collecting and reporting
mortality statistics for Covid-19
   Wednesday May 20, 12.00-13.30
Collecting and reporting mortality
Statistics
Myer Glickman
Head of Quality, Methods and International

20 May 2020                                  )
Codes and causes
• U07.1 Confirmed COVID-19 (95%)
   • COVID-19, confirmed COVID-19, definite COVID-19, tested COVID-19, clinical
     COVID-19, novel coronavirus, new coronavirus, pandemic coronavirus,
     coronavirus 2019…
• U07.2 Suspected COVID-19 (5%)
   • Suspected COVID-19, maybe COVID-19, possible COVID-19, likely to be COVID-
     19, pneumonia in COVID-19 outbreak, heart disease during COVID-19
     pandemic…
• Underlying cause of death rules similar to influenza: 95% UCOD
• Deaths ‘due to’ is UCOD v. ‘deaths involving’ is any mention
Data and definitions
• DHSC/NHS England: deaths with positive test in hospital
• DHSC/PHE: deaths with positive test anywhere
• PHW, PHS, PHA: deaths with positive test anywhere
• CQC, CIW: deaths with reported COVID in care services
• ONS, NRS, NISRA: deaths with recorded COD anywhere
• + excess deaths – current v. average (usually 5yr)
Local users
                                              CCS
                                                                                   Wales

   Doctor
               Registration
                                        GRO            ONS            NWIS/PHW
                 Service
 Next of kin
Bereavement
   Officer
 Undertaker                                                       SAGE
                                              PHE                 DHSC
                                                                  No 10

Death                         Local users
registration                                        NHS Digital           Researchers
                               England
data flows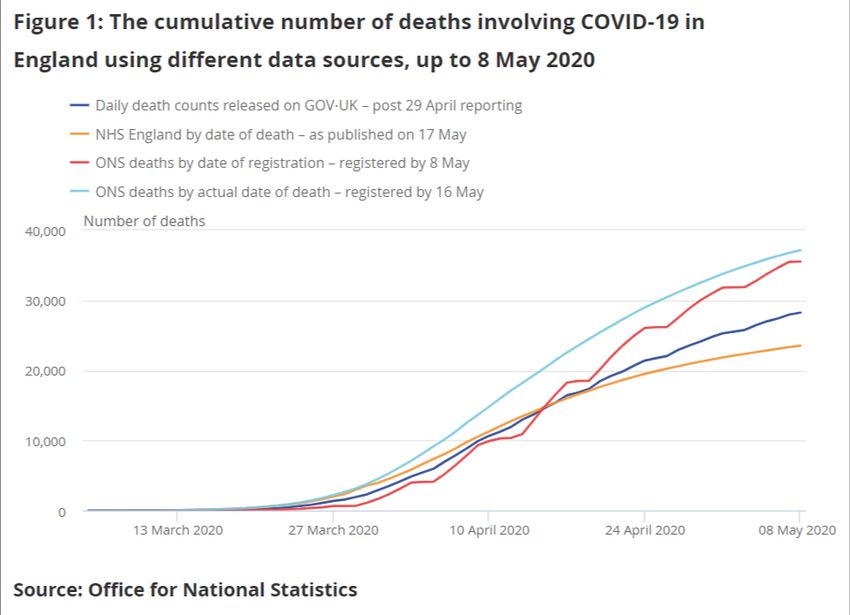
Analysis plans
• Weekly update and comparisons ONGOING
• Monthly occurrences analysis ONGOING
• Geography and deprivation DONE – TO REPEAT
• Ethnic group DONE – TO DEVELOP
• Care home residents - DONE
• Excess deaths – IN PROGRESS
• Religion – PLANNED
• Disability – PLANNED
• … WHAT ELSE?
COVID-19 and all-cause mortality

Dr Nick Andrews, PHE, Statistics Unit, Colindale
On behalf of

PHE COVID-19 Epi-Cell
PHE COVID-19 Surveillance Cell

                                                   May 2020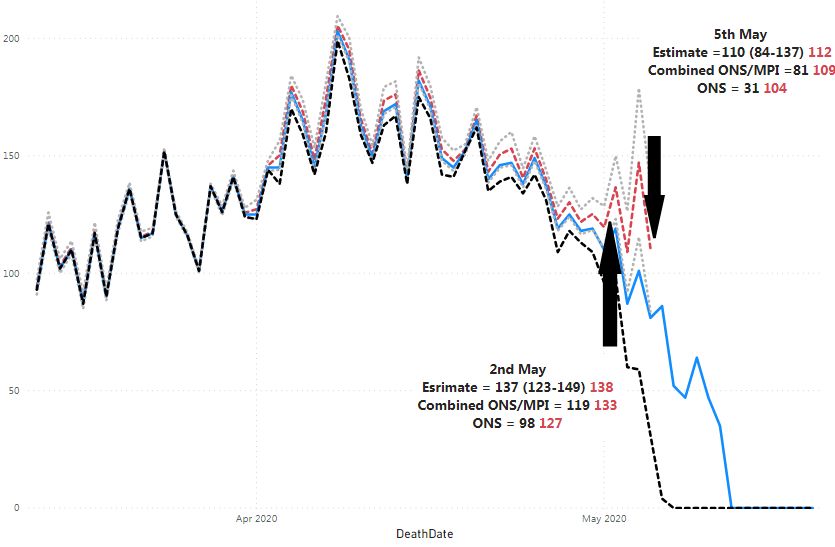
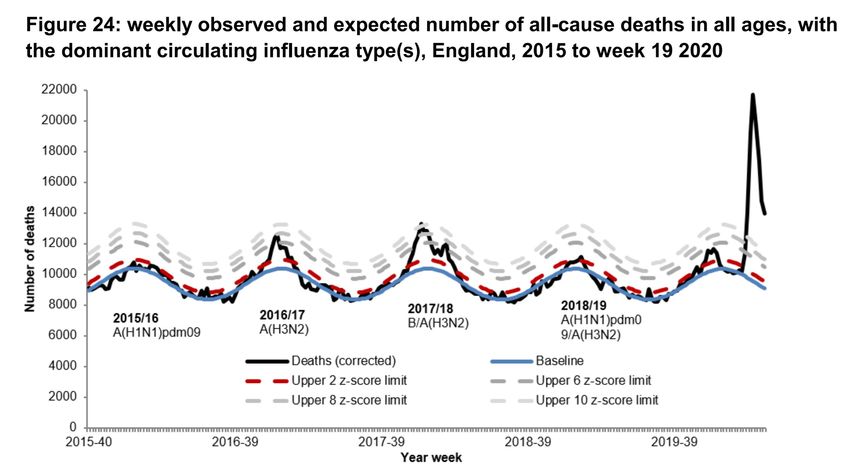
All Cause Mortality – published in the weekly
PHE Surveillance reports and Euro momo
• https://www.gov.uk/government/publications/national-covid-19-surveillance-reports
• https://www.euromomo.eu/

• Original Data source: General Register Office, Southport
• Data on all registrations to midnight provided to PHE the following day as
  aggregated data by date of death, date of registration, age in years, sex, region
  where death registered.
• Agreements to publish Z-score analysis (Euromomo) and to publish figures in the
  weekly mortality report as has been done with ONS weekly data since 2009.

• Results reported every Thursday for deaths to week ending previous Sunday.
Methods
Baseline is calculated using 5 years historic data with a Serfling (sine) wave
fitted to spring/autumn data and a trend. Model is Poisson with rescaling for
over dispersion. Thresholds and Z scores are calculated from this model.

Observed data are corrected based on the historic proportions of deaths
registered with delays of 0,1,2,3,….50 weeks. Each proportion P0 to P50 is
modelled with a trend in this proportion over time and based on the number of
days registration offices are closed within that interval. This can then be used
to adjust recent counts for registration delays.

Most deaths are registered within 3-4 weeks but delays can be long (many
months) if deaths go to a Coroner - common in younger ages (deaths where
individuals have not been seen recently by a doctor).
     COVID-19 Epidemiology
Output in latest PHE report COVID-19 Epidemiology
Euromomo output (Z scores)
All ages

0 to 4

 12   COVID-19 Epidemiology
15 to 64

  65+

    COVID-19 Epidemiology
Comments • Correction for most recent weeks is likely affected by a number of factors – e.g. very large # deaths in a week -> longer delay than in the past, but as numbers drop shorter delay than the past. • So initial under estimation more recently over estimation for most recent week. • Coroner referral probably does not generally apply to COVID deaths – so they come through faster –> over correction in younger ages. • Additional analyses at PHE include alternative baseline modelling, looking at daily all-cause excess and regional analysis. Also ONS coded data are assessed at PHE using daily data to look at excess with data on cause, place and other demographics on the death certificate and through linkage.
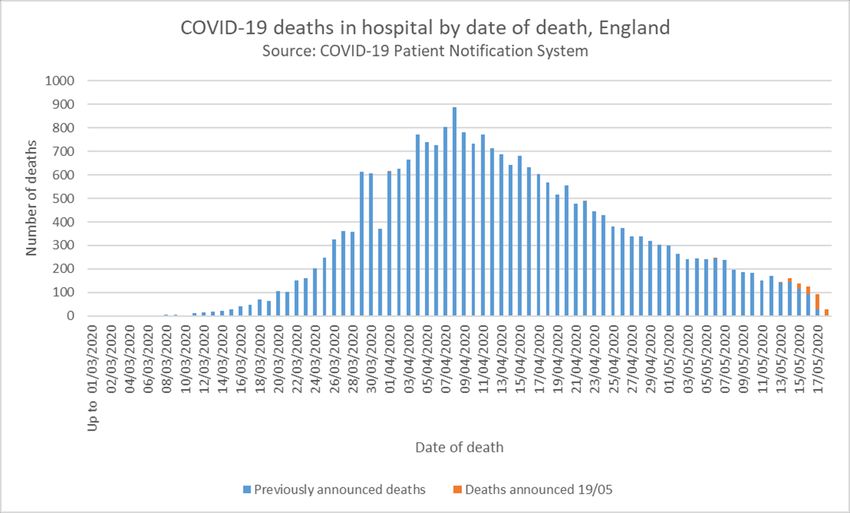
Hospital deaths data (not PHE)
Provided by NHS England - data are shown by trust and age group, gender, ethnicity, pre existing
   condition
https://www.england.nhs.uk/statistics/statistical-work-areas/covid-19-daily-deaths/

    Clinical outcomes and experiences of trans people
PHE data series on COVID-19 deaths
All deaths occurring in any setting among people who have had a COVID-19 positive test
result.
Data are combined from three different sources:
• Deaths occurring in hospitals, notified to NHS England by NHS trusts
• Deaths notified to local PHE Health Protection Teams in the course of outbreak
management
• Laboratory reports where a person has had a laboratory confirmed COVID-19 test
linked to death reports from electronic hospital records
Data from each source are validated and merged into single dataset, removing
duplicate recordsData / reports available
• Numbers are published (just overall total) :
https://coronavirus.data.gov.uk/about#covid-19-associated-deaths
• Full details on the data:
https://assets.publishing.service.gov.uk/government/uploads/system/uploads/attachment
_data/file/882565/Technical_Summary_PHE_Data_Series_COVID-
19_Deaths_20200429.pdf
• PHE Surveillance report gives more details including ethnicity, age and sex. PHE are
currently looking to update dashboard with actual numbers.
https://www.gov.uk/government/publications/national-covid-19-surveillance-reports
• More analysis is paper submitted for publication in Eurosurveillance
Clinical outcomes and experiences of trans peopleDeaths in laboratory confirmed COVID-19 by date of death: England, 2 March -12 May 2020 Clinical outcomes and experiences of trans people
Age/sex pyramid of COVID-19 deaths in England,
      2 March to 12 May 2020
                95+
               85-94
               75-84
               65-74
Age in years

               55-64
               45-54
               35-44
               25-34
               15-24                                                                                   Male    Female
Daily deaths and proportion that occur in care homes,
hospitals, and other locations, England
65+ year olds
Total Care home Hospital Other
Number of daily deaths
800 100
700
80
600
% of deaths in past 7d
500
60
400
40
300
200
20
100
0 0
02/03/2020 09/03/2020 16/03/2020 23/03/2020 30/03/2020 06/04/2020 13/04/2020 20/04/2020 27/04/2020 04/05/2020
Clinical outcomes and experiences of trans peopleDaily deaths and proportion that occur in care homes,
hospitals, and other locations, England
20-64 year olds
Number of daily deaths
160 100
90
140
80
120
% of deaths in past 7d
70
100
60
80 50
40
60
30
40
20
20
10
0 0
08/03/2020 15/03/2020 22/03/2020 29/03/2020 05/04/2020 12/04/2020 19/04/2020 26/04/2020 03/05/2020
Clinical outcomes and experiences of trans peopleStrengths and limitations
Strengths Limitations
- Mortality system developed rapidly and - Excludes people who have died of
provides daily outputs COVID-19 who were not tested
- Multiple source ascertainment minimises - Doesn’t explain all of the impact of
underreporting and reporting delay COVID-19 on excess mortality
- Capable of capturing deaths in all settings - Between 13 March and 26 April UK
testing policy limited to testing mainly
- Deaths linkable to ethnicity and locally people in hospital settings. This means
assigned information on residential it is possible that people who died in
deprivation community or residential settings may
- Clear, consistent definition allows have been underestimated.
monitoring of trends
Clinical outcomes and experiences of trans peopleQuestions
Also thanks to Mary Sinnathamby and Alison Brown for help with slides
COVID-19 EpidemiologyReporting of COVID-19 deaths in Scotland Scott Heald, Public Health Scotland Julie Ramsay, National Records of Scotland
COVID-19 Statistics in Scotland - 1
  3 main producer bodies in Scotland:
     • National Records of Scotland (NRS)
     • Scottish Government
     • Public Health Scotland (PHS)
  Public Health Scotland was formed on 1st April 2020, comprises:
     • Information Services Division (ISD)
     • Health Protection Scotland (HPS)
     • NHS Health Scotland
  Across Scotland, statistics producers have worked together to
  ensure COVID-19 statistics are aligned and coherent:
     • Scottish Government publish daily statistics
     • NRS and PHS produce weekly reports
COVID-19 Statistics in Scotland - 2
Daily figures published by Scottish Government at 2pm,
including statistics on:
• COVID-19 test numbers (and positive results)
• Deaths from COVID-19 (see next slide)
• Patients in hospital and ICU with COVID-19
• Calls to NHS24, COVID-19 helpline and Scottish
Ambulance Service
• Care Homes
Weekly reports published by NRS and PHS every Wednesday at
12 noon:
• NRS – weekly overview of death statistics
• PHS – weekly overview of a range of statistics (including
special topics – this week ethnicity)Daily reporting of COVID-19 deaths
Figures are produced by PHS and published by Scottish Government
Definition
People with a lab-confirmed COVID-19 diagnosis who have died.
Deaths identified as follows:
• Prior to 2nd April (when number of deaths was low), based on
notification of deaths from NHS Boards after family liaison
had occurred
• From 2nd April (when numbers started to rise), based on
death registrations (a more robust method as the number of
deaths increases).
Figures continue to be published daily and differ from the NRS
weekly figures because NRS include suspected (but not confirmed)
cases.Trend in daily lab-confirmed COVID-19 deaths
Cumulative deaths involving COVID-19 using different
                    data sources
Deaths by week of registration
Excess deaths by underlying cause
COVID-19 death rate by SIMD Quintile
COVID-19 death rate by urban/rural
         classification
Mortality reporting in Wales and estimation of total numbers of deaths using capture-recapture methods Gareth John NHS Wales Informatics Service
How are COVID-19 deaths reported in Wales?

 2 primary sources of data for published COVID-19 deaths:

 • Office for National Statistics registered deaths
 • Public Heath Wales rapid surveillance

 Other sources used within NHS Wales:

 • Electronic Master Patient Index (eMPI)
 • Mortality surveillance e-form
ONS Notifications only ONS combined with MPI notifications
Public Health
Local Health Board of Residence U071 U071 Any U071 or U072 U071 or U072 U071 any mention or U071 or U072 any
Wales
Underlying mention Underlying Any mention MPI with +ive COVID19 mention or MPI with
dashboard*
test result +ive COVID19 test result
Betsi Cadwaladr University Health Board 253 268 272 289 304 325 207
Aneurin Bevan University Health Board 396 420 414 443 427 450 260
Hywel Dda University Health Board 87 95 96 105 99 109 56
Cwm Taf Morgannwg University Health Board 282 304 339 369 324 389 256
Cardiff and Vale University Health Board 298 321 367 399 331 409 236
Powys Teaching Health Board 53 56 75 80 59 83 13
Swansea Bay University Health Board 215 232 246 266 236 270 193
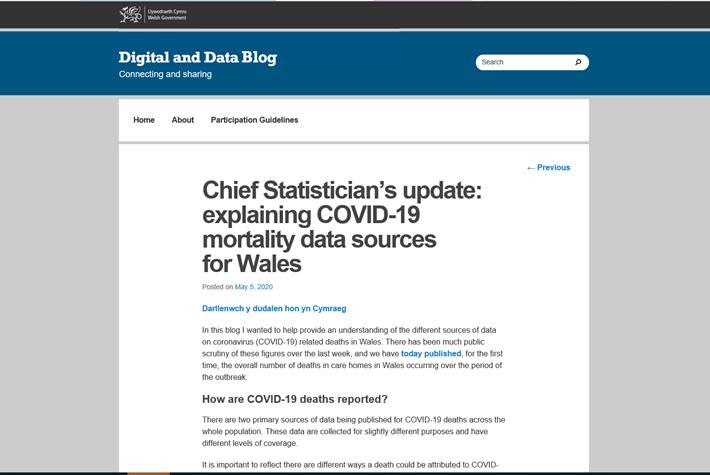
Wales 1584 1696 1809 1951 1780 2035 1221More information: • Chief Statistician’s blog: “explaining COVID-19 mortality data sources for Wales” https://digitalanddata.blog.gov.wales/2020/05/05/chief-statisticians-update-explaining- covid-19-mortality-data-sources-for-wales/
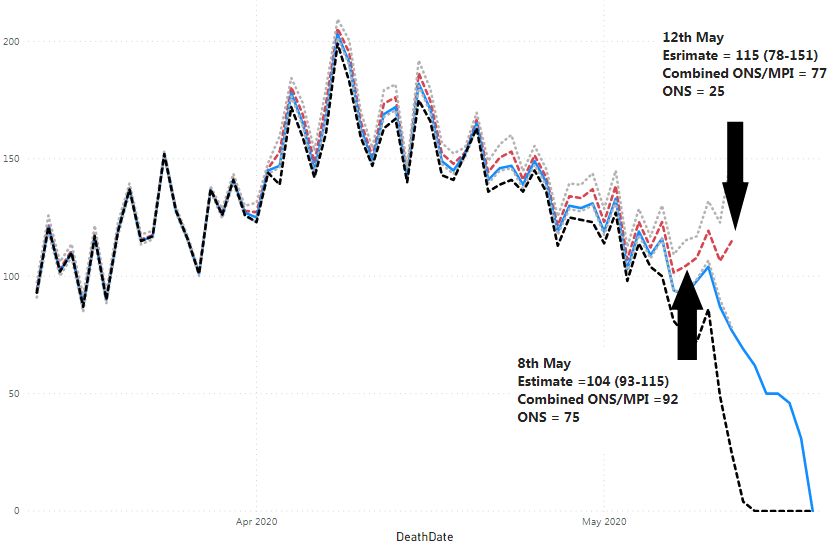
Providing timely death figures to
support COVID-19 modelling work
Estimating numbers of death for the latest period using
  Capture-Recapture methods?
• “Capture and recapture” or “Mark and recapture” is a method commonly used in ecology to estimate an
  animal population's size, where it is impractical to count every individual.

• Involves an initial capture, mark, and release of a sample of animals, and then a repeat of the process, in
  which the proportion of animals caught in both samples is used to estimate the total population numbers

• In the context of estimating numbers of deaths, we use the fact that we have our two different sources of
  death notifications, ONS and MPI.

• We equate
    •   the number of animals captured in the first sample to the number of ONS Death records received (n)
    •   the number of animals caught in the second sample to the number of MPI death notifications received (K)
    •   the number of animals caught in both samples to the number of deaths independently notified by both the ONS and
        MPI (k).

• Given these assumptions, the most simple estimate for the total numbers of deaths (N) is given as follows
Estimate for Wales deaths (all causes) as at 19th May 2020
Combined (ONS/MPI)
ONS Deaths received
Estimated deaths
Upper confidence limit
Lower confidence limitEstimate for deaths in Wales (all causes) as at 12th May 2020
Combined (ONS/MPI)
ONS Deaths received
Estimated deaths
Upper confidence limit
Lower confidence limitConclusion and next steps • The Capture-Recapture methodology offers a simple but seemingly robust and accurate way of tracking the number of deaths in a population in a timely fashion. • It does not need the data sources to be complete, but it does require the records to be as representative a sample as possible, and for those two sources to be as independent as possible. • It is difficult to ascertain how independent the MPI and ONS sources are, and we have seen that as the relative proportions of community to hospital deaths change, this can affect the accuracy of our estimates. • The only sure way of taking into account independence is to introduce a third source of data, and there are well established 3-source capture-recapture methods, and a package in R (Rcapture), which are able to produce more sophisticated estimates and confidence intervals in these cases.
gareth.john@wales.nhs.uk
What local users need from mortality data on
COVID-19
• Timeliness
• Comparability and consistency
• Granularity
• Content
• Flexibility
• Freedom to share
You can also read