Using Graph Template Language and R for High
←
→
Page content transcription
If your browser does not render page correctly, please read the page content below

Using Graph Template Language and R for High-
              Quality Publication Plots

SAS and all other SAS Institute Inc. product or service names are registered trademarks or trademarks of SAS Institute Inc. in the USA and other countries. ® indicates USA registration. Other brand and product names are trademarks of their respective companies.
EPOSTERBOARDS TEMPLATE
Huei-Ling Chen, Jeff Cheng
Merck & Co., Inc.
ABSTRACT GRAPH TEMPLATE LANGUAGE (cont.) GRAPH TEMPLATE LANGUAGE (cont.)
The Graph Template Language (GTL) is a powerful SAS® tool to create DISPLAY MULTIPLE-CELL GRAPH WITH NESTED LAYOUT LATTICE
sophisticated plots. There are many features in GTL that one can use to build • Block A, the first level
plots with high-quality visual effects. Besides SAS, R is also a frequently used LAYOUT LATTICE
tool. This paper explores some GTL techniques for generating a publication-
quality graph by creating and combining a pie chart and a bar chart, fine-tuning
statement, creates two
rows by setting rows=2. B
axis and plot position, and embedding texts for clarifications. Step-by-step The rows are then
instructions for making this graph are shown in both GTL and R to demonstrate represented by nested
how certain graphics elements and effects can be accomplished using
either. There are numerous software applications for plotting scientific
LAYOUT LATTICE
statements as indicated
A
graphs. Some people use SAS to prepare the data set and rely on other software in Block B and C. Each
for plotting the graph. This approach involves converting the SAS data set to
other data formats to facilitate use with different software. Companies
statement will then
contain pie charts and
C
sometimes contract outside vendors for plotting scientific graphs. However, by bar plots, respectively.
taking advantage of the capabilities of SAS and R for generating high-quality
• Block B sets columns=4
publication plots, many of these tasks can be done in-house, which makes a Figure 3: Pie Bar Chart without Texts in the Plot (SAS output)
to create four columns
good business case for time and cost savings, and for data protection. EMBED TEXTS IN THE PLOT
for four pie charts.
SIDEBAR ENTRY Statement
• Block C sets columns=4
GRAPH TEMPLATE LANGUAGE to create four columns
• align=
• rotate=
PIE CHART for four bar charts.
• The rowdatarange = CELLHEADER ENTRY Statement
union option assures
that the data ranges of DRAWTEXT Statement
all plots in the row cell • drawspace=
share a common axis • x=, y=
range. • anchor=
Figure 1: Sample Pie Chart (SAS output)
BAR PLOT • The border=false
FINE TUNING AXIS AND PLOT POSITION specifies no border is
drawn around the
• PAD Statement layout.
• COLUMNGUTTER Statement
• ROWWEIGHTS / COLUMNWEIGHTS STATEMENT
• YAXISOPTS Statement
Figure 2: Sample Bar Chart (SAS output)
SAS and all other SAS Institute Inc. product or service names are registered trademarks or trademarks of SAS Institute Inc. in the USA and other countries. ® indicates USA registration. Other brand and product names are trademarks of their respective companies.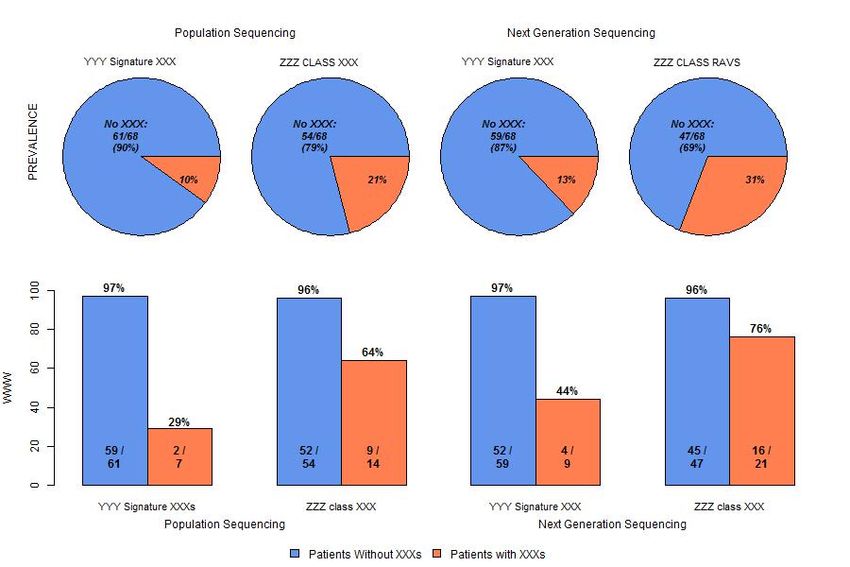
EPOSTERBOARDS TEMPLATE
RESULTS CONTINUED (CLICK TO EDIT)
CONCLUSIONS
R Code R CodeRESULT
(continued) Conclusion
R Code Example
CELLHEADER ENTRY
SIDEBAR ENTRY statement
align=top Standard data analysis procedures often involve data format manipulation, QC,
Pie Chart floating.pie(xpos, ypos, x, edges=200, floating.pie(1.7,2.5,c(90,10),radius=0.5,col=c("co
radius=1,col=NULL,startpos=0, rnflowerblue", "coral"))
statement
analysis, analysis summaries and result visualizations. Sometimes people use
shadow=FALSE,shadow.col=c("#ffffff","#ccc SAS for all but the last of the aforementioned steps. Instead of using SAS, they
ccc"),...)
Bar Plot barplot(height, width = 1, space = NULL, barplot(as.matrix(data), main=" ", ylab = "WWW", SIDEBAR ENTRY
statement
DRAWTEXT statement
send their data to other software applications, such as PRISM, Origin, Sigmaplot
names.arg = NULL, legend.text = NULL, beside=TRUE, col=colours, ylim=c(0,100), align=left
anchor=topleft
etc.,an extra step that creates opportunity for introducing errors. Some
beside = FALSE, horiz = FALSE, density = names.arg = c("YYY Signature XXXs", "ZZZ
NULL, angle = 45, col = NULL, border = class XXX", "YYY Signature XXX", "ZZZ class companies, if budget allows, even hire outside vendors to create plots for them.
par("fg"), main = NULL, sub = NULL, xlab = XXX"), cex.lab = 1 , cex.main = 1.2, In addition to the extra cost, this approach also means that the company has to
NULL, ylab = NULL, xlim = NULL, ylim = cex.names=0.9)
NULL, xpd = TRUE, log = "", axes = TRUE, share their data with other entities.
axisnames = TRUE, cex.axis =
par("cex.axis"), cex.names = This paper demonstrates that SAS and R can create publication quality plots,
par("cex.axis"), inside = TRUE, plot = which facilitates production of these plots in-house. This has many benefits
TRUE, axis.lty = 0, offset = 0, add =
FALSE, args.legend = NULL, …) including: creating and retaining reusable codes, minimizing error by minimizing
Multiple-Cell Graph par(mfrow=(A,B)) par( mfrow = c( 2, 1 ) ) analysis steps, cost savings and data protection.
Fine Tuning Axis mar() for margin. #margins for pie chart
and Plot Position oma() for outer margin area par(mar=c(0,0,0,0)) Our group already has the capabilities of integrating SAS and R as part of an
#margins for bar plot
analysis and reporting package. SAS can create some reports by passing the data
par(mar=c(5,4,1,2),xpd=TRUE ) from SAS to R, calling R script in SAS, automatically generating the graph using R.
SIDEBAR ENTRY statement
par(oma = c(1, 0, 0, 0))
Figure 4: Pie Bar Chart with Texts in the Plot (SAS output) align=bottom Integrating SAS and R and taking advantages of the strengths of both can
Embed Texts in the text(x, y = NULL, labels = seq_along(x$x), text(c(1.6,2.8,4.0,5.2) , c(2.8), c("No become a powerful tool for analysis and reporting. It is a very feasible direction
Plot adj = NULL, pos = NULL, offset = 0.5, vfont XXX:\n61/68\n(90%)","No
= NULL, cex = 1, col = NULL, font = NULL, XXX:\n54/68\n(79%)","No
with lots of potentials for SAS/R users.
...) XXX:\n59/68\n(87%)","No XXX:\n47/68\n(69%)"),
cex=0.9, font=4)
PIE CHART
Part of the R ‘plotrix’ package, the floating.pie function creates a pie chart with
R Reference:
the first and second parameter xpos ypos specifying the x and y position of the
center of the pie chart. floating.pie function in rdocumentation.org:
BAR PLOT https://www.rdocumentation.org/packages/plotrix/versions/3.7/topics/floating.
The barplot function creates a bar plot with vertical or horizontal bars. The pie
names.arg= is a vector of names to be plotted below each bar or group of bars. barplot function in rdocumentation.org:
DISPLAY MULTIPLE CELL GRAPH https://www.rdocumentation.org/packages/graphics/versions/3.4.3/topics/barp
R uses par() function to combine multiple plots into one overall graph. The lot
mfrow=c(A, B) option in the par() function creates a matrix of AxB plot. plot function in rdocumentation.org:
EMBED TEXTS IN THE PLOT
https://www.rdocumentation.org/packages/graphics/versions/3.4.3/topics/plot
The function text() draws the text with two positional parameters: the first one for
the x coordinate position and the second one for the y coordinate position. Figure 5: Pie Bar Chart (R output)
SAS and all other SAS Institute Inc. product or service names are registered trademarks or trademarks of SAS Institute Inc. in the USA and other countries. ® indicates USA registration. Other brand and product names are trademarks of their respective companies.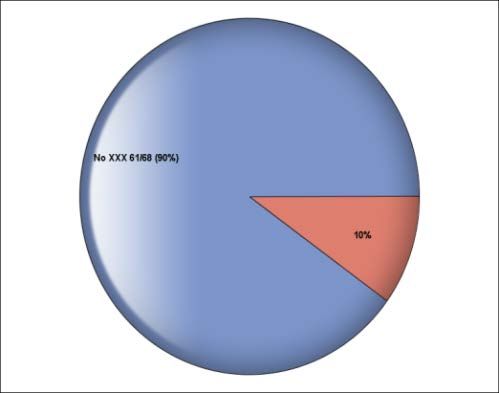
SAS and all other SAS Institute Inc. product or service names are registered trademarks or trademarks of SAS Institute Inc. in the USA and other countries. ® indicates USA registration. Other brand and product names are trademarks of their respective companies.
Paper 2493-2018
 Using Graph Template Language and R for High-Quality Publication Plots
                           Huei-Ling Chen, Jeff Cheng, Merck & Co., Inc.

ABSTRACT
                                                         ®
The Graph Template Language (GTL) is a powerful SAS tool to create sophisticated plots. There are
many features in GTL that one can use to build plots with high-quality visual effects. Besides SAS, R is
also a frequently used tool. This paper explores some GTL techniques for generating a publication-quality
graph by creating and combining a pie chart and a bar chart, fine-tuning axis and plot position, and
embedding texts for clarifications. Step-by-step instructions for making this graph are shown in both GTL
and R to demonstrate how certain graphics elements and effects can be accomplished using
either. There are numerous software applications for plotting scientific graphs. Some people use SAS to
prepare the data set and rely on other software for plotting the graph. This approach involves converting
the SAS data set to other data formats to facilitate use with different software. Companies sometimes
contract outside vendors for plotting scientific graphs. However, by taking advantage of the capabilities of
SAS and R for generating high-quality publication plots, many of these tasks can be done in-house, which
makes a good business case for time and cost savings, and for data protection.

INTRODUCTION
With step by step instructions, this paper will demonstrate how to make a multiple-cell graph consisted of
pie charts and bar charts using SAS or R. The first three sections cover GTL syntax for single pie chart,
single bar chart, and multiple-cell graph, respectively. The last section introduces corresponding R code
for generating the same plots. The plots generated by the GTL and R codes in this paper are also
presented.

PIE CHART
LAYOUT REGION and PIECHART statements are used to create a percent pie chart that is shown in
figure 1.
    -   CATEGORY specifies the variable to be analyzed. The category is a discrete variable.
    -   option STAT=PCT calculates the percentage of the CATEGORY variable
proc template;
  define statgraph pieplot;
     begingraph ;
       layout region ;
         piechart category=x1
           /stat=pct
            dataskin=gloss
            DATALABELLOCATION=inside
            DATALABELCONTENT=(category percent)
            labelfitpolicy=drop;
       endlayout;
     endgraph;
  end;                                                                Figure 1: SAS percent pie chart with
run;                                                                  gloss effect and labels for each
                                                                      category

                                                     1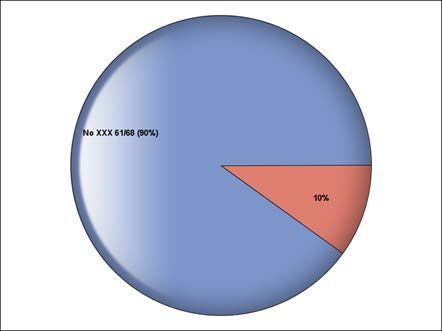
BAR CHART
LAYOUT OVERLAY and BARCHARTPARM statements are used to create the bar chart which is shown
in figure 2. Both BARCHART and BARCHARTPARM statements in GTL can be used to create bar chart.
The difference between the two is that BARTCHARTPARM does not perform calculation to summarize
the data. The data has to be pre-summarized before feeding it to the BARTCHARTPARM statement.
Whereas raw data can be fed directly into the BARDCHART statement.
    -   Option ORIENT layouts the bar chart to be vertical or horizontal.
    -   With ORIENT=VERTICAL, Y specifies the summarized result of the data to be displayed. X
        specifies the category variable.
proc template;
     define statgraph onebarplot;
        begingraph ;
          layout overlay / yaxisopts = (. . . )
                           xaxisopts = (. . . );
            barchartparm x=rava y=percenta
              / group=rava
                barwidth=0.8
                orient = vertical
                groupdisplay=cluster
                dataskin=gloss;
          endlayout;
        endgraph;
     end;                                                             Figure 2: SAS percent bar chart with
   run;
                                                                      gloss effect

DISPLAY MULTIPLE-CELL GRAPH WITH NESTED LAYOUT LATTICE
Multiple-cell graph such as the one depicted in figure 3, can be created by nesting multiple LAYOUT
LATTICE statements. As demonstrated in the example GTL code of this section, a graph can first be
divided into sub-graphs of different scopes, each associated with a LAYOUT LATTICE statement. These
statements can then be used to manipulate attributes such as number of charts to be included in the
associated sub-graphs.

KEY SYNTAX OF NESTED LAYOUT LATTICE
The LAYOUT LATTICE statement creates multiple-cell graphs with great flexibility to adjust the position of
the plots, the size of rows and columns, internal or external axis, internal or external labeling, external
sidebars.

Below code demonstrates the structure of the LAYOUT LATTICE statements for the plot in figure 3.
Block A, the first level LAYOUT LATTICE statement, creates two rows by setting rows=2. The rows are
then represented by nested LAYOUT LATTICE statements as indicated in Block B and C. Each
statement will then contain pie charts and bar charts, respectively. Block B sets columns=4 to create
four columns for four pie charts. Block C sets columns=4 to create four columns for four bar charts.

The rowdatarange=union option assures that the data ranges of all plots in the row cell share a common
axis range. The border=false specifies no border is drawn around the layout.

                                                     2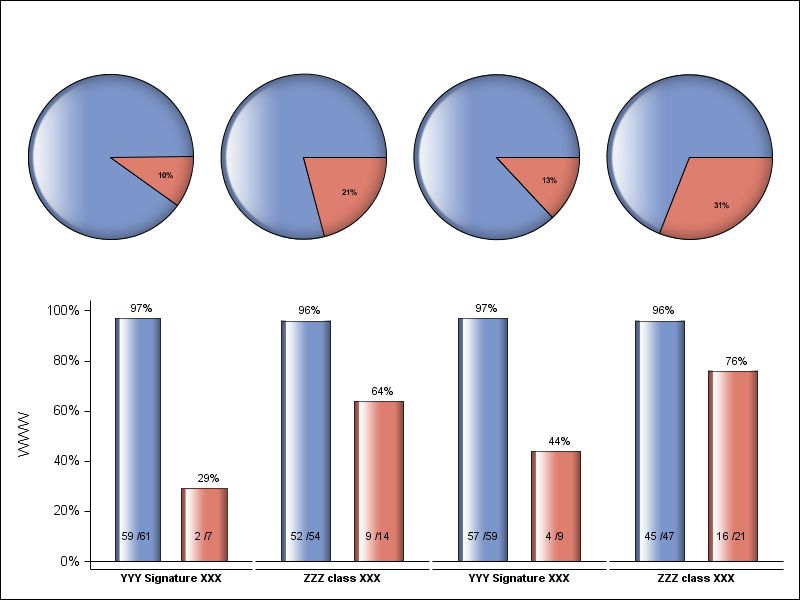
proc template;
                                  define statgraph piebarplot_notext;
                                      begingraph ;
                                      layout lattice / rows=2 rowweights=(0.5 0.5);
                                          layout lattice / columns=4 rowdatarange=union;
                                                   layout region / pad=10
                                                       piechart . . .
                                                   endlayout;
                                                   layout region / pad=10
                                                       piechart . . .
    4 Pie Charts on Top              B             endlayout;
            Row                                    layout region / pad=10
                                                       piechart . . .
                                                   endlayout;
                                                   layout region / pad=10
                                                       piechart . . .
                                                   endlayout;
                                            endlayout;

                                            layout lattice / columns=4 rowdatarange=union
                        A                          columndatarange=union border=false
                                                     columngutter=0
                                                     columnweights= (0.31 0.23 0.23 0.23);
                                                layout overlay / yaxisopts=(display=(label
                                                              line ticks tickvalues)
                                                              label='WWW')...
      4 Bar Charts on                                    barchartparm . . .
                                                 endlayout;
       Bottom Row
                                      C          layout overlay /yaxisopts=(display=none)...
                                                         barchartparm . . .
                                                 endlayout;
                                                 layout overlay / yaxisopts =(display=none)...
                                                         barchartparm . . .
                                                 endlayout;
                                                 layout overlay / yaxisopts =(display=none)...
                                                         barchartparm . . .
                                                 endlayout;
                                           endlayout;
                                       endlayout;
                                       endgraph;
                                  end;
                              run;

FINE TUNING AXIS AND PLOT POSITION
PAD Statement
The pad=10 statement specifies the amount of extra space that is added inside the layout border. The
default unit is pixels.

COLUMNGUTTER Statement
The columngutter= defined a vertical gap between all cells. Block C columngutter=0 means no gap
between bar charts.

ROWWEIGHTS / COLUMNWEIGHTS Statement
Block A rowweights= (0.5 0.5) setting specifies that the first row gets 50% of available row space, and
the second row gets 50%.

                                                    3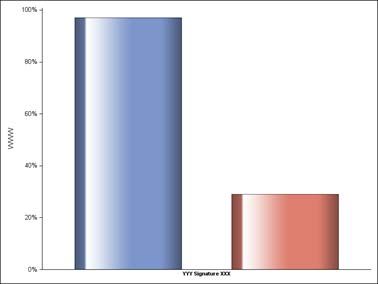
Block C columnweights= (0.31 0.23 0.23 0.23) setting specifies that the first column gets 31% of
available column space and the other three columns gets 23% each.

YAXISOPTS Statement
The first bar chart has yaxisopts= options with label, axis line, tick, and tick value specified. The other
three bar charts, on the other hand, has yaxisopts =(display=none). This is why the first bar chart gets
bigger column space (31%) than the other three bar charts (23%)

Figure 3: Pie Bar Chart without Texts in the Plot (SAS output)

Figure 3 is the SAS output created by the aforementioned techniques. Title, header, and the legend are
not generated yet at this point.

EMBED TEXTS IN THE PLOT
GTL has varieties of ways to add texts in the plot. This paper will introduce three statements: SIDEBAR
ENTRY, CELLHEADER ENTRY, and DRAWTEXT.

                                                     4
layout lattice / columns=4 rowdatarange=union ;
sidebar / align=top;
entry " ";
endsidebar;
sidebar / align=top ;
SIDEBAR entry " Population Sequencing Next Generation Sequencing"
ENTRY / TEXTATTRS = (weight=bold SIZE=10) ;
Statement endsidebar;
sidebar / align=left;
entry "PREVALENCE" / rotate=90;
endsidebar;
cell;
cellheader;
entry "YYY Signature XXX”
/border=false TEXTATTRS=(weight=bold SIZE=8);
CELLHEADER endcellheader;
ENTRY
layout region / . . . ;
Statement piechart . . . ;
endlayout;
endcell;
…
< other cell blocks for the other pie charts >
endlayout;
SIDEBAR ENTRY Statement
A SIDEBAR ENTRY statement supports the display of a string of texts spans across columns or rows. It
is useful for displaying information that applies to all of the columns or all of the rows. This paper utilizes
SIDEBAR for Y axis labeling, header across columns on the top of the four pie charts. The align= option
places the text on top, bottom, left, or right. The rotate= option specifies the angle of text rotation
measured in degrees. Here the text ‘PREVALENCE’ on the left is rotated 90 degree clockwise.
CELLHEADER ENTRY Statement
To add cell headers to each individual plot, there need to be a CELL block that contains a nested
CELLHEADER block. The CELLHEADER block can contain one or more ENTRY statements.
DRAWTEXT Statement
proc template;
define statgraph piebarplot_notext;
begingraph ;
layout lattice / rows=2 … ;
layout lattice / columns=4 … ;
…
endlayout;
layout lattice / columns=4 … ;
…
endlayout;
5drawtext textattrs=(size=7pt) "No XXX 61/68 (90%)"
/ x=10 y=80 drawspace=graphpercent
width=10 widthunit=percent
anchor=topleft
border=false ;
drawtext … ;
drawtext … ;
endlayout;
endgraph;
end;
run;
In the pie chart, though DATALABEL is specified to show category labeling, the label has too many
characters to be fully displayed in the plot. The solution is to utilize DRAWTEXT statement to
accommodate the long label. A drawtext statement puts text box in the graph area. The text box can
contain one or more lines of formatted text. The drawspace= option specifies the drawing space. User
can choose GRAPHPERCENT, GRAPHPIXEL, LAYOUTPERCENT, LAYOUTPIXEL, WALLPERCENT,
WALLPIXEL, DATAPERCENT, DATAPIXEL, or DATAVALUE. The x= and y= options specifies the
anchor point’s X and Y coordinate. The anchor= option specifies an anchor point for the text box on
CENTER, TOPLEFT, TOP, TOPRIGHT, LEFT, RIGHT, BOTTOMLEFT, BOTTOM, BOTTOMRIGHT.
SIDEBAR ENTRY statement
CELLHEADER align=top
ENTRY
statement
SIDEBAR DRAWTEXT
ENTRY statement
statement
align=left
SIDEBAR ENTRY statement
align=bottom
Figure 4: Pie Bar Chart with Texts in the Plot (SAS output)
6R CODE
R Code Example
Pie Chart floating.pie(xpos, ypos, x, edges=200, floating.pie(1.7,2.5,c(90,10),radius=0.5,col=c("
radius=1,col=NULL,startpos=0, cornflowerblue", "coral"))
shadow=FALSE,shadow.col=c("#ffffff","#
cccccc"),...)
Bar Chart barplot(height, width = 1, space = NULL, barplot(as.matrix(data), main=" ", ylab =
names.arg = NULL, legend.text = NULL, "WWW", beside=TRUE, col=colours,
beside = FALSE, horiz = FALSE, density ylim=c(0,100), names.arg = c("YYY Signature
= NULL, angle = 45, col = NULL, border XXXs", "ZZZ class XXX", "YYY Signature
= par("fg"), main = NULL, sub = NULL, XXX", "ZZZ class XXX"), cex.lab = 1 ,
xlab = NULL, ylab = NULL, xlim = NULL, cex.main = 1.2, cex.names=0.9)
ylim = NULL, xpd = TRUE, log = "", axes
= TRUE, axisnames = TRUE,
cex.axis = par("cex.axis"), cex.names =
par("cex.axis"), inside = TRUE, plot =
TRUE, axis.lty = 0, offset = 0, add =
FALSE, args.legend = NULL, …)
Multiple-Cell par(mfrow=(A,B)) par( mfrow = c( 2, 1 ) )
Graph
Fine Tuning mar() for margin. #margins for pie chart
Axis and Plot par(mar=c(0,0,0,0))
oma() for outer margin area
Position
#margins for bar chart
par(mar=c(5,4,1,2),xpd=TRUE )
par(oma = c(1, 0, 0, 0))
Embed Texts in text(x, y = NULL, labels = text(c(1.6,2.8,4.0,5.2) , c(2.8), c("No
the Plot seq_along(x$x), adj = NULL, pos = XXX:\n61/68\n(90%)","No
NULL, offset = 0.5, vfont = NULL, cex = XXX:\n54/68\n(79%)","No
1, col = NULL, font = NULL, ...) XXX:\n59/68\n(87%)","No
XXX:\n47/68\n(69%)"), cex=0.9, font=4)
Table 1: R code
PIE CHART
Part of the R ‘plotrix’ package, the floating.pie function creates a pie chart with the first and second
parameter xpos ypos specifying the x and y position of the center of the pie chart. The third parameter x
is the numeric vector of each value in the pie chart. The keyword parameters include the radius of the
pie in user units, col the colors of the sectors. Notice that in R code very often the value is presented in a
vector format, e.g. col=c("cornflowerblue", "coral"). The c() statement allows direct entry of small vectors
in programs.
BAR CHART
The barplot function creates a bar chart with vertical or horizontal bars. The names.arg= is a vector of
names to be plotted below each bar or group of bars. The beside=TRUE makes stacks bars and FALSE
makes columns portrayed as juxtaposed bars. The main= is the overall title of the plot. Here the
individual bar chart title is omitted, hence, main=” “. The ylim= is limits, range, for the y axis.
For many bar charts in the plotting area, bar label might overlap. You can adjust the bar label font size by
controlling the cex.names= option. The cex.lab= option controls the size of x and y labels relative to cex.
7The cex.main= option controls the size of titles relative to cex. The cex is a number indicating the
plotting text and symbols scaled relative to the default. 1 is default, 1.5 is 50% larger, 0.5 is 50% smaller.
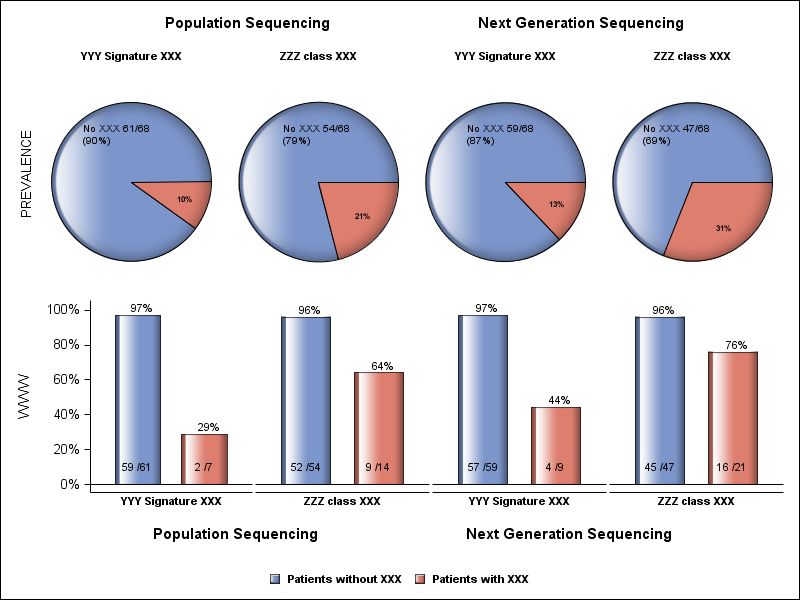
DISPLAY MULTIPLE-CELL GRAPH
R uses par() function to combine multiple plots into one overall graph. The mfrow=c(A, B) option in the
par() function creates a matrix of AxB plot. In the example of this paper, par(mfrow = c(2,1)), 2 rows 1
column matrix is created. One row is for pie charts, the other row is for bar charts.
FINE TUNING AXIS AND PLOT POSITION
R can adjust the margins for each plot by setting up mar() and oma() right before the plotting function.
The mar() function has a numeric vector of 4 elements which sets the margin sizes in the following order:
bottom, left, top, and right. There is no extra spaces needed for pie charts, the margins for pie charts are
set to 0 for each side, par(mar=c(0,0,0,0)). Bar charts need some space at the bottom to put the legend
and on the left the y axis ticks, ticks value, line, and label. The margins for bar charts hence is
par(mar=c(5,4,1,2),xpd=TRUE ). The function par(xpd=TRUE) enables things to be drawn outside the
plot region. Extra outer margin space can be extended by function oma().
EMBED TEXTS IN THE PLOT
The function text() draws the text with two positional parameters: the first one for the x coordinate
position and the second one for the y coordinate position. The keyword parameter labels specifies one
or more strings of texts to be written in the plot.
Figure 5: Pie Bar Chart (R output)
8CONCLUSION
Standard data analysis procedures often involve data format manipulation, QC, analysis, analysis
summaries and result visualizations. Sometimes people use SAS for all but the last of the
aforementioned steps. Instead of using SAS, they send their data to other software applications, such as
PRISM, Origin, Sigmaplot etc.,an extra step that creates opportunity for introducing errors. Some
companies, if budget allows, even hire outside vendors to create plots for them. In addition to the extra
cost, this approach also means that the company has to share their data with other entities.
This paper demonstrates that SAS and R can create publication quality plots, which facilitates production
of these plots in-house. This has many benefits including: creating and retaining reusable codes,
minimizing error by minimizing analysis steps, cost savings and data protection.
Our group already has the capabilities of integrating SAS and R as part of an analysis and reporting
package. SAS can create some reports by passing the data from SAS to R, calling R script in SAS,
automatically generating the graph using R. Integrating SAS and R and taking advantages of the
strengths of both can become a powerful tool for analysis and reporting. It is a very feasible direction
with lots of potentials for SAS/R users.
REFERENCES
R Reference:
• floating.pie function in rdocumentation.org:
https://www.rdocumentation.org/packages/plotrix/versions/3.7/topics/floating.pie
• barplot function in rdocumentation.org:
https://www.rdocumentation.org/packages/graphics/versions/3.4.3/topics/barplot
• plot function in rdocumentation.org:
https://www.rdocumentation.org/packages/graphics/versions/3.4.3/topics/plot
ACKNOWLEDGMENTS
The authors would like to thank the Merck management teams for their inputs on this paper.
CONTACT INFORMATION
Huei-Ling Chen
c/o Merck & Co., Inc.
126 Lincoln Avenue
P.O. Box 2000
Rahway, NJ 07065
Phone: 732-594-2287
e-mail: Huei-Ling_Chen@merck.com
Jeff Cheng
c/o Merck & Co., Inc.
126 Lincoln Avenue
P.O. Box 2000
Rahway, NJ 07065
Phone: 732-594-0109
e-mail: jeff.cheng@merck.com
9SAS and all other SAS Institute Inc. product or service names are registered trademarks or trademarks of
SAS Institute Inc. in the USA and other countries. ® indicates USA registration.
Other brand and product names are trademarks of their respective companies.
10You can also read