Purple Air Data Management Webinar - July 6, 2021 - nau.edu
←
→
Page content transcription
If your browser does not render page correctly, please read the page content below
Purple Air Data Management Webinar
            July 6, 2021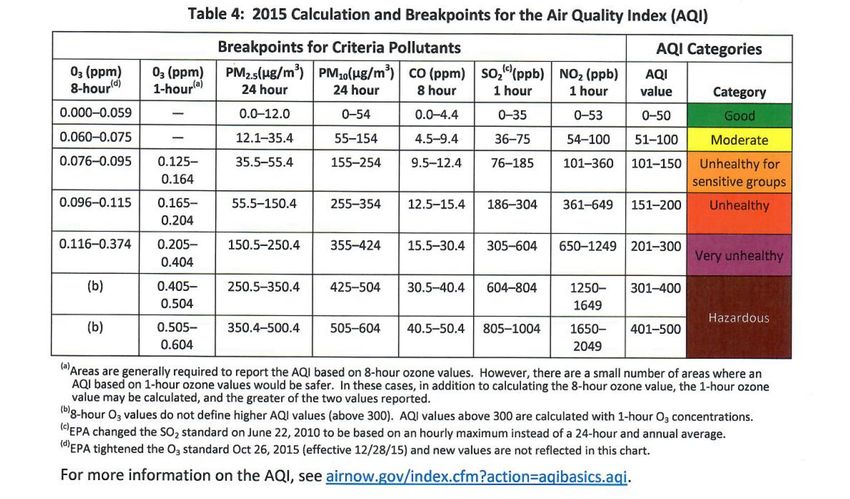
Webinar Logistics

   Click on the “Chat” icon to submit questions in the “Chat" pane

   Click raise “Hand” icon if you would like to be unmuted

   This webinar is being recorded – URL for the recording will be
   posted webinar email

       Presented by the Institute for Tribal Environmental
       Professionals
       American Indian Air Quality Training Program
       Questions? Contact Christal.Black@nau.edu
Polling Questions
Poll Question 1

• Which of the following best describes your role?
  o   Environmental Staff
  o   Community or Tribal Leader
  o   Federal or State Partner
  o   Other

Poll Question 2

• How many years have you worked in Air Quality?
  o   Less than a year
  o   1-3 years
  o   3-5 years
  o   5-10 years
  o   Over 10 years
Presenter
    Michael King
NAU ITEP TAMS Center   Michael King is the Technical Training Analyst with NAU ITEP’s Tribal Air Monitoring
                       Support (TAMS) Center. Mike started working for ITEP in 2019 where he provides
                       technical air monitoring assistance and data management for tribes throughout
                       Indian Country. Before working with ITEP, he worked in tribal air programs for over
                       ten years providing technical air quality management for the Southern Ute Indian
                       Tribe, Ute Mountain Ute Tribe, and Navajo Nation.

                       Mike received his BS degree in Environmental Science from Haskell Indian Nations
                       University in 2005 and a MS degree from Purdue University in 2013. Mike can be
                       reached by e-mail at Michael.King@nau.edu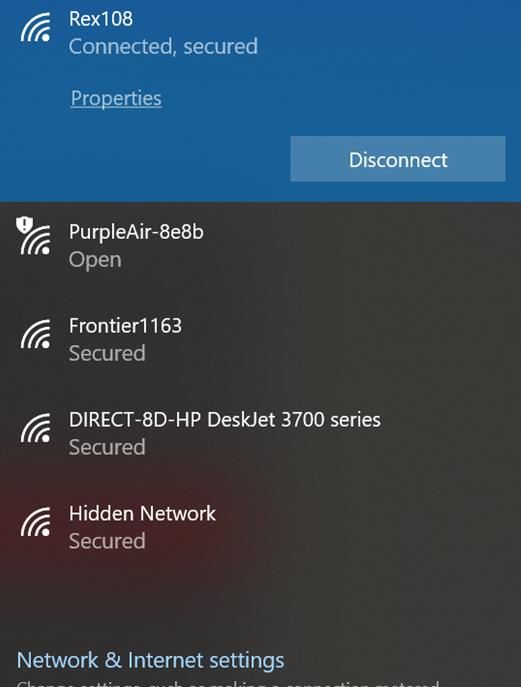
Webinar Overview

•   What is a Purple Air Sensor
•   Installation and Connectivity to WiFi
•   Data Download and Basic Interpretation of Data
•   Correcting Time Stamp and Charting Data
•   Pros and Cons of the Purple Air Sensor

Poll Question 3

• Do you currently operate a Purple Air Sensor or other
  Air Quality Sensor?
  o Yes
  o No
  o Unsure
What is a Purple Air Sensor
• A low-cost air sensor to measure particulate
  matter (PM), temperature and relative
  humidity
• Laser particle counter to measure PM1,
  PM2.5 and PM10 in units of micrograms per
  cubic meter (µg/m3) of air as well as particle
  counts in units of microns per deciliter
  (µm/dl) of air
• PurpleAir sensors are easy to install and only
  require a power outlet and WiFi. They use
  WiFi to report in real time to the PurpleAir
  map: https://www2.purpleair.com/

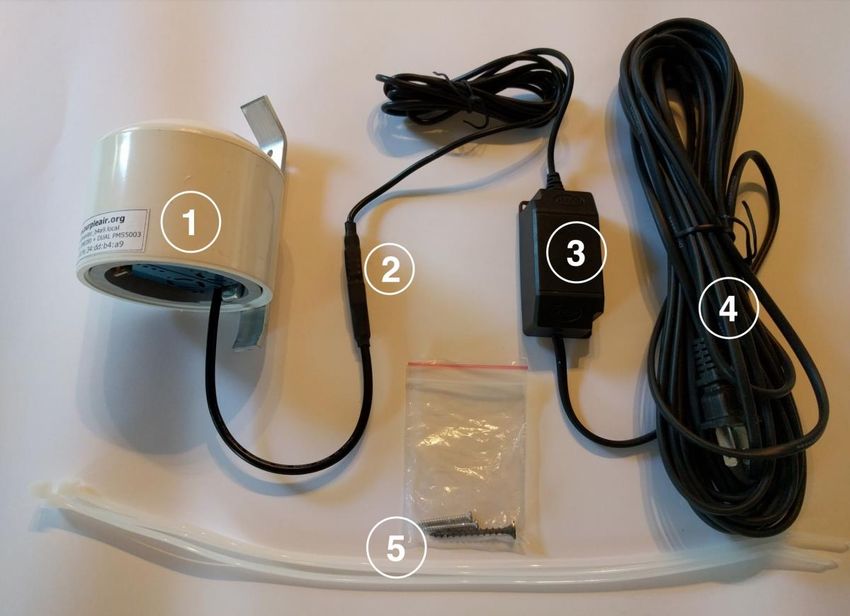
Installation of PurpleAir
 In the Box
 • Sensor
 • Outdoor power supply
 • Mounting screw
 • 3 zip ties
 Powering Sensor
 • Plug the micro USB end of the power supply into the base of
   the sensor
 • Plug the power supply into a wall outlet that works
 • Look for dim red glow inside the sensor to confirm power
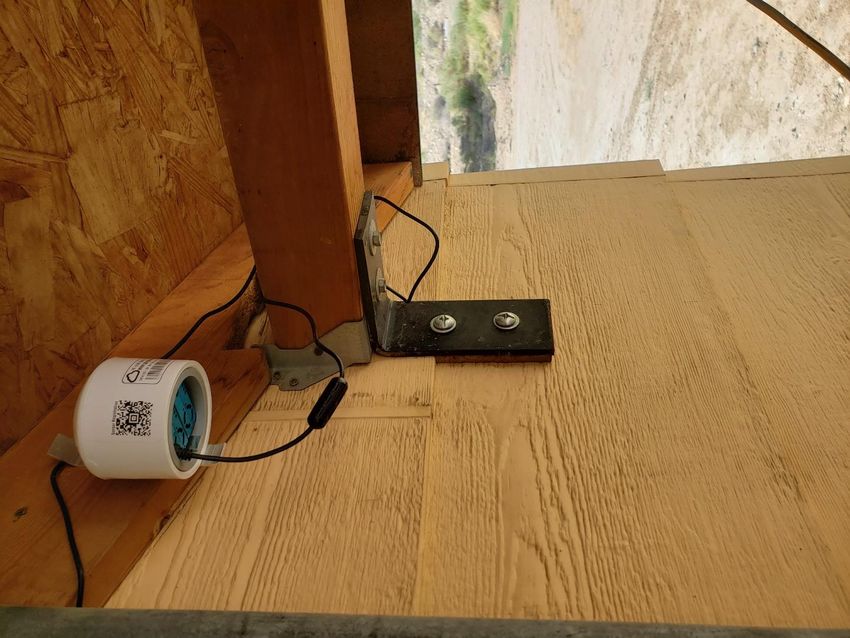
Installation of PurpleAir
• Select a location for mounting the
  sensor that has a solid Wi-Fi signal and
  is within 15 feet of a power outlet.

• Using zip ties or screws, mount the
  sensor under the eave of a roof or in a
  shady location.

• The sensor can be exposed to the
  elements, but it is preferable to mount
  the sensor in a location away from
  direct sunlight.
Tips on Purple Air Installation
• Choose a location that is easy to reach, power outlet is working, and within range of the WiFi
  network.
• Mount the sensor away from vents, local sources of direct pollution (i.e. burn barrels), and any
  foliage that would increase the likelihood of insects getting inside the laser counters.
• Install the sensor in the vertical position, with the open end facing toward the ground.
• Mount sensor high enough so rain water does not splash up into the underside of the sensor.
• Mount the power supply so that its does not submerge in rain water or become covered by snow.
• Use zip ties to fashion a "drip loop" to prevent water from running down the wires and into the
  electronics.
• Mounting the sensor in a shady spot to produce temperature readings that are not affected by
  direct sunlight.
• Please note that temperature readings are already elevated by as much as 10 degrees Fahrenheit
  due to heat generated by the WiFi module inside the sensor.
• Connect the power supply to a power outlet and tuck the wires away.
Connecting the Purple Air to WiFi
• Confirm power to sensor, go to
  www.purpleair.com/configure via PC, Tablet, Mobile
  Device
• Open the list of available WiFi networks. Click on WiFi
  network PurpleAir-****.
• A list of all available WiFi will show up as a pop-up on
  the PurpleAir configure website. If not click “Connect
  to Sensor”
• Choose the WiFi network you like the sensor to
  connect to, enter the password for that network, and
  click Save.
• The WiFi status bar will turn green once your PurpleAir
  sensor is connected to WiFi and transmitting data.
Tips on Connecting to WiFi
• It’s best to configure your sensor to WiFi with the router, computer/phone/tablet, and sensor
  in the same room.
• PurpleAir-**** is a 2-4 character code determined by your sensor. It may take up to up to 10
  minutes after the sensor is plugged in for this network to appear.
• After clicking on WiFi network PurpleAir-**** and if you receive the message “no internet
  connection is available,” the message can be ignored or allowed. This message is normal since
  the air sensor does not provide internet access to your phone, tablet or PC.
• Once the monitor successfully connects to WiFi, it will no longer appear in the list of available
  networks. The fact that it has disappeared means that the sensor is successfully configured to
  WiFi.
• The sensor data will not be displayed on the PurpleAir Map until the sensor is registered and
  recorded by PurpleAir.
• Once the sensor is successfully connected to your home WiFi, make sure to verify the local
  WiFi is connected back onto your phone, tablet or computer.
Registering Purple Air Sensor
 •   Go to www.purpleair.com/register
 •   Enter the sensor's Device-ID exactly as printed on the sensor's label
 •   Enter your email address and select your sensor as outside or inside.
 •   Enter sensor’s location name and latitude and longitude coordinates
 •   Accept terms & conditions
 •   Click register and look for a green "successful registration" notice. A registration
     confirmation email is sent to your email.
Video Demonstration of
Connecting Purple Air
https://www.youtube.com/watch?v=sfp-0uEQmaU
Let me at it !
More brain
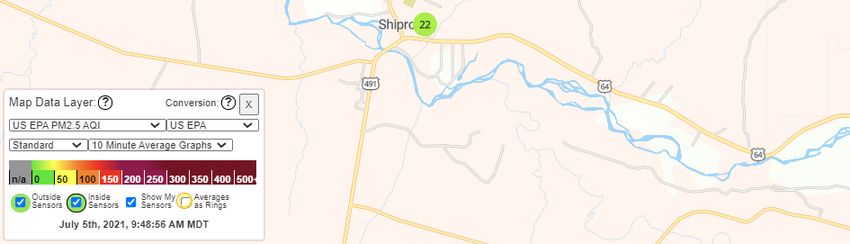
food !!How to Download Purple Air Sensor Data • Go to the Purple Air website: https://www2.purpleair.com/. Click on “View the Map” to get to the Purple Air Map. • Select a sensor location and click on it. • Go to Map Data Layer. US EPA PM2.5 Air Quality Index set as default. Select US EPA conversion factor. • Click on the Download icon which will take you to the Sensor Data Download Tool website. This tool allows you to download data for the selected sensor
Purple Air: Sensor Data Download Tool
•   Select your Start and End date
•   Select your averaging intervals: 10 min, 15 min, 30 min, 60 min, 1440 min
•   Download data from the sensor’s Channel A and/or Channel B measurements
•   Data is downloaded into a .CSV file.

                                      AQI Value with corresponding Concentration
Purple Air: Data Interpretation • Time stamp = Coordinated Universal Time or UTC time • Primary Data file: Outdoor PM1, PM2.5, PM10, Temp, RH measurements. • Secondary Data file: Outdoor particle counts (PM0.3, PM0.5,PM1, PM2.5, PM5, PM10) and Outdoor PM1 & PM10 measurements • Particle Count units = microns per deciliter (µm/dl) of air PM Outdoor units = micrograms per cubic meter (µg/m3) of air. • CF-1 values = correction factor for indoor measurements ATM = atmospheric or outdoor measurements • UptimeMinutes = sensor operation time RSSI_dbm = Received Signal Strength Indicator
Purple Air: SD Card Data Interpretation
•   Time stamp = Coordinated Universal Time or UTC time
•   Same parameters but 2 minute average intervals (large data sets)
•   .CSV file created for each day of sampling
•   Need tweezers to insert/remove SD card
•   Useful if WiFi connection is lost or unavailable
•   Data not reported to PurpleAir Map in real-time
How to Interpret the AQI Data Breakpoints

21
Purple Air: Time Stamp Correction
• How do correct to your sensor location time zone? Mountain Daylight Time (MDT) is 6
  hours behind UTC…
• Save .CSV file as an .XLSX file and do the conversion using Excel formulas
   • 1st Formula =LEFT(A2,19)
   • 2nd Formul =B2-(6/24)
• The Formula = LEFT(A2, 19) takes the leftmost nineteen characters from the time stamp
  (cell A2). This grabs only the date/time and leaves out the text of UTC
• In this example, the Formula = B2-(6/24) subtracts 6 hours from the timestamp for MDT.
  You need to use the 24 because of the way Microsoft Excel stores date/time values
• For other time zones, you would enter the relevant hour into that formula. For example,
  if you wanted to subtract 4 hours, the formula would be B2-(4/24).
Purple Air: Time Stamp Correction
Here are formulas for other time zones that you can copy and paste into your
spreadsheet

• Eastern Daylight Time: =B2-(4/24)       • Eastern Standard Time: =B2-(5/24)
• Central Daylight Time: =B2-(5/24)       • Central Standard Time: =B2-(6/24)
• Mountain Daylight Time: =B2-(6/24)      • Mountain Standard Time: =B2-(7/24)
• Pacific Daylight Time: =B2-(7/24)       • Pacific Standard Time: =B2-(8/24)
• Alaska Daylight Time: =B2-(8/24)        • Alaska Standard Time: =B2-(9/24)

To find what your time zone is in UTC and vice versa, here is a link to a UTC
converter: https://savvytime.com/converter/utc-to-pdt
Purple Air: Chart Data
Demonstration of Data Download and
     Time Stamp Correction

                  Let me at it !
                   More brain
                     food !!
Purple Air: Pros and Cons
Pros Cons
• Low-cost • Non-FEM
• Real-time measurements • Need reliable WiFi (if not use SD card)
(indoor/outdoor) • Lifespan is 2-3 years
• Good screening tool • Time stamp correction needed
• Community air quality awareness • QA/QC limitations (collocation
• Easy to install and deploy necessary to use data)
• PM channel correlates well with • Data verification & validation (data
integrity)
collocated FEM monitors
• Interferences (high RH, sensor siting)
• Cannot make NAAQS determinationResources Purple Air website (setup instructions) • https://www2.purpleair.com/ AQI Calculator (convert concentrations to AQI value) • https://aqicn.org/calculator/ Udemy online courses on MS Excel • https://www.udemy.com/topic/excel/ Ideas on how to chart Purple Air Data • https://publiclab.org/notes/jiteovien/08-28-2018/download-analyze- your-purple-air-data South Coast Air Management District – Purple Air Field Evaluation • http://www.aqmd.gov/aq-spec/product/purpleair-pa-ii
Thank you for joining todays webinar!
You can also read