2020-2021 NGHS AP Environmental Science Math and Experimental Design Summer Assignment
←
→
Page content transcription
If your browser does not render page correctly, please read the page content below

2020-2021 NGHS AP Environmental Science Math and Experimental Design Summer
                                     Assignment
This year in APES you will hear the two words most dreaded by high school students…APES MATH! That’s right, there is
math on the AP Environmental Science exam. The challenge with APES Math is in setting up the problems correctly and
knowing enough basic math to solve the problems. With practice, you will be a math expert by the time the exam rolls
around. This assignment will help familiarize you with the type of math and graphing analysis problems that will be
covered this year. You will also be expected to critically analyze experimental data so this assignment will also help you
brush up on your experimental design knowledge. This packet is due on August 12th and will be graded. Any
questions you have can be answered in class during the first week of school. We recommend getting a head start on
this assignment over the summer. If you choose not to complete it over the summer, then you will be expected to
complete it the first week of school. You will also be assessed over these math, graphing skills, and experimental
design knowledge on Wednesday, August 12th.
                PLEASE USE SEPARATE SHEETS OF PAPER TO COMPLETE THIS ASSIGNMENT.

PART ONE: APES MATH PRACTICE
   PERCENTAGE—Percentage is a measure of the part of the whole.

   Example 1: 15 million is what percent of the United States population of approximately 300 million?
   15 million/300 million= 0.05 x 100 = 5%

   Example 2: What is 20% of a $15 restaurant bill?
   20% = 20/100 = 0.20
   0.20 x $15 = $3.

   Practice: Remember to show your set-up, include units if given.
    1. What is 45% of 900?
    2. Thirteen percent of a 12,000 acre forest is being logged. How many acres will be logged?
    3. A water heater tank holds 280 gallons. Two percent of the water is lost as steam. How many gallons remain to
        be used?
    4. What percentage is 25 of 162.5?
    5. 35 is what percentage of 2800?
    6. 14,000 acres of a 40,000 acre forest burned in a forest fire. What percentage of the forest was damaged?
    7. You have driven the first 150 miles of a 2000 mile trip. What percentage of the trip have you traveled?
    8. Home prices have dropped 5% in the past three years. An average home in Indianapolis three years ago was
        $130,000. What’s the average home price now?
    9. The Greenland Ice Sheet contains 2,850,000 cubic kilometers of ice. It is melting at a rate of .006% per year.
        How many cubic kilometers are lost each year?
    10. 235 acres, or 15%, of a forest is being logged. How large is the forest?
    11. A teenager consumes 20% of her calories each day in the form of protein. If she is getting 700 calories a day
        from protein, how many calories is she consuming per day?
    12. In a small oak tree, the biomass of insects makes up 3000 kilograms. This is 4% of the total biomass of the tree.
        What is the total biomass of the tree?

    RATES—change in amount in a given time; rise/run; change/time; ΔY/ΔX

   Rates will often be expressed using the word, “per” followed by a unit of time, for example, grams
   per minute, liters per year. For AP Environmental science you will often have to calculate PERCENT
   CHANGE of a population or amount of a pollutant.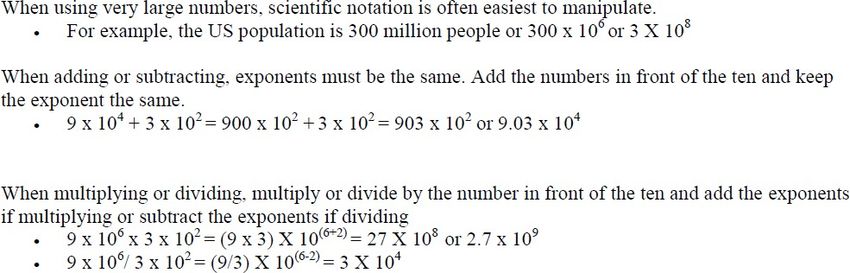
KNOW THIS EQUATION:                   [ (New Value- Old Value) / Old Value] * 100 = rate of change
    Practice:

    13. In 2010, the South Anna River had a large mouth bass population of 25,000 over a 10 mile stretch. However,
    in early 2011 a chemical spill occurred and the population of large mouth bass decreased to only 5000. Calculate
    the percent change in the population.
    14. Approximately 30 million mobile devices were sold in 1998 in the United States. The number sold increased
    to 180 million devices in 2007. Calculate the percent increase of mobile device sales from 1998 to 2007.

  SCIENTIFIC NOTATION
Thousand = 103 = 1,000
Million = 106 = 1,000,000 (relative to US population)
Billion = 109 = 1,000,000,000 (relative to people on Earth)
Trillion = 1012 = 1,000,000,000,000 (national debt)

Practice: Write the following numbers in scientific notation:

     15. 145,000,000,000
     16. 13 million
     17. 435 billion
     18. .000348
     19. 135 trillion
     20. 24 thousand

  DIMENSIONAL ANALYSIS—you are expected to be able to convert between units of measure
  accurately. Online tutorials assistance is available: http://joneslhs.weebly.com/

  PREFIXES
                            m (milli) = 1 / 1000 = 10-3
                            c (centi) = 1 / 100 = 10-2
                            k (kilo) = 1000 = 103
                            M (mega) = 1,000,000 = 106
                            G (giga) = 1,000,000,000 = 109
                            T (tera) = 1,000,000,000,000 = 1012
MATH PROBLEMS—Show all work, answer the questions.
1. What is one million times five thousand? Use scientific notation in your work and answer.
2. A deer population of 200 individuals grows by 17% in one year. How many deer will there
be the next year (year 2)?
3. Last year, I had 92 APES students and this year I will have 63 APES students. By what
percentage will the population of APES students increase?
4. Electricity costs $0.06 per kilowatt hour. In one month, one home uses one megawatt
hour of electricity. How much will the electric bill be?
5. Your car gets 15 miles per gallon and your friend’s car averages 25 mpg. You decide to head off to St.
George Island on vacation, 361 miles away. If gas costs $2.79/gallon and you decide to split the gas costs,
how much money will you save by driving your friend’s car?
6. A beach is 7.3 miles wide and 30 miles long. If one inch of rain falls on this beach,
how many cubic feet of rain fell in this area? Hint: convert units to feet first.PART TWO: APES EXPERIMENTAL DESIGN PRACTICE
Use Internet Resources to define the following Experimental Design terms
Inductive logic
Deductive logic
Controlled Experiment
Comparative Experiment
Variable
Independent variable
Dependent variable
Hypotheses
Hypothesis must be testable, reproducible and quantifiable. What does that mean?
PART THREE: SCIENTIFIC REASONING SKILLS AND GRAPHING
Read Below:
Step 1 is OBSERVATION: Professional scientists start an investigation in the same way you will in this course:
curiosity and observation. Scientists spend a great deal of time observing and exploring prior to deciding on a
question to investigate.
Step 2 is FORMULATION OF A QUESTION: Most scientific work attempts to answer a very small question that can be
pieced together with other work to eventually answer a bigger question. No question is too small; however, it must be
“testable.” In other words, you must be able to get the answer to the question by experimentation.
For example:
o What amount of Nitrogen is best for plant growth?
o Is it true that pill bugs (Isopods) prefer dark to light?
o What is the average pH of the lake over the course of a year?
Step 3 is FORMULATION OF A HYPOTHESIS: Once a testable question is proposed, a hypothesis (potential
explanation) is formulated. This should be a statement designed to propose a possible explanation for an
observation stated as an ‘if…then’ clause (If I do not do my summer work then I will get a zero). The formation of the
hypothesis should produce a testable prediction.
Step 4 is DESIGN AN EXPERIMENT: Once a question is posed and a hypothesis formulated, an experiment can be
performed to test the hypothesis. To design an experiment that will test the hypothesis, you should understand the
type of data needed in order to provide an answer, and set up your experiment to collect that data.
Remember that in a controlled experiment you may only investigate one variable at a time (the dependent
variable).
Step 5 is PREDICTION: You should state what you expect to happen to the dependent variable if the hypothesis is
correct.
Step 6 is DATA RECORDING: You should design a way to record the data prior to beginning the experiment. Thedesign of the data recording sheet will give you the opportunity to review one more time whether or not your
experiment is reasonable.
Step 7 is DATA ANALYSIS: The data that is collected should be placed in an appropriate context before it can
provide useful information. We will discuss statistical analysis of data later in the course.
Step 8 is REFLECTION OF RESULTS: Did the data support or contradict you hypothesis? If so, can you think of
further questions you would like to answer? If not, was it likely because the hypothesis was wrong or was it likely
that the experimental design was lacking?
Graphing and Data skills
Graphing is an important procedure used by scientists to display the data that is collected during a controlled
experiment. Line graphs must be constructed correctly to accurately portray the data collected. Many times the
wrong construction of a graph detracts from the acceptance of an individual’s hypothesis.
From earlier science classes, you no doubt already:
• Know how to convert raw data to frequency (percentage) results
• Can identify independent and dependent variables
• Use those variables to correctly set up tables and graphs
• Know when data is beset expressed as a line graph, bar graph, or pie chart
Most graphs contain 5 parts:
A. The TITLE: depicts what the graph is about. By reading the title, the reader should get an idea about the
graph. It should be a concise statement placed above the graph.
B. The INDEPENDENT VARIABLE: is the variable that can be controlled by the experimenter. It usually includes
time (dates, minutes, hours, etc.), depth (feet, meters), and temperature (Celsius). This variable is placed on
the X axis (horizontal axis).
C. The DEPENDENT VARIABLE: is the variable that is directly affected by the independent variable. It is the
result of what happens because of the independent variable. Example: How many oxygen bubbles are
produced by a plant located five meters below the surface of the water? The oxygen bubbles are dependent
on the depth of the water. This variable is placed on the Y-axis or vertical axis.
D. The SCALES for each Variable: In constructing a graph one needs to know where to plot the points
representing the data. In order to do this a scale must be employed to include all the data points. This must
also take up a conservative amount of space. It is not suggested to have a run on scale making the graph too
hard to manage. The scales should start with 0 and climb based on intervals such as: multiples of 2, 5, 10, 20,
25, 50, or 100. The scale of numbers will be dictated by your data values.
E. The LEGEND: is a short descriptive narrative concerning the graph's data. It should be short and concise and
placed under the graph.Now Practice Graphing and Data Analysis
Use the following data to create an appropriate graph and answer the questions. Create your graph on the
paper given.
Depth Bubbles per minute PLANT A Bubbles per minute PLANT B
(meters)
2 29 21
5 36 27
10 45 40
16 32 50
25 20 34
30 10 20
1. What is the dependent variable?
2. What is the independent variable?
3. What type of graph would be best for this data?
4. What title would you give this graph?
5. What information would you include in the legend of your graph?
6. What label will you use for the X-axis?
7. What label will you use for the Y-axis?
8. What conclusion can you make about the data and the graph?
9. What evidence do you have to support your conclusion (use data to justify)?Putting Together Scientific Reasoning and Graphing Skills Complete the following on a separate sheet of paper: 1. Purchase a bag of plain M&Ms (1.69 oz is fine) 2. Make a quick list of things you might be interested in knowing about the product. (number of candies in the bag, what colors of candies are in the bag, what is the weight of each candy, what is the weight of the bag, etc.). 3. Choose one of these things you might like to know about, and formulate a question. 4. Generate a hypothesis given your question. 5. Design an experiment to test your hypothesis. 6. Make a prediction prior to experimentation. 7. Generate a data recording sheet (data table) that will be acceptable for your type of experiment prior to experimentation. 8. Perform the experiment. 9. Complete a data table. 10. Analyze the data including creating and referencing a graph. 11. Reflection of Results.
You can also read