Aerosol and Cloud Detection Using Machine Learning Algorithms and Space-Based Lidar Data - NASA
←
→
Page content transcription
If your browser does not render page correctly, please read the page content below

Aerosol and Cloud Detection Using Machine Learning
                      Algorithms and Space-Based Lidar Data
                         John Yorks, Matt McGill, Ed Nowottnick: NASA/GSFC
                              Patrick Selmer & Andrew Kupchock: SSAI

   For the first time, machine learning (ML) techniques were applied to space-based lidar data by
 denoising Cloud-Aerosol Transport System (CATS) data and using CATS data to train a Convolutional
  Neural Network (CNN). These ML techniques (1) increased the CATS Signal-to-Noise Ratio by 75%,
(2) increased the number of atmospheric features detected by 30%, and (3) improved the horizontal
 resolution of daytime feature detection by a factor of 12. These ML tools can be infused into future
             lidar instruments to improve data product latency, resolution, and accuracy.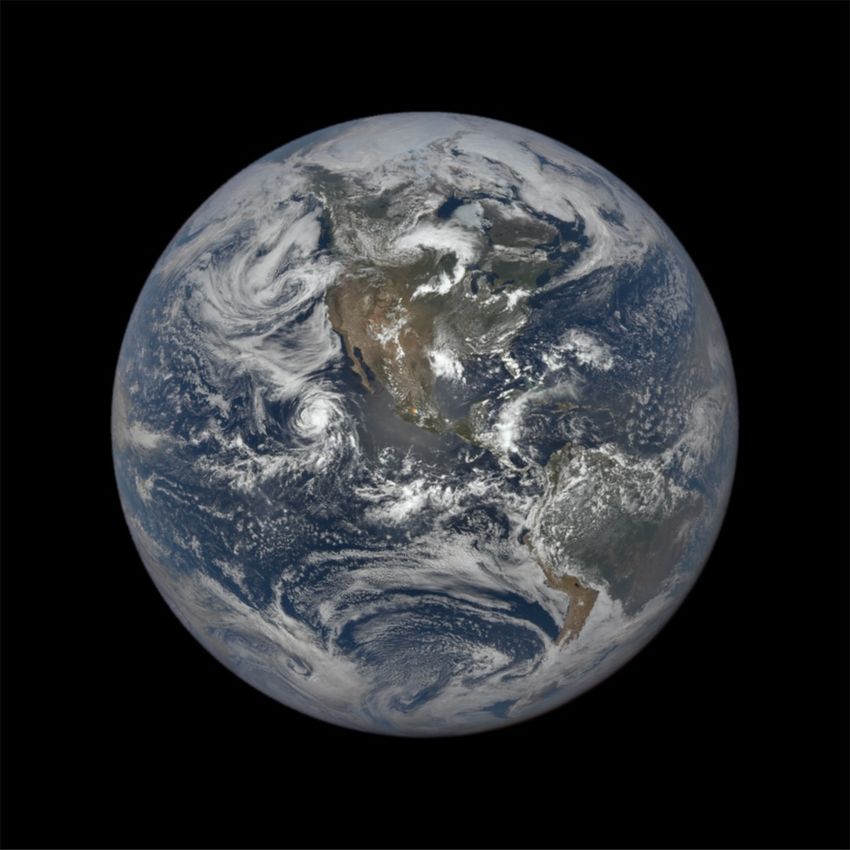
Name:       John Yorks, NASA/GSFC, Code 612
              E-mail: John.E.Yorks@nasa.gov
              Phone: 301-614-6284

  References:
  Yorks, J.E., P.A. Selmer, A. Kupchock, E.P. Nowottnick, K. Christian, D. Rusinek, N. Dacic, and M.J. McGill (2021), Aerosol and Cloud Detection
  Using Machine Learning Algorithms and Space-Based Lidar, Atmosphere 2020, accepted.

  Data Sources: All CATS data products used in this paper and documents such as the data products catalog, release notes, and algorithm
  theoretical basis documents (ATBDs) are available at the CATS website (https://cats.gsfc.nasa.gov) and/or the NASA
  Atmospheric Science Data Center (https://asdc.larc.nasa.gov/).

  Technical Description of Figures:
  CATS 1064 nm attenuated total backscatter (left) from 24 August 2015 in which CATS flew over the west coast of Africa. The backscatter,
  along with other properties, provide the basis for identifying the feature type in the standard CATS data products.

  Machine learning techniques (middle) were applied to the CATS data to predict feature type, a first for space-based lidar data. A wavelet
  denoising technique was applied to the raw CATS data to improve Signal-to-Noise Ratio without distorting the data. A Convolutional Neural
  Network (CNN) was trained using CATS standard feature type data products to improve layer detection resolutions and cloud-aerosol
  discrimination compared to the operational CATS algorithms.

  The CCN predicted cloud and aerosol layer detections and types (right) at finer horizontal resolutions (5km) than the standard CATS data
  products (60 km) and improved cloud-aerosol discrimination compared to the operational CATS algorithms for cloud edges and complex
  near-surface scenes during daytime. This plot shows the CATS 1064 nm attenuated total backscatter averaged horizontally to 5 km (A), the
  cloud-aerosol classification designated by the traditional algorithms (B), the predicted classifications from the CNN (C), and a comparison
  image between the two (D) for a case on 26 March 2015.

  Scientific significance, societal relevance, and relationships to future missions:
  Utilizing a combination of traditional techniques and these ML methods can improve the accuracy, resolution, and utility of existing and
  future space-based lidar datasets, especially during daytime. Such improvements enable researchers to more confidently combine passive
  daytime measurements with lidar observations for accurate data analysis. ML algorithms can also be incorporated into future space-based
  lidar missions and performed on raw data to enable near-real time (NRT) atmospheric feature height and type data products that have short
  latencies (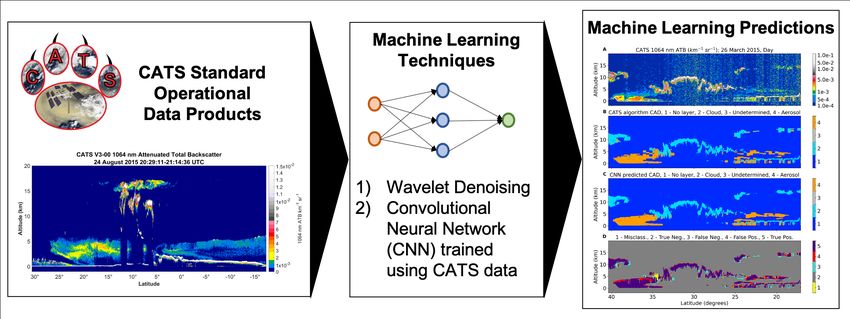
The sun glints of ice clouds, oceans, and lakes as seen by DSCOVR
                Tamás Várnai1,2 and Alexander Marshak1,   1Code                                      613, NASA/GSFC; 2UMBC JCET

                                                           Reflectance enhancement caused by glint
                                                                                                                     Distance [pixel]

DSCOVR EPIC images often feature sun glints caused by the specular reflection of sunlight by the
surface water of calm oceans and lakes and from horizontally oriented ice crystals in high clouds.
Spatial, spectral, and seasonal variations in glints help characterize the observed scenes and evaluate
the accuracy of EPIC image geolocation.
Name: Tamás Várnai, NASA/GSFC Code 613, UMBC JCET
               E-mail: tamas.varnai@nasa.gov
               Phone: 301-614-6408

References:
Várnai, T., A. Kostinski, and A. Marshak (2020). Deep space observations of sun glints from marine ice clouds. IEEE Remote Sensing
Letters, 17, https://doi.org/10.1109/LGRS.2019.2930866.
Várnai, T., A. Marshak, and A. Kostinski (2020). Deep space observations of sun glints: spectral and seasonal dependence, IEEE Remote
Sensing Letters, https://doi.org/10.1109/LGRS.2020.3040144.
Kostinski, A., A. Marshak, and T. Várnai (2021). Deep space observations of terrestrial glitter, Earth and Space Science, 8, e2020EA001521
https://doi.org/10.1029/2020EA001521.

Data Sources: EPIC Level 1 reflectance product available at https://asdc.larc.nasa.gov/data/DSCOVR/EPIC/L1B/, EPIC Level 2 glint
product available at https://eosweb.larc.nasa.gov. For a description of the new operational EPIC glint product see
https://epic.gsfc.nasa.gov/science/products/glint.

Technical Description of Figures:
Graphic 1: An example of sun glint caused by specular reflection from ice crystals in clouds. The Earth Polychromatic Imaging Camera
(EPIC) onboard the Deep Space Climate Observatory (DSCOVR) spacecraft observed this glint over Mexico on July 4, 2018, at 19:00
coordinated universal time (UTC). The glint is centered about 200 km to the northwest of Mexico City. The insets show the glint-affected
area in detail (left inset), as well as the EPIC glint mask (right inset) included in the recently released operational EPIC glint product
available at https://eosweb.larc.nasa.gov. Different colors in the glint mask indicate which of EPIC’s wavelength(s) is affected by glint from
ice clouds, with grey areas meaning “no glint”.
Graphic 2: Mean wavelength dependence and spatial extend of reflectance enhancements caused by sun glints. The graph shows mean
reflectance enhancements over land considering all EPIC images taken during 2017. Sun glints from clouds extend about 10-15 pixels (of
~10 km size) from the point where EPIC’s view direction perfectly aligns with specular reflection from horizontal surfaces. Rayleigh
scattering above clouds reduces the reflectance enhancements caused by glint at the shorter wavelengths, and so does absorption by
oxygen (at 688 nm and 764 nm) and by ozone (at 317 nm and 325 nm).

Scientific significance, societal relevance, and relationships to future missions: Characterizing glint behavior helps us better
understand variations in the properties and radiative impacts of ice clouds over both land and ocean. The results demonstrate that satellite
observations of sun glint enable more accurate determination of pixel location in satellite images, which can be especially important in areas
lying far from coastlines typically used for verifying and refining pixel locations. Glints also provide insight about ice crystal structure.

Earth Sciences Division - Atmospheres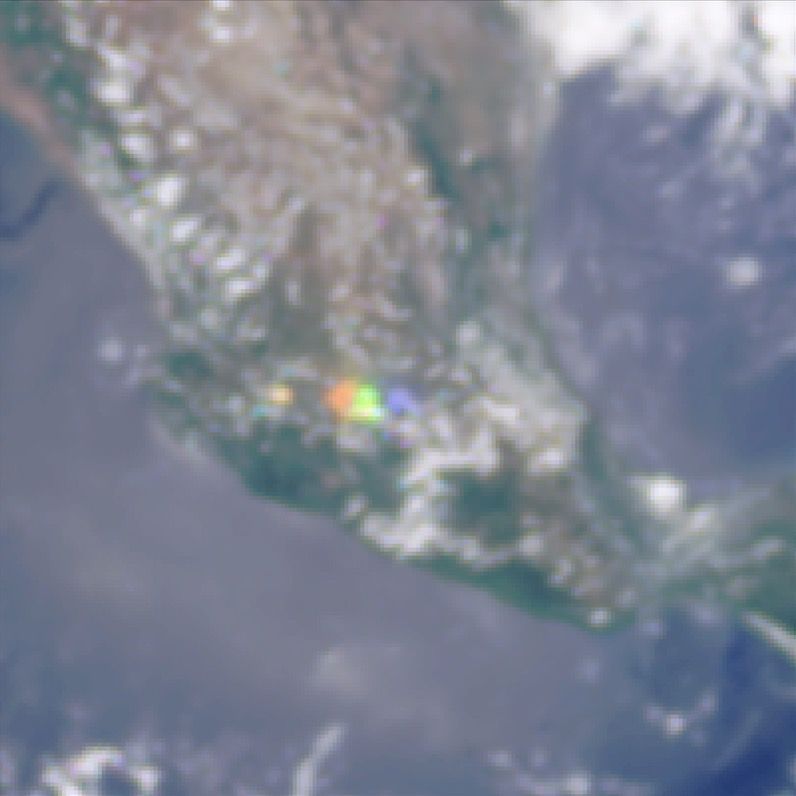
Observations of Lightning NOx Production from
                   GOES-R Post Launch Test Field Campaign Flights
       Dale Allen, Kenneth Pickering, Lok Lamsal, Douglas Mach, Mason Quick, Jeff
       Lapierre, Scott Janz, William Koshak, Matthew Kowalewski, & Richard Blakeslee
§ Lightning-produced NOx plays an important role in
  determining mid- and upper-tropospheric mixing ratios of
  OH, the atmosphere's cleanser; CH4, an especially potent
  greenhouse gas; and O3, a greenhouse gas and pollutant.
§ NO2 columns from NASA Goddard Geo-CAPE Airborne
  Simulator (GCAS) & flash counts from Earth Networks
  Total Lightning Network (ENTLN) & Geostationary
  Lightning Mapper (GLM) used to examine temporal
  variations in NOx production per flash.
§ For GOES-R PLT campaign, Lightning-NOx production
  efficiency (PE), assuming a 2-hour lifetime for NOx in near
  field of convection equaled 360 ± 180 (230 ± 115) mol NOx
  flash-1 for flashes detected by GLM (ENTLN). PE found to
  be positively correlated with optical flash energy.

This study during the GOES-R PLT field campaign provides a
preview of the analysis that will be possible when
continuous lightning detection from GLM instruments on
GOES-16 and 17 is coupled with high spatial and temporal
NO2 columns from a geostationary instrument such as
Tropospheric Emissions: Monitoring of Pollution (TEMPO) .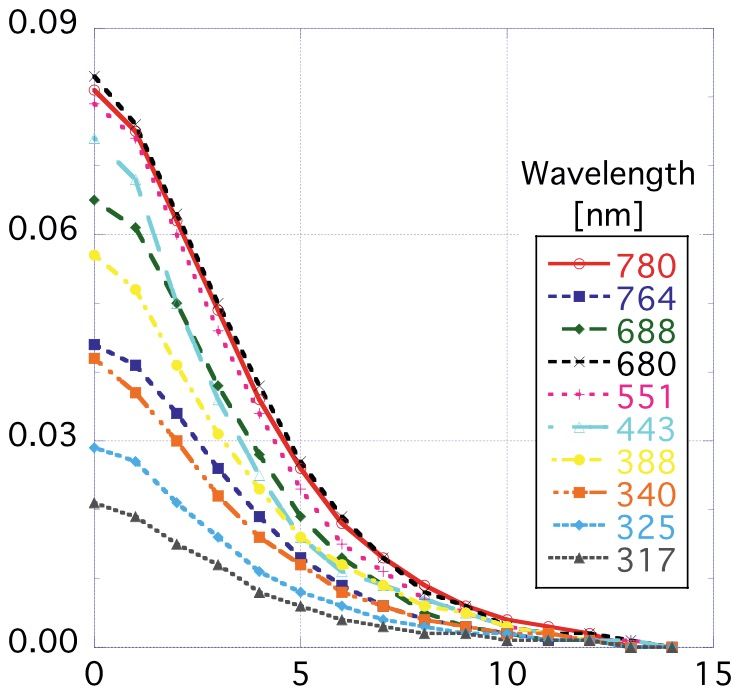
Name: Dale Allen, UMCP           Kenneth Pickering, UMCP        Lok Lamsal, USRA & NASA/GSFC Code 614
              E-mail: djallen@umd.edu          pickerin@umd.edu               lok.Lamsal@nasa.gov
              Phone: 301-405-7629              301-405-7639                   301-614-5160

Reference: Allen, D. J., Pickering, K. E., Lamsal, L., Mach, D., Quick, M. G., Lapierre, J., Janz, S., Koshak, W., Kowalewski, M., & Blakeslee, R.
(2021). Observations of Lightning NOx production from GOES-R Post Launch Test Field Campaign Flights, Journal of Geophysical Research:
Atmospheres, https://doi.org/10.1029/2020JD033769
Data Availability: GCAS NO2 slant and vertical columns for the GOES-R PLT field campaign are accessible on the Aura Validation Data Center
website at https://avdc.gsfc.nasa.gov/pub/data/aircraft/GCAS_GOESR/. GLM flashes during the time period of the GOES-R PLT field
campaign are accessible at http://dx.doi.org/10.5067/GOESRPLT/GLM/DATA101. ENTLN data were obtained freely by request from Earth
Networks (https://www.earthnetworks.com).

Technical Description of Figures:

Figure 1: Lightning flash density from GLM (gray scale) and vertical column density of NO2 (VNO2) derived from 250 m × 250 m GCAS
spectra (colored line segment) along NASA ER2 flight track over Louisiana and Mississippi for 10-minute period (1650-1700 UTC) on May 12,
2017 during GOES-R PLT field campaign. For this time period, the PE was 611 mol per flash and VNO2 was 2.30 petamolec cm-2.

Figure 2: Scatterplot showing relationship between LNOx PE and GLM optical flash energy (femto J) for 10 convective systems observed on
5 flight days during the GOES-R PLT field campaign. Colors are used to separate flight days while symbols are used to separate systems
within each flight day. Correlation coefficient found to be 0.83.

Scientific significance, societal relevance, and relationships to future missions: Reactive nitrogen (NOx) produced by lightning plays an
important role in determining mid- and upper-tropospheric concentrations of the hydroxyl radical (OH), the atmosphere's cleanser;
methane (CH4), an especially potent greenhouse gas; and ozone (O3), a greenhouse gas and pollutant. In this study, NOx production per
lightning flash was examined over the U. S. using GCAS NO2 columns and ground-based (ENTLN) and satellite-based (GLM) observations of
flashes. This analysis of observations during the GOES-R PLT field campaign provides a preview of the analysis that will be possible when
continuous lightning detection from GLM instruments on GOES-16 and 17 is coupled with high spatial and temporal NO2 columns from a
geostationary instrument such as Tropospheric Emissions: Monitoring of Pollution (TEMPO).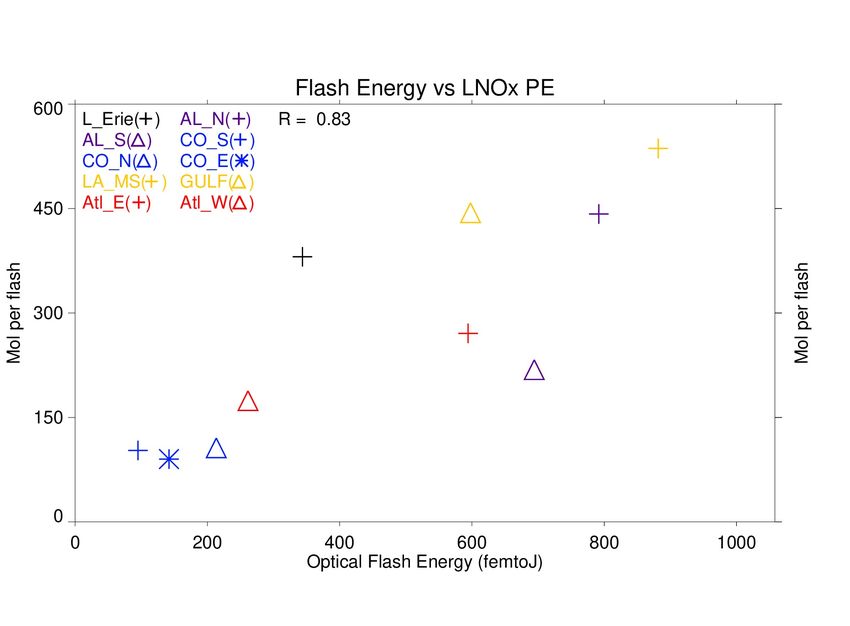

You can also read