Measuring climate regulation services using ARIES for SEEA Explorer - Alessandra Alfieri and Bram Edens - United Nations Statistics Division
←
→
Page content transcription
If your browser does not render page correctly, please read the page content below
Measuring climate regulation services using
ARIES for SEEA Explorer
Alessandra Alfieri and Bram Edens

United Nations Statistics Division

Outline
• Role of SEEA in informing climate policy
• Climate regulation service
• Aries for SEEA
• Brief demonstration
• Interoperability
Context: SEEA and Climate Change
Climate-related uses of the SEEA, include:
• Informing mitigation strategies by assessing the role of economic activities and
  household consumption in generating emissions by economic sector, the value of
  investments in mitigating technologies, as well as the distribution of carbon credits.
• Informing adaptation strategies by tracking expenditures and investments on
  adaptation by economic sectors or household and analyzing impacts in terms of
  changes in condition of ecosystems, disasters, and reduced production, for example of
  crops.
• Providing a comprehensive overview of how much carbon is stored per ecosystem
  type and how this develops over time due to sequestration, deforestation and
  afforestation, as well as harvesting, forest fires etc.
• Assessing how climate change impacts economic activities and households, through
  the effects it has on ecosystems and the services they provide. The accounts can also be
  used to assess issues such as land degradation, water shortages and biodiversity.
Global climate regulation service
• Global climate regulation service in SEEA EA considers two components:
    > carbon retention: the ability of ecosystems to retain the stock of carbon – i.e.,
      ecosystems supply a service through the avoided emission of carbon to the
      atmosphere
    > carbon sequestration: the ability of ecosystems to remove carbon from the
      atmosphere
        ⁻ expected to be stored for long periods of time.
        ⁻ an appropriate metric is the net ecosystem carbon balance.
• In stable ecosystems, carbon retention will be the primary component while in those
  ecosystems where there is clear expansion in the stock of carbon, then carbon
  sequestration may be the focus of measurement.
• Requires compilation of a basic carbon stock account.
Artificial Intelligence for Environment & Sustainability
(ARIES)
• What is ARIES?
    • ARIES is a modelling technology, rather than a model(s), or specific program/application
    • Uses k.Lab software (knowledge)
    • It is an artificial intelligent modeler, based on machine reasoning

                      Reasoning        Decision                                  Open data       Open-source
                      algorithms   +    rules       +    Multidisciplinary
                                                           semantics         +   & models
                                                                                             +    software

                                                     ARIES: Fast, FAIR
                                          =       multidisciplinary modeling

• It defines a variety of data, models and the relationships between them using consistent and
  uniform terms (semantics / ontology).
• ARIES technology uses artificial intelligence to determine the “most appropriate” data and
  model for your request (setting a context)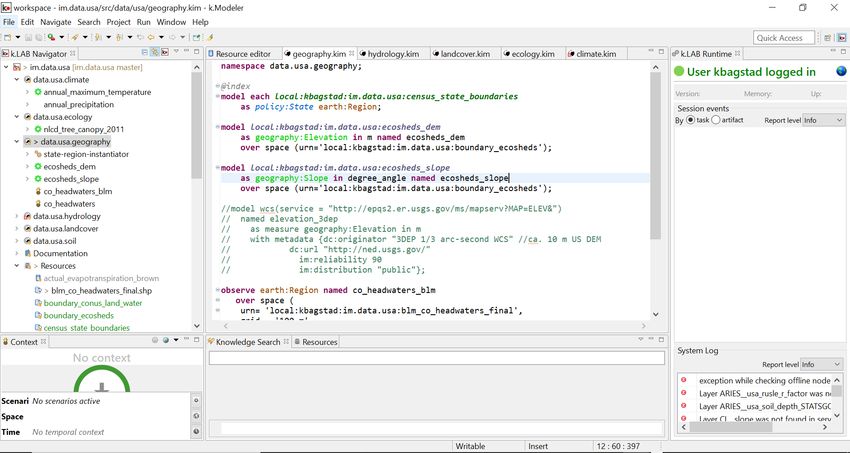
ARIES for SEEA:
Rapid, standardized environmental-economic accounting
• Global, customizable models
  approach enables SEEA EA
  compilation anywhere &
  improvement with local data
  where available
   o Fast & easy to learn
• Automate production of maps
  & tabular output
• Infrastructure for the
  community to share & reuse
  interoperable data & models

 https://seea.un.org/content/aries-for-seea
Interfaces for nontechnical & technical users

   Access & run scientific models in     Contribute & semantically annotate new data &
minutes through a web browser, using   model resources for reuse by scientific community &
cloud-based data, anywhere on Earth                           public
Current ARIES for SEEA content: Ecosystem extent
                                      Methods                                                                                                Data

       Currently maps 29 ecosystem types                                                               Lookup table to model IUCN EFGs, based
    (primarily terrestrial & wetland) based on                                                          on: temperature, landform, elevation,
             IUCN GET 2.0 methods . 1                                                                     aridity, land cover , ca. 1992-2019
                                                                                                                             2

                                       Outputs                                                                                         Next Steps
                                                                                                    Expand to more ecosystem types (especially
 Net change, additions & reductions, change                                                                 freshwater/marine), though
                                                                                                        conceptual/data challenges remain;
  matrix for ecosystems & land cover types                                                            collaborate more closely with IUCN GET
                                                                                                                       team

1: Keith, D. et al. 2020. IUCN Global Ecosystem Typology 2.0. IUCN: Gland, Switzerland. - 2: Using thresholds from Sayre, R., et al. 2020. An assessment of the representation of ecosystems in
                             global protected areas using new maps of World Climate Regions and World Ecosystems. Global Ecology and Conservation 21:e00860.
                                                                                                                                       Making Science Matter in Policy-Making Where Nature Counts.
Current ARIES for SEEA content: Ecosystem condition
Methods Data
Identifies forest ecosystem condition with Drought index, LAI, NDVI, NPP, forest
6 indicators adapting Santos’ aggregation fragmentation, burned area. Adapted from
methods : Consulted virtually with J. Maes,
1 original temporal resolution to yearly values
F. Santos and colleagues (e.g., mean, maximum), ca. 2000-2019
Outputs Next Steps
Expand to additional ecosystem
Ecosystem variable, indicator, index types/condition metrics (e.g., collaboration
with South Africa on grassland condition)
accounts for user-selected indicators Customizable weighting to reflect local ETs’
characteristic
1: Santos Martin, F. & Garcia Bruzon, A. In prep. Spanish forests experimental condition account. Universidad Rey Juan Carlos: Madrid.Current ARIES for SEEA content: Ecosystem services
supply & use tables
Ecosystem Services and Accounts:
Physical Monetary
1. Crop provisioning (ecosystem contribution)
2. Crop pollination (insect pollinators contribution)
3. Global climate regulation services (carbon storage)
4. Soil erosion control services (physical only) -
5. Nature-based tourism (non-domestic) Current ARIES for SEEA content: Global climate regulation
Methods Data
Land cover, ecofloristic region (FAO
Tier 1 IPCC approach: Aboveground & classification), continent, presence of
belowground vegetation carbon storage frontier forests (proxy for forest
quantified using a multilayer lookup table .
1 degradation), recent occurrence of fires,
soil carbon storage.
Outputs Next Steps
Estimated carbon stored in aboveground &
Incorporate newer & more regional carbon
belowground vegetation, plus the upper 2
storage estimates, as well as models more
m of soil. Results priced using Social Cost of
sophisticated than lookup tables.
Carbon (SCC).
1: Ruesch, A., & H.K. Gibbs. 2008. New IPCC Tier-1 Global Biomass Carbon Map for the Year 2000. Available online from the Carbon Dioxide Information Analysis Center [http://cdiac.ornl.gov],
Oak Ridge National Laboratory, Oak Ridge, TennesseeARIES for SEEA: Audiences 1. Countries with very limited data & experience (create accounts using common global data) 2. Countries with national data wanting to customize accounts (create accounts using national data & models) 3. Countries with sophisticated modeling capacity (contribute their data & models to global SEEA EA community) Current focus has been on group 1; increasing focus on groups 2 & 3 in near future.
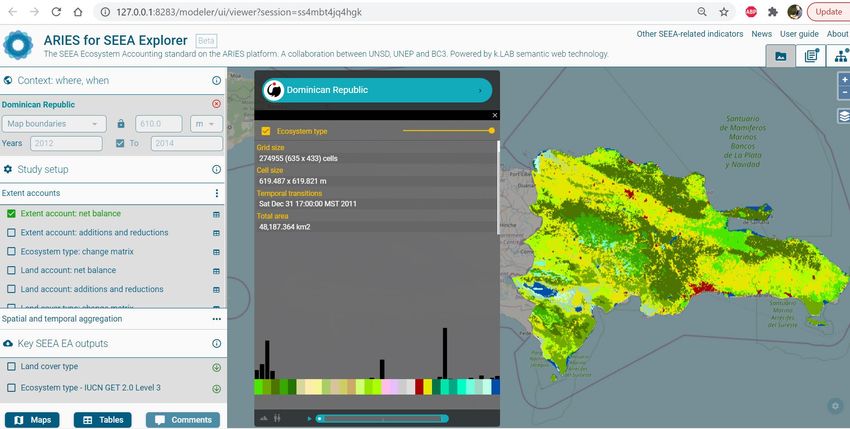
Results: demonstration
• Kyrgystan: carbon storage
> Disaggregation by IUCN EFGs
> Time series: 2012-2014
• Allows to compute both components of global climate regulation service:
> Sequestration (net balance)
> Retention (for opening and closing stocks)
t wo
u
ie
r
th sh
nowf
fores
d
ee
sslan
e h ea
ent s
w scr
tem
ane
land
op
and
ra
rman
sert
perat
lo
outcr
mont
cosys
mid g
rt
shrub
eathl
lavaf
land
idese
m ide
t
e
ry tem
deser
cier p
trial e
rocky
u
erate
rate h
t
wood
fores
ment
d
subh
t sem
ert se
sslan
a
et gla
ally d
t em p
indus
e
e
tundr
pave
tC)
erate
erate
erate
alpin
deser
temp
e gra
r d es
and
on
n
e
l
n
y
Borea
Seaso
Ice sh
Temp
Temp
Temp
Cropl
Alpin
Polar
Polar
Total
Othe
(milli
Urba
Rock
Cool
Cool
Quantity at start of 2012 (tons C storage) 1747 11 55 453 2299 39 1 54 301 1190 3 122 264 32 66 6636
Quantity at start of 2014 (tons C storage) 1738 11 56 457 2311 39 1 54 299 1183 3 122 263 31 66 6635
Net change -9 1 0 4 12 0 0 0 -2 -6 0 0 -1 0 0 -1The importance of interoperability
• Interoperable data:
> Interoperable is broader than mere open (downloadable) data.
> The idea is to share the data through APIs using SDMX etc.
> Global data can be complemented by reviewed national data sets, all interconnected
through common classifications and definitions (semantics/ontology)
• Data storage:
> Ecosystem accounting requires large data sets which are costly to store -> better have one
custodian that shares the data, that updates when new data are available.
• Interoperable models:
> In ES modelling many platform and models exist.
> Interoperable allows re-using each other model(s) components; coefficients etc. -> re-use of
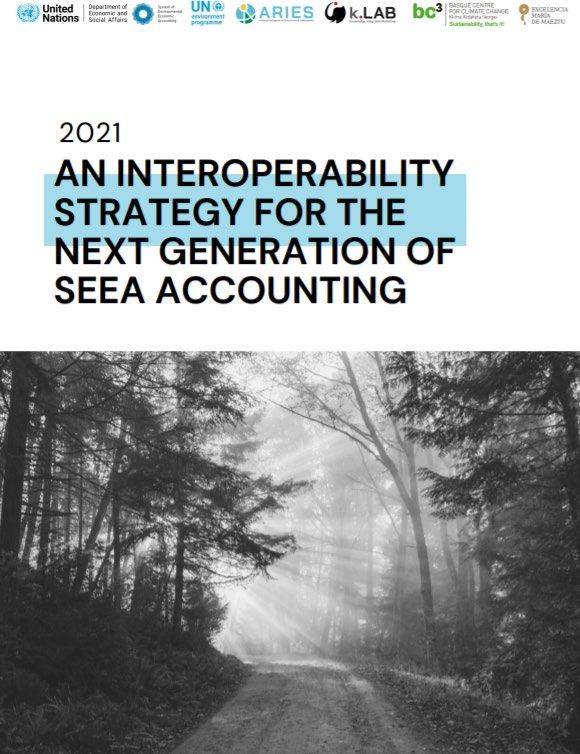
scientific knowledge.SEEA Interoperability strategy
1. Current state of interoperability & vision for the
future
2. Roles & responsibilities (data providers,
modelers, institutions incl. NSOs)
3. Implementing the strategy (pilot testing,
engaging key stakeholders, governance,
training/capacity building)
https://seea.un.org/sites/seea.un.org/files/interoperability_strategy_draft.pdfTHANK YOU seea@un.org // https://seea.un.org/
You can also read