Drones and the Bay Detecting Wave Velocity Fields using UAS Determining the Largest Wave Velocities in the Bay - The University of Rhode Island
←
→
Page content transcription
If your browser does not render page correctly, please read the page content below
Drones and the Bay
            Detecting Wave Velocity Fields using UAS
        Determining the Largest Wave Velocities in the Bay
                ELECOMP Capstone Design Project 2020-2021

Sponsoring Company:
RI NSF EPSCoR
Graduate School of Oceaonography
URI Bay Campus
215 South Ferry Road
Narragansett, RI 02882

Company Overview:
Funded by a $19 million National Science Foundation grant and a $3.8 million state match, RI
C‑AIM is a collaboration of engineers, scientists, designers and communicators from eight higher
education institutions developing new approaches to assess, predict and respond to the effects
of climate change on coastal ecosystems.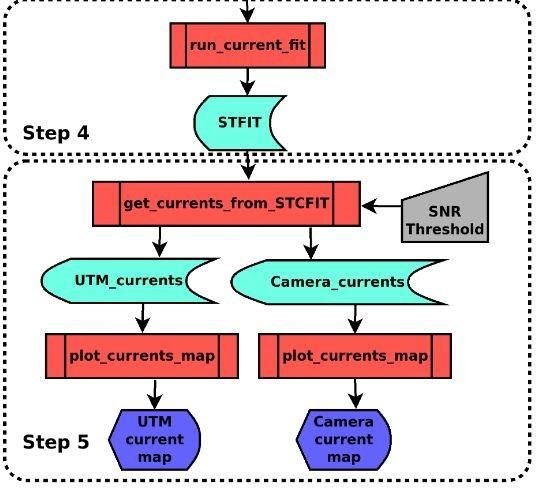
Technical Directors:
Baylor Fox-Kemper
Professor
baylor@brown.edu
http://fox-kemper.com

M Reza Hashemi
Associate Professor
reza_hashemi@uri.edu
https://web.uri.edu/engineering/meet/mrhashemi/

Steven Licht
Associate Professor
slicht@uri.edu
https://web.uri.edu/engineering/meet/slicht/

Project Motivation:
The Fox-Kemper Research group at Brown University is working to model the Narragansett Bay
to Block Island Sound, Martha’s Vineyard, Fishers Island and up into the estuaries of the
Providence River. The goal of their research is to create the OSOM (Ocean State Ocean Model), a
computer model which takes into account all parts of the bay to show the past and present of
how the bay is changing. Once the OSOM’s predictability is better, it will be used to show how
the bay is changing over time. The overarching goal is for the OSOM to be able to accurately
predict changes in climate of the bay over years and decades and weather changes up to 2 weeks
in the future. Scientists working for Baylor and other research groups have analyzed variables
including salinity, water density, water pressure, chlorophyll, bacteria growth, algae bloom
frequency, spectral reflectance and wave velocity fields in order to help model the Narragansett
Bay and the inner coastal shelf.
Drone modeling of the bay is another way that scientists can obtain data, and as of now it has
not been possible to get wave velocity data using a drone. Wave velocity data from the drone will
be used to calibrate the OSOM data that has already been collected. The Fox-Kemper Research
Group has used satellites, buoys, drifters and acoustic doppler current profilers (ADCPs) to obtain
wave field velocity data, but none of these methods has the accuracy of a drone. Satellite data is
taken every few weeks depending on a satellite's orbital path. Buoy data is taken at the surface
of the water or the top few feet. Drifter data can be taken at a particular depth, but they are
unable to be controlled, which makes them inexpensive, but ineffective. At this point in time
ADCPs are the most accurate way to measure ocean currents because an ACDP is maneuvered
using a ship and can measure deeper and more accurate than most other means of
measurement. Using drone modeling, scientists hope to be able to accurately measure ocean
currents for much cheaper than what was previously possible, with the control and accuracy of
GPS.
Using a drone will allow researchers the ability to program waypoints so they can measure
currents where they would like, the DJI Mavic line of drones which will be used for this project,
will allow scientists to define exactly what spatial orientation, height and GPS coordinates they
would like fly with an accuracy down to about .5 m. This will allow scientists the freedom to get
the most accurate data possible. The wave velocity field data acquired by the drone will be
compared to the OSOM data in order to verify accuracy of the model and calibrate the data of
the model.
Hydroelectric turbines are commonly used to create power at the mouth of lakes and estuaries,
Dr. Baylor Fox-Kemper has been looking to install hydroelectric turbines in Narragansett Bay, in
order to effectively pinpoint where the turbines will be placed, wave velocity field data must be
taken from multiple places in the bay. These velocity measurements will be used to determine
where in the bay the turbine will produce the most power. The long term goal of this project is
to aid Dr. Fox-Kemper in positioning hydroelectric turbines,
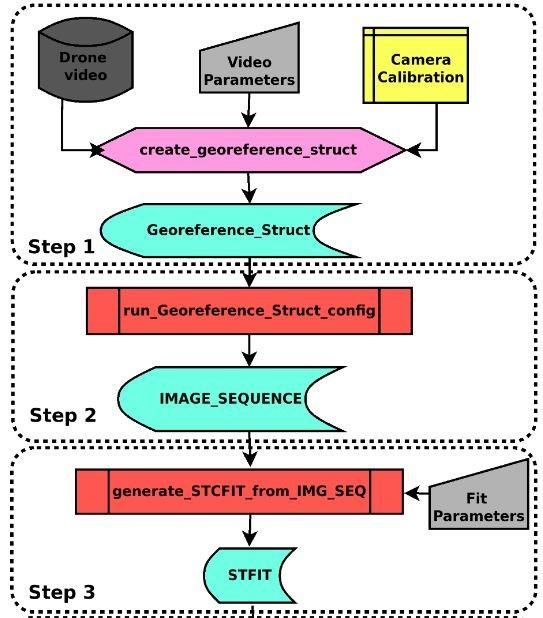
Anticipated Best Outcome:
The anticipated best outcome is to obtain a fully functional program using MATLAB which is able
to measure wave velocity fields and create a velocity gradient map for each video taken with the
drone. An array will also be created showing the average area velocity of multiple pixels on each
video. Instruction will also be created along with MATLAB files so the project can easily be
adapted by other users, the instructions will include weather conditions, ocean conditions and
correct drone flying to obtain the most accurate wave velocities. Should all of these outcomes be
accomplished, further steps will be taken to find the current fields throughout Narragansett Bay
with the largest magnitudes, this will help Baylor in his goals in finding where to place
hydroelectric turbines.

Project Details:
A clear picture of the concept is obtained by reading the following articles:
https://www.cmre.nato.int/msaw-2019-home/msaw2019-papers/1362-msaw2019-
horstmanncoptercurrentshighresolutionsurfacecurrentfieldsmeasuredbyasmalluav/file

The concept of the project is to continue the work mentioned in the article. The team will start
by adapting the MATLAB code from the GITHUB repository to work seamlessly with an example
video. As of now, numerous errors have been found when using the current code to analyze flight
footage.

The team will then choose which drone will give them the most accurate wave velocities and the
clearest image, giving preference to DJI due to original code intentions. The team should explore
different options and find a drone which is inexpensive, has many options for camera settings
and is able to sufficiently record wave velocities (keep in mind, the wavelength of each
gravitational ocean wave will be a minimum of .3m). The team will need to research which
camera will give them the most accurate data and which of the following is most important for
this application: shutter speed, ISO, aperture, camera resolution, camera frame rate.

The next step is to be able to analyze flight footage taken with the team’s drone. Ideally, the user
should be able to insert their own camera footage and camera parameters using a GUI or another

unobscure way to tell the user to input their parameters. The goal is for the user to be focused
on the data as much as possible rather than fiddling with code.

After the MATLAB code is up and running, the team will start their experimentation by taking
drone footage of several points in the bay at various temperatures, wind speeds and times during
each diurnal tide to see what conditions give the most accurate data and which variables are the
most important in determining wave velocity fields. The team will use waypoints to improve the
accuracy of their footage when evaluating the best flying conditions.

Furthermore, if each of these goals is to be reached, the data attained by the drone will aid
researchers at the Fox-Kemper research group in calibrating and verifying velocity data of the
OSOM model. Upon reaching these goals, the team will determine where throughout
Narragansett Bay the wave velocity fields are the greatest. Once the code is working, instructions
will be written with the intention that an unfamiliar user can easily install the program and
analyze a video within 1 day’s work. Everything will be documented for further use by other
scientists and researchers.
Electrical Tasks:
    ● All students must perform research so that they have a comprehensive understanding of
        MATLAB; understanding file directories, function definitions and executions are a must:
        Comprehensive MATLAB Tutorial

1 student will focus on knowledge of the drone, determining the best flying conditions for the
drone and determining which drone will be best for the project. (This student task is already
assigned). This student’s tasks include:

   ● Research and determine the correct drone for performing the necessary tasks, evaluating
     factors such as:
             Shutter speed
             Lens aperture
             Frame rate
   ● Work on programming the drone to fly using GPS so that multiple trials may be done in
     the same location

1 student will focus on their knowledge of MATLAB to analyze the flight footage and ensure
that the data is correct. This student’s tasks include:

   ● Make comparisons of the data to the OSOM data
   ● Research power spectrum analysis and fourier analysis in regards to ocean currents
   ● Understand signal processing using fourier transforms; students will research this topic

1 student will focus their knowledge on the geological conditions of the bay and determine
which parts of the bay have the best conditions to take velocity data, there tasks also include
the following:

   ● Research and determine the best geological conditions for obtaining flight footage
   ● Research which conditions lead to the most accurate current measurements
   ● Determine which part of the bay has the highest current fields
Composition of Team:
3 Electrical Engineers (ELE)
Preference will be given to students who have completed the MATLAB tutorial, students with a
biology background, an interest in biology or previous use of drones either in a job or as a
hobby. Students need to have a comprehensive understanding of Python or MATLAB as these
two programming languages are similar and the majority of the work performed during the
year will be using MATLAB.
Skills Required:
Electrical Engineering Skills Required:
• Proficiency in MATLAB and Python: Students should have experience using structure fields,
heavy knowledge of MATLAB file directories, experience using function and executing
functions. A heavy understanding of MATLAB is vital.
• Linear systems and signal processing: Parallel computing
• Image processing
• Reading and understanding research papers
Anticipated Best Outcome’s Impact on Company’s Business, and
Economic Impact
Should the outcome be determined a success, footage taken using a drone should be able to be
accurately analysed within .1 m/s to determine surface currents throughout Narragansett Bay.
Should the project succeed, the currents in Narragansett Bay will be used to evaluate the
accuracy of OSOM and any inaccuracies in OSOM data will be corrected by the drone. The drone
data will also be used to determine where underwater turbines are to be placed throughout the
Bay.
Broader Implications of the Best Outcome on the Company’s Industry:
Should the project succeed, a successful drone mapping of parts of the bay will lead the way
towards inexpensive research on Narragansett Bay. Currently most velocity mapping is
performed with satellites, drifters or radar using a boat, but the mapping of the bay using a drone
will allow researchers to get velocity data more accurately and quickly than in previous years.
Drone mapping is the cheapest way to gain valuable data and is also much quicker than any other
form of velocity measurement thus far.You can also read