BCCDC Weekly Data Summary - 6 May 2021
←
→
Page content transcription
If your browser does not render page correctly, please read the page content below
BCCDC Weekly Data
    Summary
     6 May 2021

                    1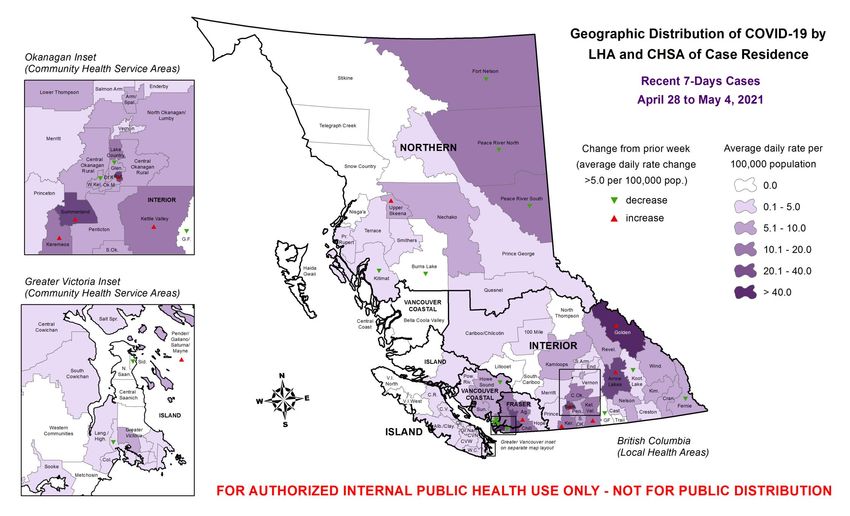
Disclaimer
Data and key messages within these documents are not finalized and considered to be work in
progress that is subject to change.
Data within these documents are updated on a rolling basis and may not be final. Data may be
subject to retroactive changes.
Correct interpretation of figures may be difficult with the limited inclusion of data notes and
methodology descriptions.

                                            CONFIDENTIAL DRAFT                                    2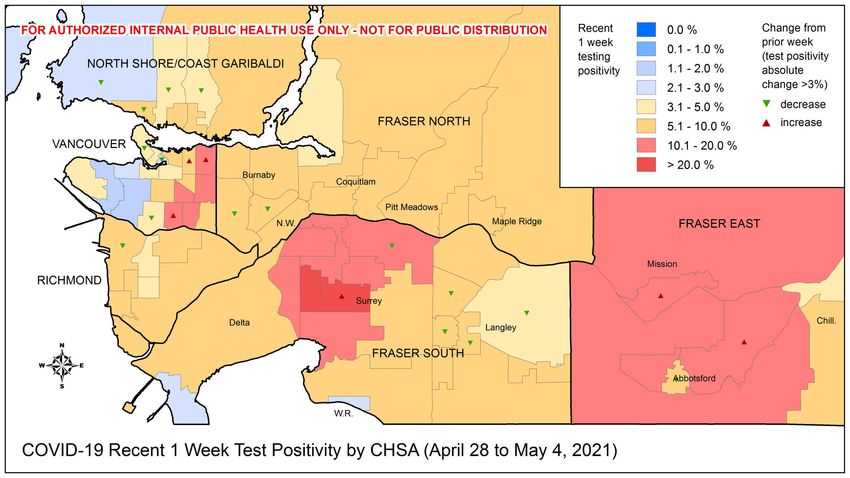
Table of Contents
 Overall Weekly Summary ……….………………………………………………………………………………………………………………4

 Surveillance …………………………………………………………………………………………………………………………………………..5

       BC Epidemiology………………………………………………………………………………………………………………….…..5

       Labs/Genomics…………………………………………………………………………………………….………………………..21

       BC in Canadian and Global Context……………………..………………………….……………………………………...34

 Modeling……………………………………………………………………………………………………………………………………..………..42

                                                                             3
Overall Weekly Summary
• Case rates continue to decline in all HAs; test positivity is at 9.2% provincially for publicly funded
  tests, a slight decline from last week.
• New hospitalizations continue to be elevated, but beginning to stabilize; hospital/critical care
  census are increasing in FH, VCH, IH; new deaths are stable and low.
    • Majority of hospitalizations among individuals aged >40 years
    • Majority of deaths in individuals aged >80 years

• The share of VOCs among screened cases in BC is ~80% in epi week 17. VOCs have been
  detected in all regions of the province. Among sequenced samples provincially based on
  information for epi week 16, P.1 (~43%) and B.1.1.7 (~57%) remain two dominant VOCs.
• Alberta’s case rate continues to be the highest of all jurisdictions in Canada and the US (~3.3x
  the BC rate). Potential for importation into BC is high.
• As of May 6, 43% of adult population in BC has received first dose of vaccine, 84% of those over
  70 years.
    • Vaccine coverage varies regionally
    • The number of outbreaks in LTCFs remains very low following vaccination campaign

                                                                                                           4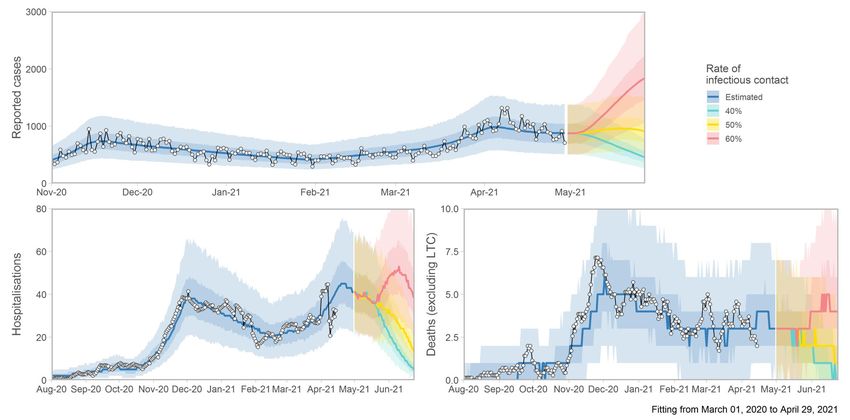
April 30 to May 6: BC COVID-19 Profile
  132,925 total cases                                   1,594      total deaths
    3,443 new this week                                      13    new this week

    6,887 ever hospitalized                          124,252       removed from isolation
     218 new this week                                  4,467      new this week

                        CONFIDENTIAL DRAFT   Data are by surveillance date for cases and deaths,   4
                                             and admission date for hospitalizations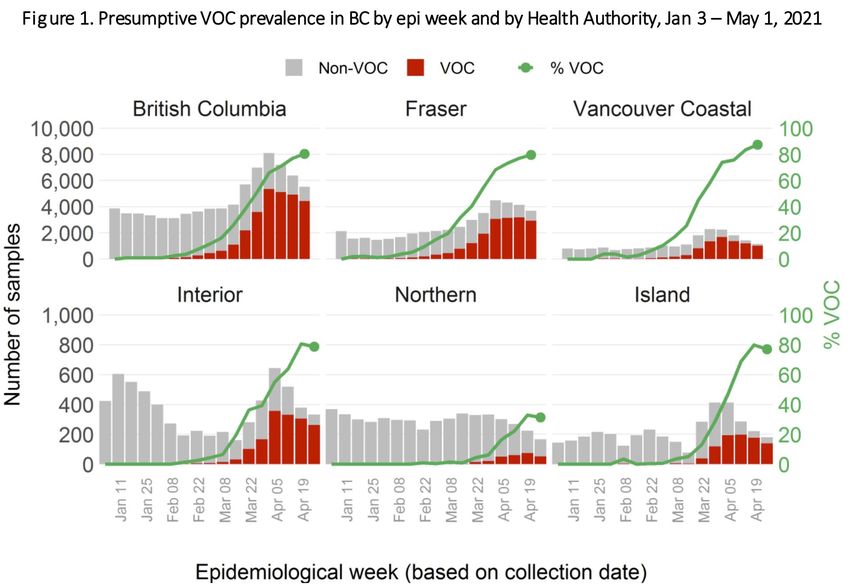
Case rates are continuing to decline in each HA; new hospitalizations are stabilizing; new deaths
are stable and low.

             Data are by surveillance date for cases and deaths,
                                                              CONFIDENTIAL DRAFT   Data to May 6   6
             and admission date for hospitalizations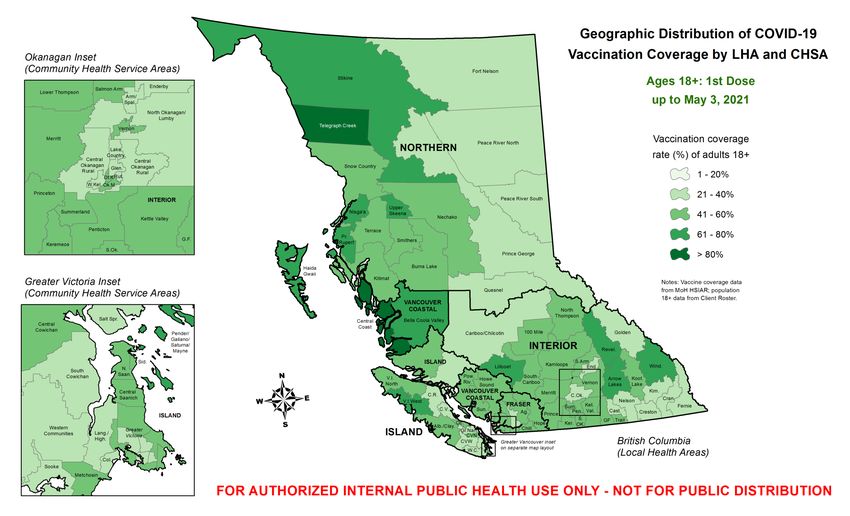
Number of new hospitalizations stabilizing; the majority of hospitalizations are
primarily among individuals 40-79 years. Deaths decreasing and mostly
among individuals ≥ 80 years.
                                                                      Data incomplete

                                  CONFIDENTIAL DRAFT                               7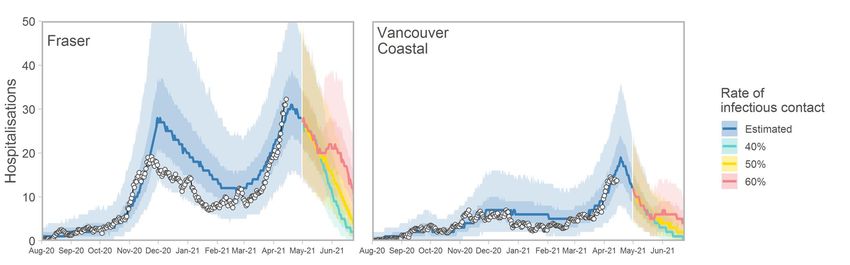
Hospital and critical care census is showing early signs of stabilization

           Data source: DARE, PHSA   CONFIDENTIAL DRAFT     Data to May 6   8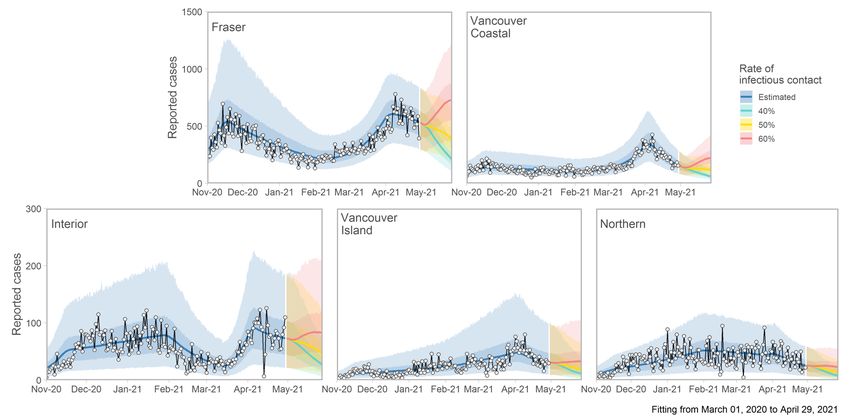
CONFIDENTIAL DRAFT 9
CONFIDENTIAL DRAFT 10
CONFIDENTIAL DRAFT 11
CONFIDENTIAL DRAFT 12
Rate has increased 3x
Rate has declined in Golden in last week
~10% in Surrey in last
10 days
Golden
Other LHAs
Aug Dec April
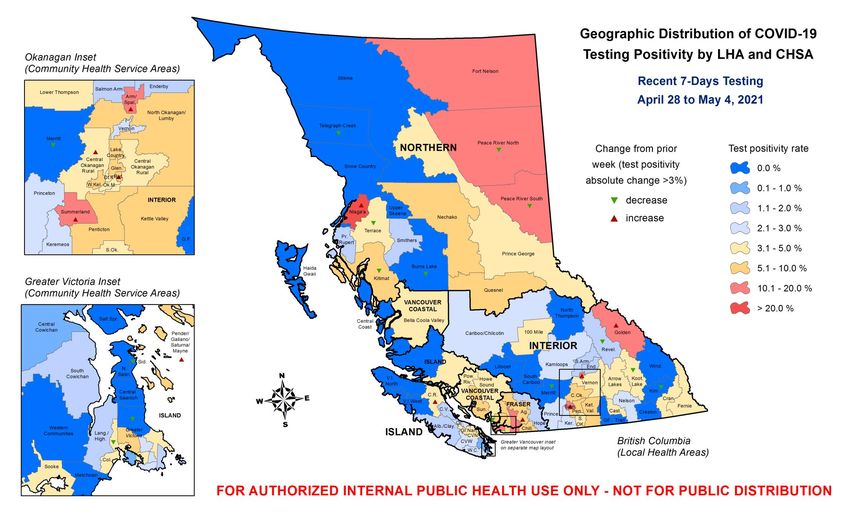
CONFIDENTIAL DRAFT 13Incidence is decreasing in all HAs. Percent positivity remains >10% in FH.
9.2%
11% 5%
3%
9%
9%
CONFIDENTIAL DRAFT 14The majority of cases continue to be related to local acquisition through a
known case or cluster
Likely source of COVID-19 infection by
episode date, BC January 15, 2020 (week3) to April 24, 2021 (week16)
CONFIDENTIAL DRAFT 15Vaccination progress in BC by age group as of May 6
Vaccinations
Hospitalizations
Deaths
Hospitalizations by admission date, deathsCONFIDENTIAL
by report date DRAFT 16
Data sources: hospitalizations and deaths – BCCDC, vaccinations – DARE, PHSACONFIDENTIAL DRAFT 17
CONFIDENTIAL DRAFT 18
The number of cases among individuals aged ≥70 years and HCWs working in long-term care or
assisted living facilities is very low following vaccination roll-out compared with individuals not
living or working in these settings.

                                            CONFIDENTIAL DRAFT                                    19
The number of new outbreaks declared remains low, but a handful of new outbreaks declared in
acute care and long-term care facilities week of April 18-24.
Note that the two graphs cover
different time periods
CONFIDENTIAL DRAFT 20Lab - Key Messages
1. Percent positivity among publicly funded tests is at 9.2%, slightly declined from last week.
• Testing rates are similar to last week (~69,000 total tests April 18 to 24)
2. There are regional differences in percent positivity, which range from 3% in VIHA to 11% in FH.
3. Percent positivity is elevated and declining in individuals aged 13 to 64 years. Incidence is
elevated but declining in individualsWeekly Summary of ALL lab tests performed
2,532,066 total specimens tested
1% relative to last week
68,910 new this epi week
138,104 total positive specimens 8.0% positivity
1.1% absolute change from
5,534 new positive this epi week last week
17 hr mean turnaround time (TAT)
14% TAT relative to last
16 [10-24] Median [Q1 – Q3] TAT week
Weekly Summary of Lab tests paid Publicly
2,087,521 total specimens tested
1% relative to last week
57,378 new this epi week
136,789 total positive specimens 9.6% positivity 22
1.4% absolute change from
5,500 new positive this epi week
last week
Data source: PLOVER extract at 10:30am on May 5, 2021.
CONFIDENTIAL DRAFT
Epi week 17 (April 25 – May 1)CONFIDENTIAL DRAFT 23
CONFIDENTIAL DRAFT 24
Percent positivity among publicly funded tests decreased compared to the
previous epi week and continues to be elevated at almost 10%. The total
number of tests resulted has remained stable relative to the previous epi week.
Data source: PLOVER extract at 10:30am on May 4, 2021.
CONFIDENTIAL DRAFT 25
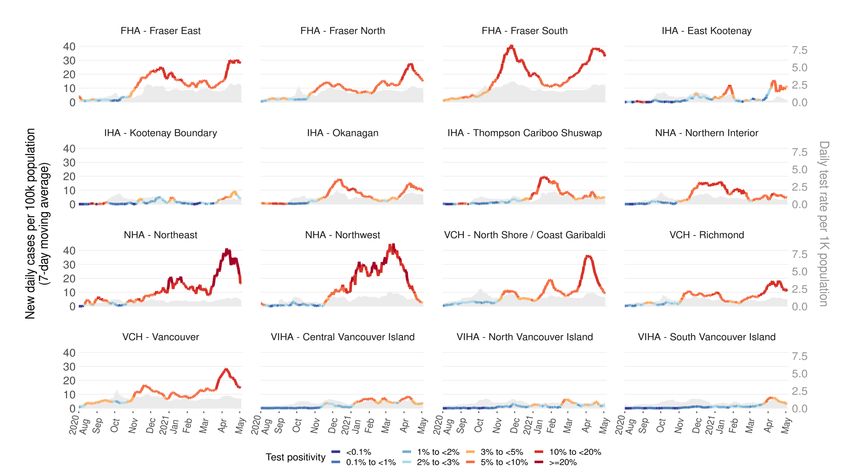
Epi week 17 (April 25 – May 1)Incidence remains elevated, but is stable or decreasing across regions;
positivity is >10% in health service delivery areas in FH, VCH and NH
CONFIDENTIAL DRAFT Data to May 6 26Percent positivity is elevated and declining in individuals aged 13 to 64 years. Incidence is elevated but declining in individuals
Of all COVID-19 positive test samples in epi week 16 (Apr 18-25) in BC, ~80% were
presumptive VOCs. Note that in Northern, the proportion was substantially lower, ~34%.

            Figure can also be found at: http://www.bccdc.ca/Health-Info-Site/Documents/VoC/VoC_weekly_05062021.pdf
                                                                CONFIDENTIAL DRAFT                                    28
The proportion of screened samples remains high- close to 90% in week 17.
Data source: PLOVER May 5, 2021
CONFIDENTIAL DRAFT 29• The proportion of variants sequenced can be interpreted at the population level, given that it includes only samples
sequenced from background surveillance and random screening.
• Weeks 13 onward include specimens from qPCR SNP screening that resulted as presumptive positive for B.1.1.7 and P.1.
• Given the high volume of screened specimens, those collected in week 16 continue to be analyzed.
30• The main circulating variants are B.1.1.7 and P.1, with their relative proportion accounting for 57 % and 43% respectively in epi week 16 (Apr 18 -
Apr 24).
• The proportion of variants sequenced can be interpreted at the population level, given that it includes only samples sequenced from background
surveillance and random screening.
• Weeks 13 onward include specimens from qPCR SNP screening that resulted as presumptive positive for B.1.1.7 and P.1.
Figure can also be found at: http://www.bccdc.ca/Health-Info-Site/Documents/VoC/VoC_weekly_05062021.pdf
Figure found at
CONFIDENTIAL DRAFT 3132
Overview of the                       Blue arrows highlight
                                        most common                                 COVID-19
                                                                                                                                                            VOC: Variant of concern
                                                                                                                                                             VOI: Variant of interest
  screening and                         current pathway                            Positive test
                                                                                                                                              n=600 per week
  sequencing
  process applied                                                             % screened samples that are
                                                                              presumptive VOC changes
  to positive                                            VOC                  every week; this is what’s          Cluster, outbreaks,
                                                                                                                                                    Baseline surveillance
                                                       Screening                                                                                     (random sample)
  COVID-19 tests                                                              reported as estimated % VOC
                                                                              prevalence in BC
                                                                                                                 hospitalized patients,
                                                                                                                 re-infections, vaccine
  in BC, April 2021                                                                                                escape, travellers,
                                                                                                                   and other targeted
                                                                          Presumptive                                 surveillance
                                         Non-VOCs
                                                                             VOCs
                                                 10-20%
                                                                                                                                               Not all samples from
                                                                                                                                               these groups are VOCs
                                                                   Presumptive          Presumptive         Emerging
                                                                     B.1.1.7            P.1/B.1.351           VOI

                                                   Not all presumptive
                                                  VOCs are sequenced                              >25%          100%
                                                                             5-10%
                                                                                                                                   Sequencing                  Non-VOC

Please note the differences in turnaround                                       Estimate of
                                                                                                             Confirmed       Confirmed          Confirmed
time for screening and sequencing: screening
                                                                                  B.1.1.7                                                                              VOI
                                                                                prevalence                    B.1.1.7           P.1              B.1.351
results usually come back within 1-2 days,
while sequencing results come back after
                                                          Prevalence estimates of specific VOCs
approximately one week, but it could also                   are based on samples from baseline                              Estimate of P.1      Estimate of B.1.351
take longer if there are lab backlogs.                               surveillance and screening                               prevalence             prevalence

                                                                                 CONFIDENTIAL DRAFT                                                                            33
BC in Canadian and Global Context - Key Messages
1. Globally, growth in cases in South America, Europe, and North America have declined while it
has increased in parts of Asia, driven by recent resurgence in India.
2. Across Canada, cases are trending up in AB & MB. NS and NWT are seeing the highest increases
yet during the pandemic. In BC, ON, QC and SK cases are on the decline. Hospital census
increasing in AB, MB, and NS; recent declines observed in BC, ON, QC, and SK. Death rates are
generally stable or declining, overall very low.
3. Alberta’s case rate continues to be the highest of all jurisdictions in Canada and the US, and is
currently ~3.3x the BC rate. Potential for importation into BC is high.
4. VOCs are now dominant (>80%) in BC, ON and QC.
5. Canadian vaccination update: >50% population vaccinated in the YK and NWT; QC ~39%;
BC ~36%; Canada overall ~36%. In AB, 96% of delivered doses have been administered.
6. Global vaccination update: % population that has been vaccinated with at least one dose: Israel
~63%, UK ~51%, US ~44%, Chile ~43%, Europe 24-35%.
34Globally, growth in cases in South America, Europe, and North America have declined
while it has increased in parts of Asia, driven by recent resurgence in India
Source CONFIDENTIAL DRAFT Source 35Across Canada, cases are trending up in AB & MB. NS and NWT are seeing the highest increases yet
since the pandemic began. In BC, ON, QC and SK cases are on the decline. Death rates are generally
stable or declining, overall very low.
CONFIDENTIAL DRAFT Data to 5 May 36Hospital census increasing in AB, MB, and NS; recent declines observed in BC, ON, QC, and SK
CONFIDENTIAL DRAFT Data to 5 May 37Alberta’s case rate continues to be
the highest of all jurisdictions in
Canada and the US, and is currently
~3.3x the BC rate. Potential for
importation into BC is high.
CONFIDENTIAL DRAFT Data to 5 May 38VOCs are now dominant (>80%) in BC, ON and QC. This is the last week this graph will be shown.
Gray lines = European countries for which
data are available. Their trajectories have
consistently shown that it takes ~2
months for B.1.1.7 to become a dominant
strain, regardless if COVID cases were
stable or increasing.
NB: AB data hasn’t been updated since last week;
due to back log, AB’s figures may not be an
accurate reflection of the current situation and
may not be comparable to other jurisdictions
Please note that these are approximate estimates only and may not be accurate. Data across jurisdictions are not directly comparable due to different sampling methodologies. There were likely
changes in methodology over time within the same jurisdiction, especially during the early part of the curve. Some data points were extrapolated/approximated to complete the visualization.
CONFIDENTIAL DRAFT 39Canadian vaccination update, 6 May: >50% population vaccinated in the YK
and NWT; QC ~39%; BC ~36%; Canada overall ~36%.
Note how in AB, almost
every delivered dose
has been administered
CONFIDENTIAL DRAFT Source 40Global vaccination update, May 5
BC – and Canada – have been closely following the
vaccination trajectories of the UK, Hungary and Chile.
Many European countries have recently started to
extend the interval between the doses.
Israel
UK
Hungary Chile
US
Canada
Finland
Germany Serbia
Norway
Denmark
Note the differences in
the speed of vaccine
rollout between
countries that have
delayed administration
of second dose have vs
those that haven’t Source
Source CONFIDENTIAL DRAFT 41Dynamic compartmental modeling: recent trends
Our model shows that Rt remains below 1 in all regions of BC. Whenever Rt > 1, there is a risk
that the number of new cases will grow.
BC (0.84 → 0.76) Fraser (0.95 → 0.81) Vancouver (0.71 ≈ 0.70)
Coastal
Interior (0.86 ≈ 0.85) Vancouver (0.67 ≈ 0.68) Northern (0.74 → 0.63)
Island
Solid black line: median Rt , data up to May 4, 2021; Grey band: 5%-95% credible interval; Purple bars: all reported cases. Due to lag from
symptom onset to reporting, most recent cases are not shown. Recent trend shown comparing 7 day average Rt from (last week → this week).Scenarios of trajectory in cases, hospitalizations, and deaths in BC based on
infectious contact
Fitting period: March 1, CONFIDENTIAL DRAFT 43
2020 – April 29, 2021Scenarios of trajectories in cases based on infectious contact, by HA
Case Report Date
Fitting period: March 1, CONFIDENTIAL DRAFT 44
2020 – April 29, 2021Scenarios of trajectories in hospitalizations incidence based on infectious
contact, by FH and VCH
Case Report Date Case Report Date
Fitting period: March 1, 2020 –
CONFIDENTIAL DRAFT 45
April 29, 2021Model notes and assumptions
• Rt modelling: a dynamic compartmental model was fit to COVID-19 data for BC using a Bayesian framework (Anderson et al. 2020. PLoS Comp.
Biol. 16(12): e1008274). Results are presented as provincial and regional time-varying estimates of average daily transmission rate (Rt).
• The following caveats apply to these results
• the model does not consider importation of cases, hence all transmission is assumed to arise from local cases
• the model does not distinguish cases arising from variants of concern (VoCs) versus ‘wild-type’ COVID-19, hence model estimates
represent average rates of transmission
• Scenarios going forward: levels of infectious contact characterized by historic estimated rates:
• 40% would be similar to what was observed after the 8th September, 2020 announcement
• 50% would be similar to changes observed after 7th November 2020 announcement
• 60% would be similar rate of contact observed at beginning of 2021.
• Current BC Vaccination schedule incorporated into model fitting and projections incorporating variable rates of contact and susceptibility by
age. Note vaccination of higher contact workers not explicitly included, which may under-estimate total impact of vaccination.
• Vaccination was modeled using the current proposed one dose schedule by age group, with all eligible age groups vaccinated by end of June,
adjusting for age-dependent impact on transmission. Further assumed a 15% hesitancy of all age groups.
• Establishment of VoC varied by region and estimated from sequencing of cases. Estimates used were: Fraser: 20th January, Vancouver Coastal:
7th February, Interior: 15th March, and 25th March Vancouver Island and Northern.
• Dominance of VoC assumed to be 7 weeks in line with other jurisdictions. 50% increased transmission and disease severity selected to reflect
experienced changes in other jurisdictions.
CONFIDENTIAL DRAFT 46You can also read