How EU information systems can support biodiversity planning in Africa - Lucy Bastin & Mariagrazia Graziano - Biodiversity Advisor
←
→
Page content transcription
If your browser does not render page correctly, please read the page content below
How EU information
systems can support
    biodiversity
 planning in Africa

Lucy Bastin & Mariagrazia Graziano
How EU information
systems can support
     biodiversity
 planning in Africa ?

Lucy Bastin, Mariagrazia Graziano
and many others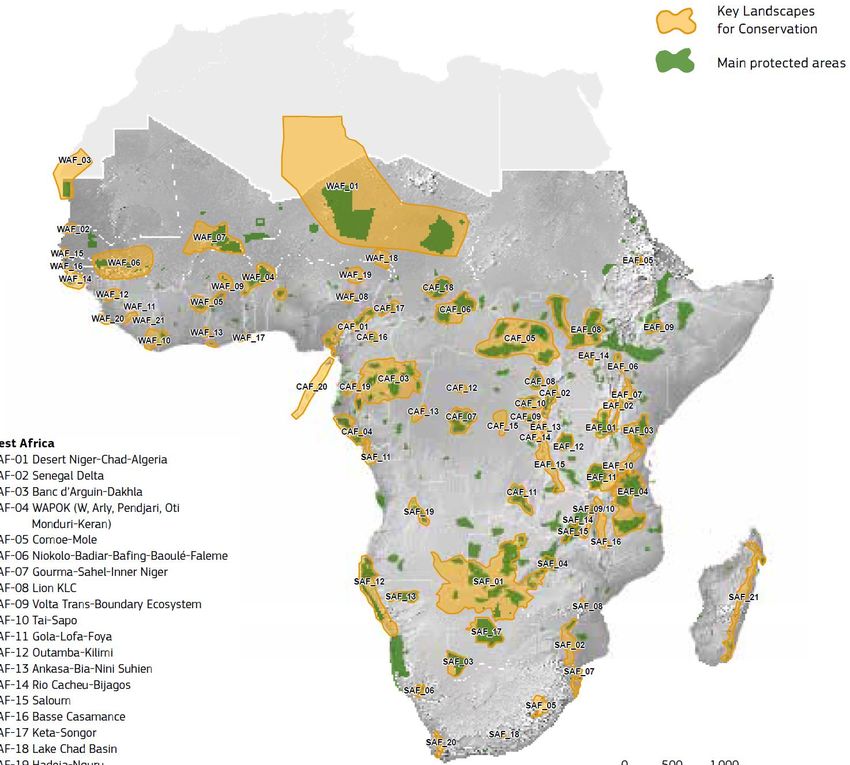
JRC: Joint Research Centre of the
European Commission

   "     As the science and knowledge service
 of the European Commission, our mission is to support
        EU policies with independent evidence

                                               "
           throughout the whole policy cycle

Knowledge driving decisions

Expertise in geospatial applications for policy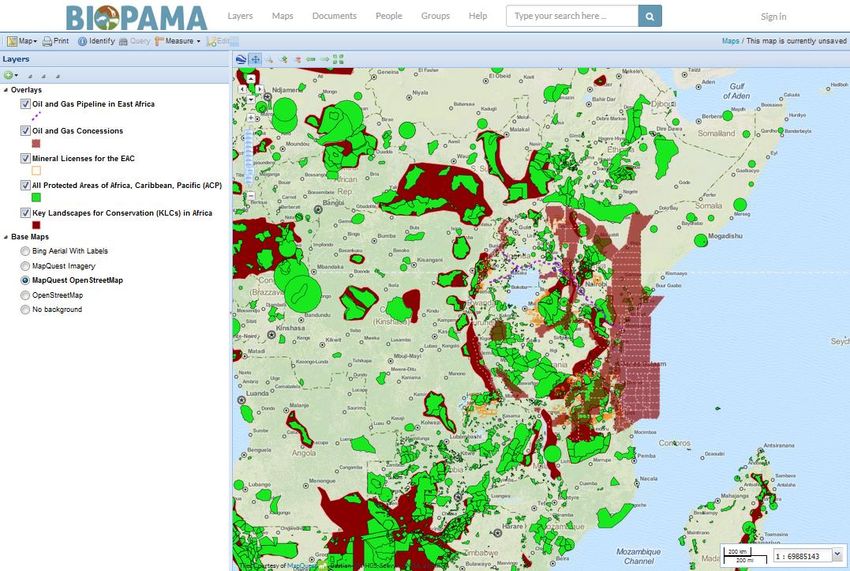
JRC works on: e.g.

 Forests           Terrestrial     Freshwater
  Carbon
              Earth Observation            Marine
    Soil
Land Degradation &        Biodiversity &
  Desertification        Protected Areas

Invasive Alien Species       Ecosystem Services
                                 Food Security
Global-level indicators for
                                             protected areas

Regional and national support information sharing and use
More detailed indicators and tailored analyses / information products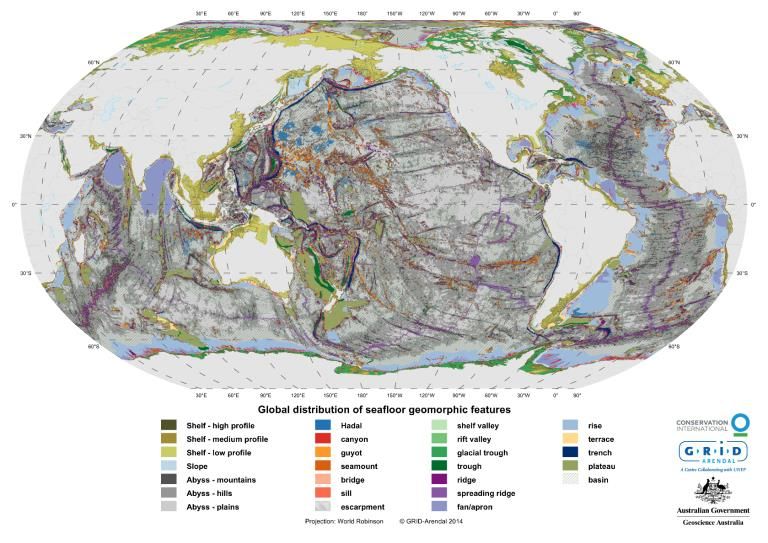
African, Caribbean, Pacific Group of States – focus for EU Cooperation

                                         >8000
                                     protected areas

    79 countries
                                           >800 million
                                             people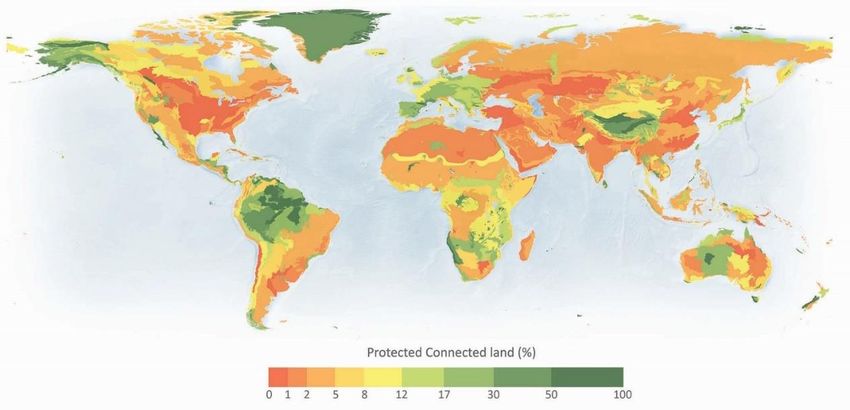
Support ACP countries to achieve, monitor and report on
their global biodiversity commitments and targets

Support implementation of relevant existing regional & national
strategies and action plans
http://geonode-rris.biopama.org/

                               Contribute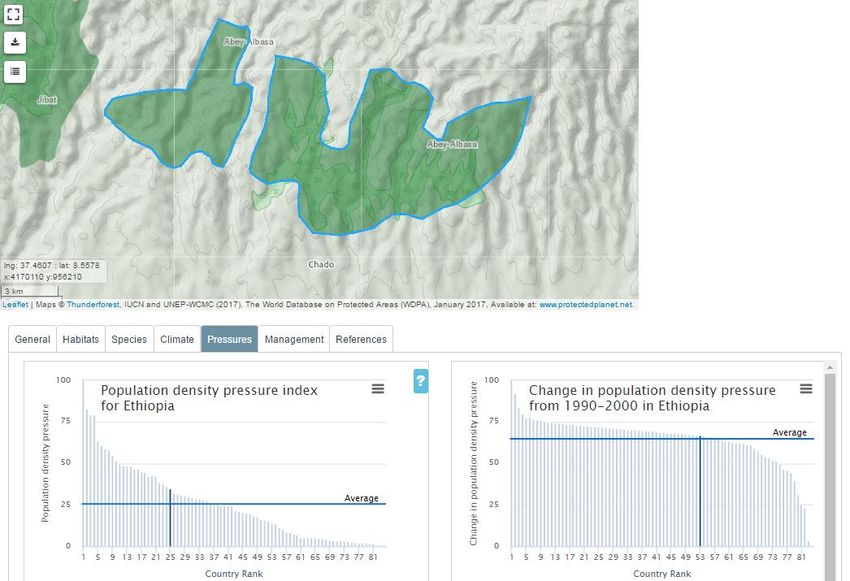
Support mapping and
  spatial analyses
Explore

          http://rris.biopama.org/pa/32988
Connect
• With each other, through the
Yammer Network
• With datasets and services,
through industry-standard
protocols
• With updated news, events
and opportunities related to
protected areas
• With the wider public, through
StoryMaps and data
visualisation
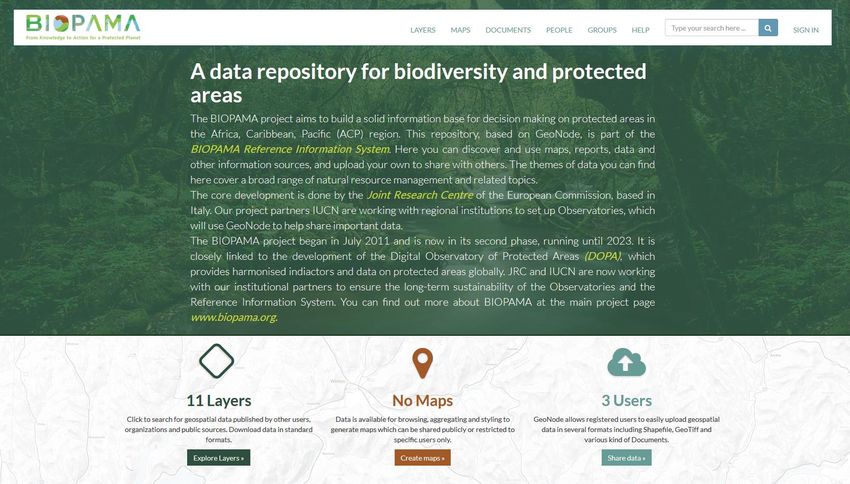
https://www.yammer.com/biopamaA Target-Based Approach Under development - http://beta.biopama.org/wireframes/regional/build/indicator/2
Enriching PA information

Digitising tracks, park infrastructure etc into OSM
Analyse

• Show trends and change inside and around protected areas

• Understand ecological connectivity of protected areas and
  proposed networks

• Assess pressures and threats

• Explore management effectiveness and governance

• Generate input to reporting

• Assist partners in identifying and using
  appropriate tools, methods, and data that is
  fit-for-purpose
• Build on existing guidance
  & best practice
• Address key needs of
  end users
• Identify really effective
  information products, and
  work back from those:
What data was really useful,
and what made it useful?
How can that data owner
get credit, to demonstrate
the value of sharing?
Initiatives to link with
Biodiversity-relevant information
• GMES & Africa
• African Data Cubes
• PREPARED, Vital Signs…

Biodiversity data
• GBIF BID projects
• JRS African Biodiversity Challenge
• CONNECT (WCMC-GEF)
• BASPA, PACA inventory

Global initiatives
• IUCN PANORAMA solutions
• UNEP-WCMC Green List of Management Effectiveness
• OCEAN+
• GEO BON and its components

And many many more…
Goals
• An open, interoperable platform, driven by regional needs

• Improving databases at global, regional, national and site level

• Combining geospatial and non-geospatial information (management,
  governance, links to PANORAMA solutions….)

• A hub for PA data and WDPA reporting

• Supported by JRC with dedicated staff for development

• What are the priority needs and the gaps we can help fill, to
  ease the production of high-quality, defensible information
  products?

• From data mobilization and documentation to data USE
BlueBridge                        GRID-Arendal

Cloud service to compute country / ecoregion-level
protection of key marine features and habitats

Delivers nice summary results…
Underpinned by technical (but very very useful!)
standards -makes analysis transparent /
reproducible
BlueBridge                                                                  VREs
 ‘Virtual Research Environments’ with
 - Geospatial catalogues (inc. Fishbase, AquaMaps…)
 - Cleaning tools for OBIS data
 - Tools for SDM, machine learning, classification,
    stock modelling…

 Model runs as a Web service, with:
 - ISO 19115 metadata for all outputs and inputs
 - Provenance documentation of all processing steps, including
 parameters
 - Unique identifiers for all datasets used (and their versions)

 Confidential data can be used but kept encapsulated in the system
 Scenario comparisons are easier to track
‘A Service for Statistical Analysis of Marine Data in a Distributed e-Infrastructure’ Coro et al., 2013
‘A Web application to publish R scripts as-a-Service on a Cloud computing platform’ Coro et al., 2016
Could / should we extend this approach to demystify
spatial prioritisation tools?
marxan.io – current interface
Especially to clarify the trickier / more obscure steps:
- Problem definition, stakeholder consultation
- How well do available data capture phenomena of value?
- Exploring the impact of poor data / subsetting the solution
- Scenario comparison
- Tweaking costs, embedding connectivity
- Keeping track of analysis runsWould any of these kinds of technical tools be helpful in the life cycle of your analyses? - statistical tools for adding value to input data - data crunching tools to generate input files - a place to publish your input data and metadata - a place to archive / curate the elements of a workflow including data - reliable means to protect / obfuscate certain data - workflow documentation / lineage that helps practically re-run an analysis - visualisation tools for the results - visualisations of the initial steps - e.g., what does the landscape look like as prioritised by different stakeholders? why are certain zones unavailable / crucial? - interactive tools to see how results change with better or worse data / changing conditions / changing stakeholder priorities / removal of patches from the solution
Thanks for listening!
        lucy.bastin@ec.europa.eu

 https://www.yammer.com/biopama/#/home

                    http://dopa.jrc.ec.europa.eu/explorer/

                    http://www.biopama.org/
Reference data and indicators
available as open web services:
– Which species and ecosystems are present?
– How much are they threatened & how well are they protected?
– What are the main anthropogenic pressures?
...etc.Key metrics and statistics e.g. proportion of each ecoregion formally protected…
Global PA connectivity indicator
 for ecoregions and countries
                 Protected Connected land (global ecoregion average),
                 for 10 km median dispersal distance, June 2016

                          Protected Connected land (% of ecoregion area),
                          for 10 km median dispersal distance, June 2016

                                                         Saura et al. 2016
https://global-surface-water.appspot.com/
Global Surface Water Explorer
Etosha Pan
Pekel et al. (2016)Global Human Settlement Layer
http://ghslsys.jrc.ec.europa.eu/Supporting high- impact reports CBD recognizes DOPA as support for NBSAP and PoWPA action planning and implementation (Decision XI/24 & Notification) – especially in data-poor environments
Why do we work on global biodiversity issues?
• Global biodiversity loss affects the EU and
EU contributes to global biodiversity loss
• EU Biodiversity Strategy to 2020: Target 6 –
“Help avert global biodiversity loss”
• EU B4LIFE flagship initiative allocates
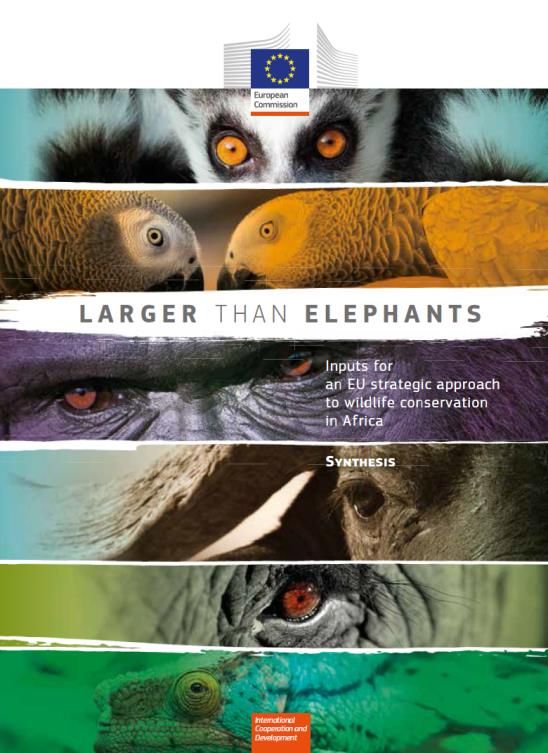
800 million Euros from 2014-2020EU Wildlife Conservation Strategy for Africa • Covers all of Sub-Saharan Africa • Identifies key threats and responses for next 10 years (€7.7 billion needed) • Focus on 85 Key Landscapes for Conservation = over 300 PAs (many TFCAs)
Key Landscapes for
Conservation (KLCs)
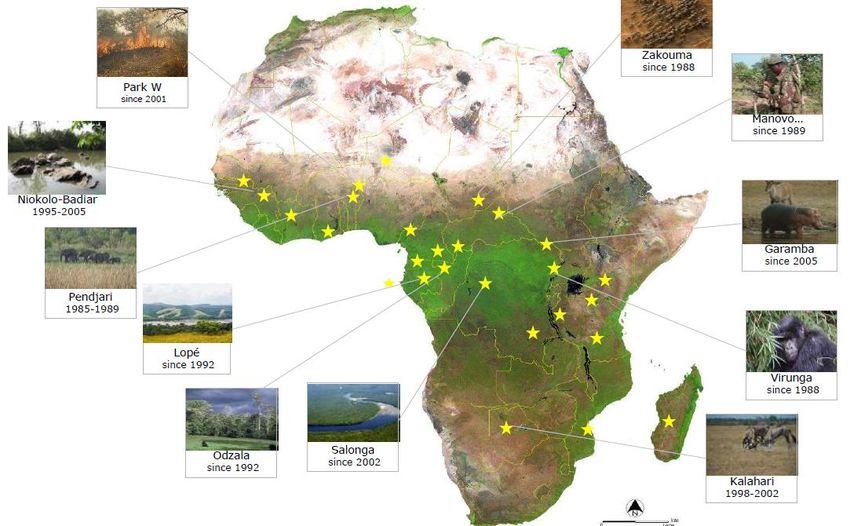
EU-funded Protected Areas (examples)
‘Information systems’: not just geospatial catalogues

* Including shared expertise, best practice, templates, guidance
and support for legal issues, data sharing agreements, disclaimers,
ethical use of data etc…
You can also read