TA 11.1 Water AMP7 Comparative Industry Performance Assessment Technical Annex - September 2018 Version 1.0 - Southern Water
←
→
Page content transcription
If your browser does not render page correctly, please read the page content below

TA 11.1 Water AMP7
Comparative Industry
Performance Assessment
Technical Annex

September 2018
Version 1.0
Contents

Navigation: TA 11.1 - Water AMP7 Comparative Industry
Performance Assessment .......................................................................... 3
Introduction ................................................................................................ 4
Compliance Risk Index............................................................................... 4
Interruptions to Supply ............................................................................... 6
Leakage ..................................................................................................... 9
Per Capita Consumption (PCC) ............................................................... 11
Bursts ....................................................................................................... 13
Appearance .............................................................................................. 14
Taste and Odour ...................................................................................... 16

2     TA 11.1 – Water AMP7 Comparaitve Industry Performance
Assessment Technical Annex
Navigation: TA 11.1 - Water AMP7 Comparative
Industry Performance Assessment

 Purpose:
 This technical annex captures how we have assessed the current and future performance
 of other water companies to predict their performance relative to our forecast
 performance, so that we can target upper quartile performance, where this is supported by
 our customers and stakeholders. It comprises part of the supporting evidence for chapter
 6 - Outcomes, Performance Commitments & Outcome Delivery Incentives and chapter 11
 - Wholesale Water.

The table below summarises the Ofwat tests that are addressed by the evidence presented
in this Annex.
Table 1- Relevant Ofwat tests
 Ref           Ofwat test                                                   Comment
 Primary Focus Areas
 Delivering     How appropriate, well-     High-quality plan:                      We have used our assessment of
 outcomes for   evidenced and stretching   Performance commitments set at          of the current and future
 customers –    are the company’s          stretching levels, including for        performance of other water
 OC1            proposed performance       leakage and water efficiency,           companies to predict their
                commitments and service    which should be supported by            performance relative to our forecast
                levels?                    high-quality evidence that the          performance, so that we can target
                                           performance commitments are             upper quartile performance, where
                                           stretching.                             this is supported by our customers
                                           Take a robust, stretching               and stakeholders.
                                           approach to developing its
                                           bespoke performance
                                           commitments and service levels.
                                           Approach should be supported by
                                           high-quality evidence, including
                                           CCG support for the effectiveness
                                           of its customer engagement.
                                           Propose a robust package of
                                           ODIs to incentivise itself to deliver
                                           performance commitments to
                                           customers. This should use
                                           reputational and financial outcome
                                           delivery incentives grounded in
                                           customer research.
                                           Risk and reward package
                                           focussing strongly on service
                                           delivery.
                                           Ambitious and innovative plan:
                                           Propose innovative and sector-
                                           leading performance
                                           commitments with stretching
                                           levels and an ODI incentive
                                           package supporting outstanding
                                           achievement and innovation as
                                           well as protecting customers
                                           against the risk of delivery failure.
                                           Present high-quality evidence on
                                           its plans to achieve exceptional
                                           service performance.

3     TA 11.1 – Water AMP7 Comparaitve Industry Performance
Assessment Technical Annex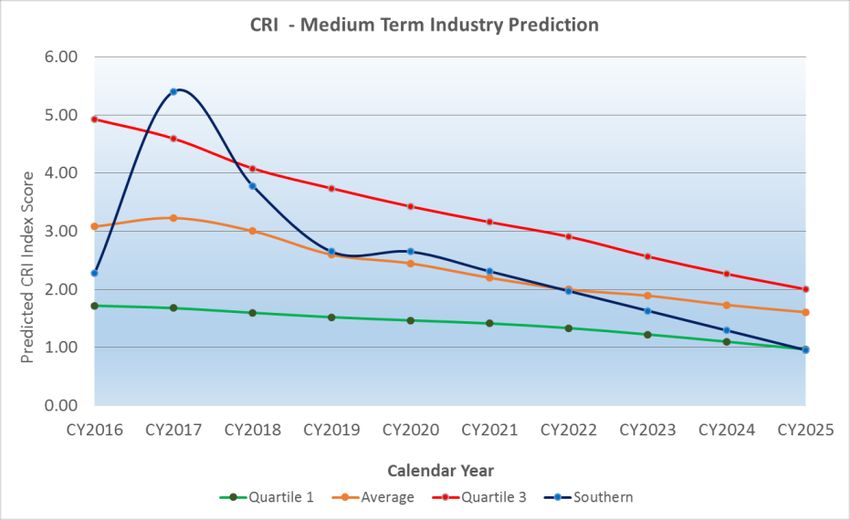
Introduction
This document captures how we have assessed future industry performance. This Technical
Annex supports the derivation of ODIs, including medium-term (2018 to 2025) industry
performance forecasts that have been used to inform our assessment of industry frontier,
upper quartile and average performance. This report provides details of the assessment for
the following Common Performance Commitments:
Compliance Risk Index
Interruptions to supply
Leakage
Per Capita Consumption (PCC)
Bursts
Discolouration
Taste and Odour
Compliance Risk Index
The Compliance Risk Index (CRI) is a new measure from 2016 and hence little historic
analysis is possible (the previous MZC measure in not directly comparable). To gauge
potential performance of other companies we have assumed behaviours based on
information in the public domain and known regulatory issues specific to certain companies.
Figure 1 - CRI prediction to 202512
Source: PR19 Data Table App1 and AMP7 Industry Performance Assessment
1
CRI is shown in Calendar Year (CY) as per OFWAT Final Methodology.
2
As per the OFWAT Final Methodology, the PR19 Data Table App1 shows a target of 0. Figure 3 shows our anticipated
performance projection.
4 TA 11.1 – Water AMP7 Comparaitve Industry Performance
Assessment Technical Annex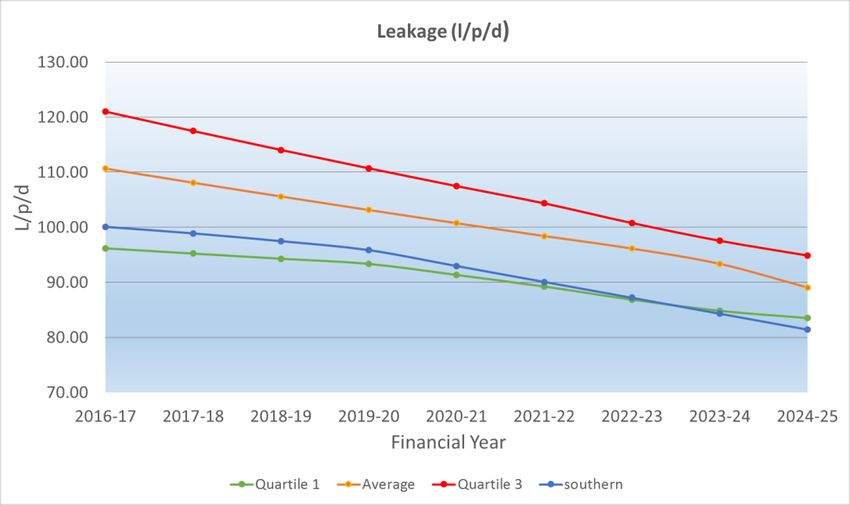
DWI expect that current (CY2016) upper quartile performance will become the average for
the industry3. We have used this expectation to scale our assessment of industry
performance improvements. We have assumed that the CY2025 industry average is the
same as the CY2016 industry upper quartile position. Our assessment was undertaken in
the following steps:
1. We first took the CRI numbers from the DWI Chief Inspectors Report 20174.
2. We made specific adjustments to projected company performance improvements
where we had market intelligence.
3. Otherwise we made general base assumptions about the rate of improvement:
a) We assumed a 1% improvement per annum for companies already in Quartile 1.
b) We assumed a 5% improvement per annum for companies already in Quartile 2.
c) We assumed a 15% improvement per annum for companies in Quartiles 3 & 4.
With regards to point (2) above, we have made the following company specific adjustments
based on market intelligence (above the base assumption given above):
Anglian Water plan to deploy transient monitoring/acoustic logging, this is anticipated
to reduce bursts by 10%. This will have a corresponding impact on CRI (distribution
component is approximately 30% of CRI) = 3% improvement.
Sutton and East Surrey Water are deploying smart networks in the form of additional
flow/pressure sensors with predictive analysis with an expected 5% reduction in
bursts. This will have a corresponding impact on CRI (distribution component is
approximately 30% of CRI) = 1.5% improvement to CRI.
Affinity Water have deployed extensive hydro-acoustic logging which has the
potential to reduce bursts (through predictive/lead indicators) by 10%. This will have
a corresponding impact on CRI (distribution component is approximately 30% of CRI)
= 3% improvement to CRI.
With regards to point (3) above, the quartile improvements are based on historical
improvements in the current Mean Zonal Compliance metric (by company rank) scaled to the
expected improved industry average5.
This is with the exception of Thames Water, United Utilities (UU) and Severn Trent (including
Dee Valley Water) all of whom are currently subject to DWI scrutiny and delivering
transformative programmes under notice. For these companies a 15% per annum
improvement has been assumed regardless of starting quartile.
Based on this we predict we will be 4th in the industry by 2024 and in the upper quartile.
Based on this forecast, we will be in close competition with Bournemouth Water and Bristol
Water on the Q1/Q2 boundary (all separated by 0.03 index points) as shown in Figure 2.
3
Presentation from the ATi Network Monitoring Conference 22nd June 2017
4
DWI Chief Inspectors Report 2017
5
This was done as part an SME review.
5 TA 11.1 – Water AMP7 Comparaitve Industry Performance
Assessment Technical Annex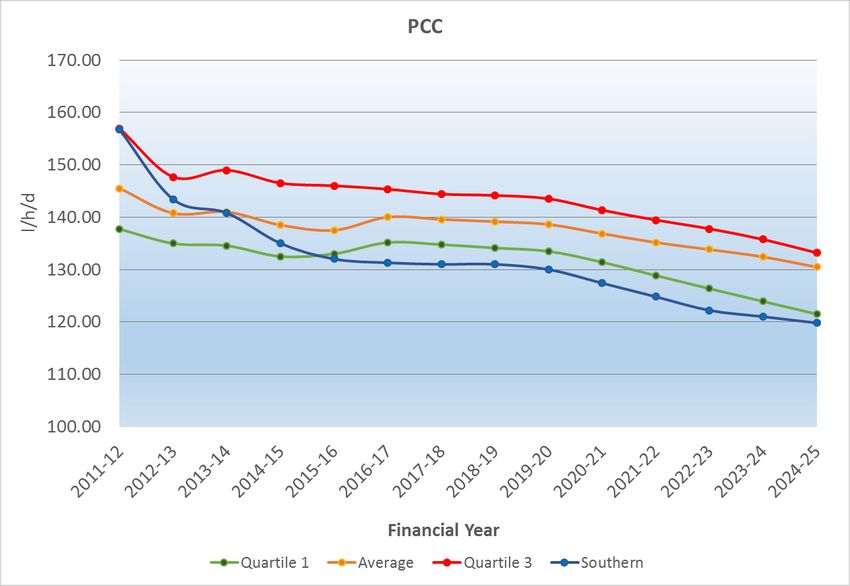
Current6                                         2025
         COMPANY      Ranking                  CY2025                  Ranking   Change
         SES          1                        0.02                    1         0
         Wessex       2                        0.70                    2         0
         Portsmouth   3                        0.82                    3         0
         Southern     6                        0.95                    4         2
         Bournemouth 4                         0.96                    5         -1
         Bristol      5                        0.99                    6         -1
         UU           12                       1.25                    7         5
         Thames       15                       1.47                    8         7
         South West   9                        1.56                    9         0
         South Staffs 10                       1.65                    10        0

Figure 2 - Predicted Industry Top 10 CRI Rankings (2025)
Source: PR19 Data Table App1 and AMP7 Industry Performance Assessment

Interruptions to Supply
The interruptions to supply metric has a number of limitations which limit historical analysis,
this is mainly due to the high susceptibility of this metric to weather conditions (volatility) and
changes in the interruptions to supply measure (both the change to property minutes in
15/16 and then to shadow reporting7 for 16/17).
Therefore, for this assessment only 2015/168 and 2016/17 data has been used as a baseline
with these averaged to give a 2017-18 baseline figure.

6
  Final 2017 CRI Rankings not available at time of writing.
7
  Methodology as per UKWIR Guidelines 2018
8
  AMP6 base data from Water UK (Discover Water 15/16 and 16/17 Data)

6     TA 11.1 – Water AMP7 Comparaitve Industry Performance
Assessment Technical Annex
Source: PR19 Data Table App1 and AMP7 Industry Performance Assessment
Figure 3 - Interruptions prediction to 2025
For end AMP6 performance it is assumed that companies projected to meet their ODI target
with 12 out of the 18 companies achieving the Industry standard (12 property minutes) target
by the end of 2019-20 (those that are not projected to meet the ODI target are projected to
improve by 5% per annum to minimise financial impact of the ODI penalties).
Our AMP7 assessment was undertaken in the following steps:
1. We first took the predicted 2019-20 baseline position.
2. We made specific adjustments to projected company performance improvements
where we had market intelligence.
3. Otherwise, we made general base assumptions about the rate of improvement:
a) We assumed a 1% improvement for companies already in Quartile 1.
b) We assumed a 5% improvement for companies already in Quartile 2.
c) We assumed a 10% improvement for companies in the lower two quartiles.
With regards to point (2) above, we have made the following company specific adjustments
based on market intelligence (above the base assumption given above):
Thames Water (deployment of Trunkminder S) - it is assumed a 15% reduction in
transient driven bursts is achieved by 2025.9
United Utilities (deployment of ONet pressure management system10) - In a trial DMA
[UU] claimed a reduction of 38% in bursts11. We have assumed that 50% effective
9
Thames Water Press Release – 17th March 2018
10
Smart Water Networks and Smart Metering Technology Review and Investment Appraisal (May 2018)
11
Note we have already extensively leveraged pressure management
7 TA 11.1 – Water AMP7 Comparaitve Industry Performance
Assessment Technical Annexdeployment can be achieved in AMP7 (due to scale of asset base) at an
effectiveness of 75% this equates to a burst and interruption reduction of 14% by the
end of AMP7.12
Anglian Water (deployment of ONet pressure management system) - In a trial DMA
UU13 claimed a reduction of 38% in bursts. We have assumed that 75% effective
deployment can be achieved in the AMP7 (due to scale of asset base) at an
effectiveness of 75% this equates to a burst and interruption reduction of 21% by the
end of AMP714
Sutton & East Surrey Water are deploying smart networks in the form of additional
flow/pressure sensors with predictive analysis with an expected 5% reduction in
bursts and interruptions.15
Affinity Water have deployed extensive hydro-acoustic logging which has the
potential to reduce bursts (through predictive/lead indicators) by 10% in bursts and
interruptions16
Welsh Water (deployment of optiMiser) = 10-12% reduction in bursts and interruption
(12% reduction to the end of AMP7 is assumed) 17
Wessex Water (deployment of optiMiser) = 10-12% reduction in bursts and
interruption (12% reduction to the end of AMP7 is assumed)18
With regards to point (3) above the quartile improvements are based on historical
improvements in the current interruptions performance (by company rank).
Based on this analysis we are predicted to be 5th in the industry by 2022/23 and in Q1, see
Figure 4.
COMPANY Current Ranking 2024-25 2025 Ranking Change
Northumbrian 2 00:02:00 1 1
Bournemouth 1 00:02:07 2 -1
Portsmouth 3 00:03:39 3 0
South Staffs 5 00:04:30 4 1
Southern 6 00:05:30 5 1
SSE 4 00:05:37 6 -2
Anglian 10 00:07:39 7 3
Severn Trent 8 00:09:49 8 0
Thames 9 00:10:00 9 0
United utilities 16 00:11:07 10 6
Source: PR19 Data Table App1 and AMP7 Industry Performance Assessment
Figure 4 - Predicted Industry Top 10 Rankings for Interruptions to Supply (2025)
12
Smart Water Networks and Smart Metering Technology Review and Investment Appraisal (May 2018)
13
We assumed the same reduction potential as United Utilities
14
Smart Water Networks and Smart Metering Technology Review and Investment Appraisal (May 2018)
15
Global Leakage Summit 2018 (Proceedings and Presentations) (2018)
16
Global Leakage Summit 2018 (Proceedings and Presentations) (2018)
17
Smart Water Networks and Smart Metering Technology Review and Investment Appraisal (May 2018)
18
Global Leakage Summit 2018 (Proceedings and Presentations) (2018)
8 TA 11.1 – Water AMP7 Comparaitve Industry Performance
Assessment Technical AnnexLeakage
The leakage metric has a number of limitations which limit historical analysis, this is mainly
due to the change to reporting methodology (as a consequence of which, only 2016/17 data
is available). Ofwat have stated that they expect companies to achieve a 15% reduction as a
minimum by 2025. Ofwat also informed the Global Leakage Summit (March-2018) that they
expected two thirds of companies to meet the 15% target19. We have therefore assumed that
the average performance improvement in the industry will be 15%.
Source: PR19 Data Table App1 and AMP7 Industry Performance Assessment
Figure 5 - Leakage prediction to 2025
Our AMP7 assessment was undertaken in the following steps:
1. We first took the predicted 2016-17 baseline position.
2. We made specific adjustments to projected company performance improvements
where we had market intelligence.
3. Otherwise we made general base assumptions about the rate of improvement:
a) We assumed a 5% improvement for companies already in Quartile 1.
b) We assumed a 10% improvement for companies already in Quartile 2.
c) We assumed a 15% improvement for companies in Quartile 3.
d) We assumed a 20% improvement for companies in Quartile 4.
With regards to point (2) above, we have made the following company specific adjustments
based on market intelligence:
19
Global Leakage Summit 2018 (Proceedings and Presentations) (2018)
9 TA 11.1 – Water AMP7 Comparaitve Industry Performance
Assessment Technical Annex Thames Water (deployment of AMI meter network over AMP7 and AMP8), assumes
this can reduce Customer Side Leakage (CSL) by 25%. CSL accounts for
approximately 28% of total leakage. Therefore, this equates to an additional 7% of
leakage reduction in AMP7 above the base 15% (this is assumed to be recovered by
convention ALC and mains replacement).20
Anglian Water (impact of ONet deployment). Asset base wide pressure optimisation
– information available in the public domain suggests that an average 5m pressure
drop across all DMA’s (this has been equated to 4% reduction in total leakage21). In
addition to this Anglian Water also plan to deploy remote sensing (drones/satellite
imaging) and acoustic logging. Anglian Water have stated publicly that their AMP7
leakage reduction target will be 24%.22
United Utilities (impact of ONet deployment). Asset base wide pressure optimisation
– there is little information in the public domain, we have therefore assumed this is
the same as Anglian Water (4%).23
Bristol Water have publicly announced that they have a target of 15% reduction for
AMP7.24
Affinity Water (deployment of an AMI meter network over AMP7), assumes this can
reduce CSL by 25%. CSL accounts for approximately 28% of total leakage.
Therefore, this equates to an additional 7% of leakage reduction and in combination
with acoustic logging this will equal a 14% reduction which is a publicly declared
target.25
Sutton & East Surrey (deployment of an AMI meter network over AMP7), assumes
this can reduce CSL by 25%. CSL accounts for approximately 28% of total leakage.
Therefore, this equates to an additional 7% of leakage reduction in AMP7 above the
base 5%.26
Yorkshire Water announced that they were targeting a 40% reduction, we believe this
may be optimistic and have forecast 30% based on likely practicality.27
With regards to point (3) above, the quartile improvements were scaled based on the median
company delivering the 15% reduction.
Based on this analysis we predict we will be 4th in the industry by 2024/25 and in Q1, as
shown in Figure 6.
20
Smart Water Networks and Smart Metering Technology Review and Investment Appraisal (May 2018)
21
ONet Internet Publication – March 2018
22
Global Leakage Summit 2018 (Proceedings and Presentations) (2018)
23
Smart Water Networks and Smart Metering Technology Review and Investment Appraisal (May 2018)
24
Global Leakage Summit 2018 (Proceedings and Presentations) (2018)
25
Smart Water Networks and Smart Metering Technology Review and Investment Appraisal (May 2018)
26
Smart Water Networks and Smart Metering Technology Review and Investment Appraisal (May 2018)
27
Global Leakage Summit 2018 (Proceedings and Presentations) (2018)
10 TA 11.1 – Water AMP7 Comparaitve Industry Performance
Assessment Technical AnnexCurrent 2025
COMPANY Ranking 2024-25 Ranking Change
Anglian 1 63.61 1 0
SES 3 76.51 2 1
Bristol Water 5 76.57 3 2
Southern 7 81.41 4 3
South East 2 81.52 5 -3
Essex & Suffolk 4 84.17 6 -2
Dee Valley 6 85.55 7 -1
Cambridge 8 86.97 8 0
Yorkshire 17 87.98 9 8
Bournemouth 9 88.01 10 -1
Source: PR19 Data Table App1 and AMP7 Industry Performance Assessment
Figure 6: Predicted Industry Rankings for Leakage (2025) 28
Per Capita Consumption (PCC)
The PCC metric has a substantial amount of historical data with trends being fairly linear for
each company since the start of the decade29. Therefore to assess potential performance a
simple linear average rate of change has been applied from the 16-17 baseline30.
Source: PR19 Data Table App1 and AMP7 Industry Performance Assessment
Figure 7 - PCC prediction to 2025
This is with the exception of the following:
28
Leakage expressed at l/p/d for comparison purposes and excluding growth (81.41 = 89.6 Ml/d as per App1)
29
Quartile level assumptions are not required for well understood metrics with sufficient historical data
30
Water UK: Discover Water (2015/16 and 2016/17 data)
11 TA 11.1 – Water AMP7 Comparaitve Industry Performance
Assessment Technical Annex Affinity Water (because the company now plans to deploy an AMI universal meter
network over AMP7).
Sutton & East Surrey Water (SES) (deployment of AMI universal meter network over
AMP7).
Thames Water (deployment of AMI universal meter network over AMP7 and AMP8).
For the above companies a ~20 l/p/d reduction is assumed based on the improved PCC
achieved through our Universal Metering Programme.31 32
A number of companies have also communicated PCC targets for the end of AMP7 33:
Bristol Water have stated a target of 130 l/h/d by 2025, which would imply a reduction
of 10%.
Yorkshire Water have stated a target of a 20% reduction by 2025.
Anglian Water have stated a target of 120 l/h/d by 2025, which would imply a
reduction of 10%.
Based on this analysis we predict we will be 2nd in the industry by 2024/25 and in Q1, as
shown in Figure 8.
Current 2025
COMPANY Ranking 2024-25 Ranking Change
South Staffs 1 118 1 -1
Southern 2 120 2 -1
United Utilities 9 120 3 5
Anglian 6 121 4 1
Yorkshire 4 122 5 -2
Severn Trent 3 123 6 2
Dee Valley 5 127 7 -2
Portsmouth 14 128 8 6
South West 7 129 9 -2
Cambridge 8 130 10 -2
Source: PR19 Data Table App1 and AMP7 Industry Performance Assessment
Figure 8 - Predicted Industry Top 10 Rankings for PCC (2025)
31
Please see previous sections for references for AMI deployment
32
Based on 2011-12 to 2016-17 reduction achieved by SWS.
33
Global Leakage Summit 2018 (Proceedings and Presentations) (2018)
12 TA 11.1 – Water AMP7 Comparaitve Industry Performance
Assessment Technical AnnexBursts
The burst metric has a substantial amount of historical data with trends being fairly linear for
each company since 2012/13.
Source: PR19 Data Table App1 and AMP7 Industry Performance Assessment
Figure 9 - Bursts prediction to 2025
Therefore to assess potential performance a simple linear average rate of change has been
applied with a minimum improvement of 5% assumed per company34 from the 16/17
baseline35. This is with the exception of the following (also see Section 3. Interruptions
commentary):
Thames Water (deployment of Trunkminder S) = it is assumed that a 15% reduction
in transient related bursts is achieved by 2025.
United Utilities (deployment of ONet pressure management system) = 38% of bursts
reduced in trial DMA (claimed by UU). We have assumed that 50% effective
deployment can be achieved in AMP7 (due to scale of asset base) at an
effectiveness of 75% equating to a burst and interruption reduction of 14% by the end
of AMP7.
Anglian Water (deployment of ONet pressure management system) = 38% of bursts
reduced in trial DMA (claimed by UU). We have assumed that 75% effective
deployment can be achieved in AMP7 (due to scale of asset base) at an
34
Quartile level assumptions are not required for well understood metrics with sufficient historical data
35
Water UK: Discover Water (2017)
13 TA 11.1 – Water AMP7 Comparaitve Industry Performance
Assessment Technical Annexeffectiveness of 75% equating to a burst and interruption reduction of 21% by the end
of AMP7.
SES Water are deploying smart networks in the form of additional flow/pressure
sensors with predictive analysis with an expected 5% reduction in bursts and
interruptions.36
Affinity Water have deployed extensive hydro-acoustic logging which has the
potential to reduce bursts (through predictive/lead indicators) by 10%.37
Welsh Water (deployment of an optiMiser network management system) = 10-12%
reduction in bursts and interruption (12% reduction to the end of AMP7 is
assumed).38
Wessex Water (deployment of an optiMiser network management system) = 10-12%
reduction in bursts and interruption (12% reduction to the end of AMP7 is
assumed).39
COMPANY Current Ranking 2024-25 2025 Ranking
Sutton & East Surrey 1 60 1
Dee Valley 5 68 2
Portsmouth 2 69 3
Bournemouth 3 80 4
Southern 11 86 5
United Utilities 6 88 6
Severn Trent 7 90 7
Anglian 10 100 8
South West 4 102 9
Welsh Water 9 103 10
Source: PR19 Data Table App1 and AMP7 Industry Performance Assessment
Figure 10: Predicted Industry Top 10 Rankings for Bursts (2025) 40
Based on this analysis we predict we will be 5th in the industry by 2024/25 and in Q1 (see
figure 10).
Appearance
The appearance metric has a substantial amount of historical data with trends being fairly
linear for each company since 2013/14. Therefore to assess potential performance a simple
linear average rate of change has been applied.
36
Global Leakage Summit 2018 (Proceedings and Presentations) (2018)
37
Global Leakage Summit 2018 (Proceedings and Presentations) (2018)
38
Smart Water Networks and Smart Metering Technology Review and Investment Appraisal (May 2018)
39
Smart Water Networks and Smart Metering Technology Review and Investment Appraisal (May 2018)
40
Bursts per 10,000km per annum
14 TA 11.1 – Water AMP7 Comparaitve Industry Performance
Assessment Technical AnnexSource: PR19 Data Table App1 and AMP7 Industry Performance Assessment
Figure 11 - Appearance performance prediction to 2025
This is with the exception of the following:
Thames Water (deployment of Trunkminder S) = it is assumed that a 15% reduction
in transient related bursts is achieved by 202541. Approximately 20%42 of
discolouration is from incidents and hence a reduction of 3% by the end of the AMP7
is assumed in addition to the base improvement of 13%.
United Utilities (deployment of ONet pressure management system) = 38% of bursts
reduced in trial DMA (claimed). We have assumed that 50% effective deployment
can be achieved in AMP7 (due to scale of asset base) We have assumed that 20%
of discolouration incidents are caused by interruptions/bursts this equates to a 3.8%
reduction by the end of AMP7 (in addition to the 3% base improvement).
Anglian Water (deployment of ONet pressure management system) = 38% of bursts
reduced in trial DMA (claimed). We have assumed that 75% effective deployment
can be achieved in AMP7 (due to scale of asset base) We have assumed that 20%
of discolouration incidents are caused by interruptions/bursts this equates to a 5.7%
reduction by the end of AMP7 (in addition to the 5% base improvement).
Welsh Water (deployment of optiMiser) = 10-12% reduction in bursts and interruption
(12% reduction to the end of AMP7 is assumed). Scaling this to the 20% of
discolouration incidents caused by interruptions/bursts equates to a 2.4% reduction is
anticipated by the end of AMP7 (in addition to the 2% base improvement).
Wessex Water (deployment of optiMiser) = 10-12% reduction in bursts and
interruption (12% reduction to the end of AMP7 is assumed). Scaling this to the 20%
41
See Section 3 for technology commentary
42
SWS Mains Flushing Report (2017) – 20% of discolouration contacts can be directly attributed to incidents .
15 TA 11.1 – Water AMP7 Comparaitve Industry Performance
Assessment Technical Annexof discolouration incidents caused by interruptions/bursts equates to a 2.4%
reduction by the end of AMP7 (in addition to the 13% base improvement).
SES are deploying smart networks in the form of additional flow/pressure sensors
with predictive analysis with an expected 5% reduction in bursts and interruptions
(Scaling this to the 20% of discolouration incidents caused by interruptions/bursts
equates to a 1% reduction by the end AMP7).
Affinity Water have deployed extensive hydro-acoustic logging which has the
potential to reduce bursts (through predictive/lead indicators) by 10% in bursts and
interruptions (Scaling this to the 20% of discolouration incidents caused by
interruptions/bursts equates to a 2% reduction by the end AMP7).
Current 2025
COMPANY Ranking 2024-25 Ranking Change
Portsmouth 1 0.25 1 0
Sutton & East Surrey 3 0.29 2 1
Thames 2 0.30 3 -1
Southern 9 0.46 4 5
Affinity 5 0.49 5 0
Essex & Suffolk 4 0.58 6 -2
Bournemouth 6 0.60 7 -1
Anglian 7 0.80 8 -1
Bristol 11 0.83 9 2
Wessex 8 0.84 10 -2
Source: PR19 Data Table App1 and AMP7 Industry Performance Assessment
Figure 12 - Predicted Industry Top 10 for Appearance (2025)
Based on this analysis we predict we will be 4th in the industry by 2024/25 and in Q1 (see
Figure 12).
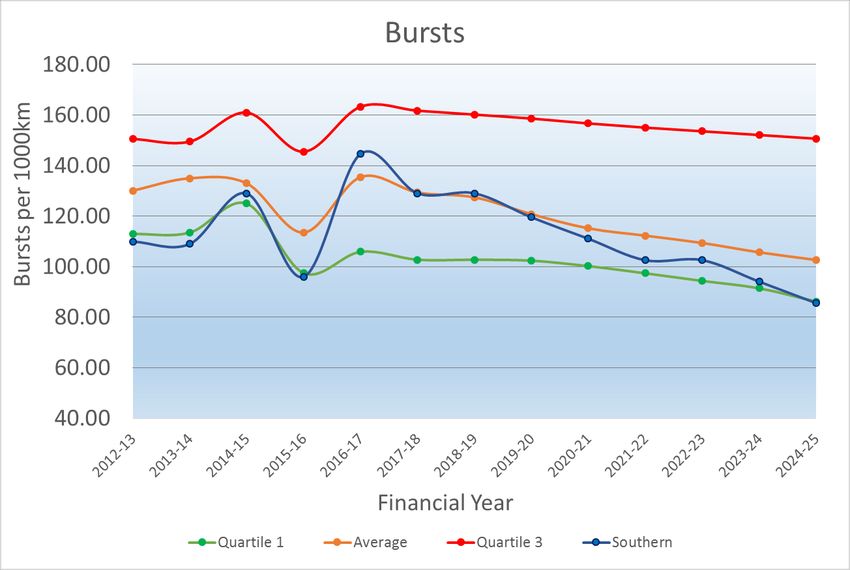
Taste and Odour
The taste and odour metric has a substantial amount of historical data with trends being
fairly linear for each company since 2013/14. Therefore, to assess potential performance a
simple linear average rate of change has been applied with no minimum levels of
improvement prescribed (all are above 5%).43
43
Analysis undertaken as a simple regression analysis in wholesale benefits workbook.
16 TA 11.1 – Water AMP7 Comparaitve Industry Performance
Assessment Technical AnnexFigure 13 - Taste and Odour prediction to 2025.
COMPANY Current Ranking 2024-25 2025 Ranking Change
Sutton & East Surrey 1 0.10 1 0
Essex & Suffolk 2 0.11 2 0
Thames 3 0.17 3 0
Southern 5 0.21 4 1
Affinity 7 0.25 5 2
Portsmouth 4 0.26 6 -2
South West 17 0.27 7 10
Bournemouth 6 0.28 8 -2
United Utilities 9 0.30 9 0
Yorkshire 14 0.30 10 4
Figure 14: Predicted Industry Rankings for Taste & Odour (2025).
Based on this analysis we predict we will be 4th in the industry by 2024/25 and in Q1 (see
figure 14).
17 TA 11.1 – Water AMP7 Comparaitve Industry Performance
Assessment Technical AnnexYou can also read