The Global Games Market: Trends, Market Data and Opportunities - PeterWarman - Newzoo
←
→
Page content transcription
If your browser does not render page correctly, please read the page content below
The Global Games Market:
              Trends, Market Data and
              Opportunities
PeterWarman    Peter Warman | CEO & Co-Founder | Newzoo
               10 September 2015

          © 2014 Newzoo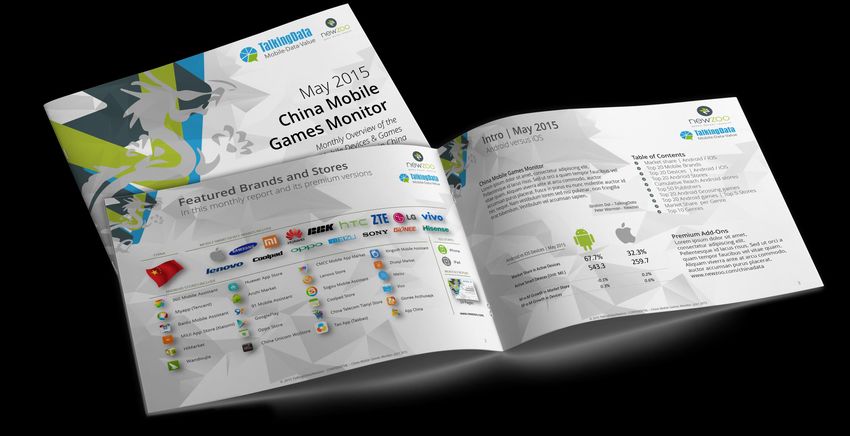
The Global Games Market:
              Trends, Market Data and
              Opportunities
PeterWarman   Peter Warman | CEO & Co-Founder | Newzoo
The Global Games Market:
Trends, Market Data and
Opportunities
Peter Warman | CEO & Co-Founder | Newzoo

What’s Special?                  What’s Special?
                       Prize Pool    $16M Was Crowd
$1.2M Per Player is
   the same as the     $18M          Funded by $2.50
   2014 World Cup                    of every $10.00
    3rd Place Prize                  donation, making
           Money.     Winning Team   Valve $54M
                        $6M
   New Direct Esports-Related Revenue Streams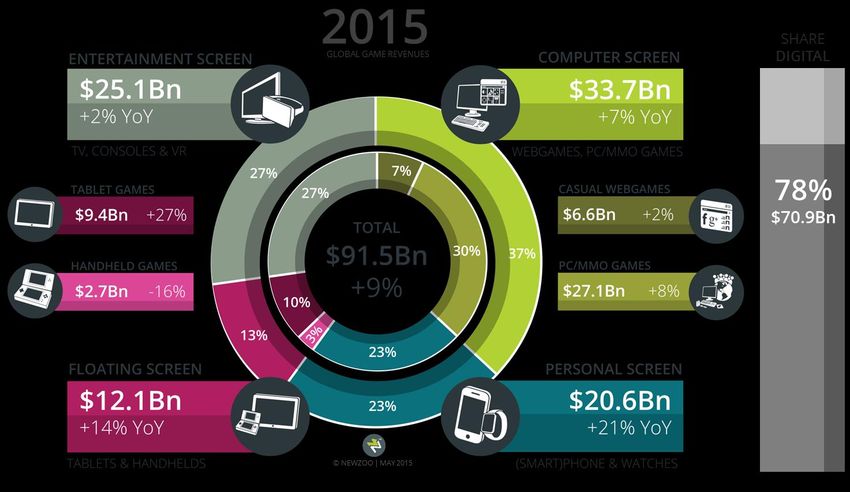
NEW CONSUMERS    NEW RULES    NEW METRICS
ARE PRODUCERS   FOR SUCCESS     NEEDED?

TAKE A STEP BACK FROM THE BIG DATA ANALYTICS SOUP NOW AND AGAIN……
NEWWHO?
                                                                             THESE COMPANIES CURRENTLY SUBSCRIBE TO NEWZOO’S SERVICES

                  Newzoo. The Experts On All Things Games.
   Newzoo is an innovative global market research firm with a
primary focus on games. We provide our clients with a mix of
 consumer research, transactional data and financial analysis
  across all continents, screens and business models. We aim
     to be ahead the curve when it comes to global and local
 trends and always put hard data into a broader perspective.
  MARKET TRENDS | CONSUMER INSIGHTS | DATA MODELING | PREDICTIVE ANALYTICS

           SAN FRANCISCO              AMSTERDAM                  SHANGHAI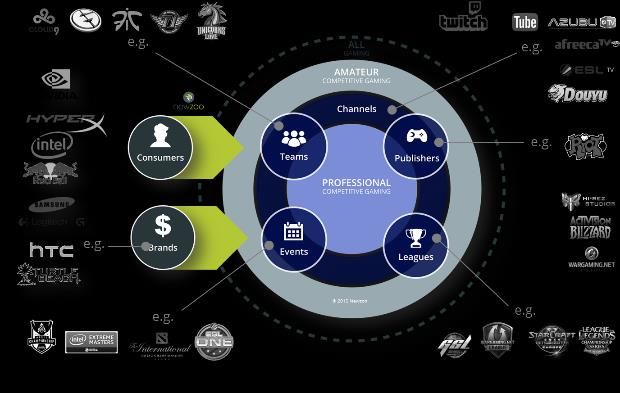
MOBILE MARKET INTELLIGENCE
             BY NEWZOO & TALKINGDATA
 HISTORIC   MARKET    MARKET    CONSUMER    PLATFORM     GAME/APP   PREDICTIVE
TRENDING    TRENDS    SIZING     INSIGHTS     DATA        METRICS   ANALYTICS

                              JOINT AMBITION
                     the full suite, on a global scale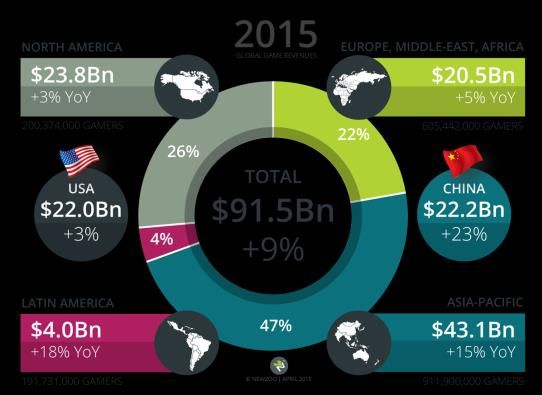
MODELING & QUANTIFYING TRENDS
        Esports Economy Growth
          TAKEN FROM NEWZOO’S 2015
       GLOBAL GROWTH OF ESPORTS REPORT
ESPORT ECONOMY MATURING
                GLOBAL NUMBER OF CONSUMER ENGAGED BY ESPORTS | 2015 & GROWTH TOWARDS 2017
                                                                                            © 2015 Newzoo | Source: Global Growth of Esports Report Premium

                                                                     Revenues
                                                                     2015 | Esports| Global, NAM , APAC

                                                                                     37%    GLOBAL                      34%
                                                                                            $252M
                                                                                            +30% YoY
                                                                         NAM                                                                           APAC
                                                                      $93.2M                                                                  $85.2M
                                                                       +32% YoY                29%                                                +28% YoY

© 2015 Newzoo
TOWARDS A $1BN ESPORTS ECONOMY
REVENUES PER ESPORTS FAN COMPARED TO THOSE OF SPORTS SHOWS POTENTIAL
© 2015 Newzoo | Source: Global Growth of Esports Report Premium
2014 Revenues/Fan Esports Growth Scenarios
Global Revenues Divided by Fans Based On Annual Revenue per Enthusiast
All $3.0Bn
Sports Alternative
$56 Optimistic TOTAL ESPORTS
REVENUES $15
Scenario
Individual
$1.1Bn
Sports $1Bn $7 $5
$20 Report AVERAGE
REVENUE PER
Scenario ENTHUSIAST
$3
$3 $1.0Bn
© 2015 Newzoo / Repucom
$2
$2 $0.5Bn
Esports
© 2015 Newzoo / Repucom
$2 2012 2013 2014 2015 2016 2017 2018 2019 2020 2021
CONFIDENTIAL | LIMELIGHT BREAKFAST AUGUST 6TH 2015A MACRO VIEW Monitoring Global Growth TAKEN FROM NEWZOO’S 2015 GLOBAL GAMES MARKET REPORT
CHINA AND THE US NECK-AND-NECK
                2015 GAME REVENUES PER REGION   2015 GAME REVENUES PER SCREEN / SEGMENT

© 2015 Newzoo
TOP COUNTRIES BY MOBILE REVENUE 2015
Rank Country Revenues
1 China $6,500,940,064 11 Russia $336,402,000
2 Japan $6,183,574,320 12 Brazil $318,936,912
3 USA $6,015,517,552 13 Mexico $298,498,290
4 South Korea $1,849,657,577 14 Italy $298,265,226
5 United Kingdom $1,008,778,581 15 Spain $228,657,173
6 Germany $819,296,319 16 India $227,456,546
7 France $519,746,699 17 Turkey $205,203,435
8 Australia $517,988,650 18 Thailand $172,011,071
9 Canada $507,126,131 19 Indonesia $167,899,403
10 Taiwan $412,829,571 20 Hong Kong $160,117,567
Top 3 Fastest Growing Countries: India Indonesia Philippines
+75% CAGR +72% CAGR +63% CAGR
Source: Newzoo Global Games Market Report 2015THE STANDARD FOR GAMES MARKET SIZING
Newzoo’s Global Games Market ReportSPOTTING THE SPENDERS
Free Riders versus Big Spenders
TAKEN FROM NEWZOO’S 2015
COUNTRY CONSUMER INSIGHTSDOES TIME SPEND DEFINE A POWER USER?
MOBILE GAME SPENDERS AND NON-SPENDERS VS TIME SPEND
© 2014 Newzoo | Source: Newzoo Data Explorer
Time Spend Clearly
Correlates with Share of
TIME SPEND
All Share That Spenders. Still There Are
4.7M
Mobile Spends Non-
Gamers Money Spenders Spenders
ALL 119.9M 43.2% 51.9M 68.0M
< 3HRS / WEEK 76.9M 36.0% 27.7M 49.2M
3 – 10 HRS / WEEK 31.4M 54.8% 17.2M 14.2M Free Riders That Play A Lot
> 10 HRS / WEEK 11.7M 59.8% 7.0M 4.7M
But Never Spend
SINGLE COUNTRY SCOPE: US
4.7M “Free Riders”
A Potential Marketing Target Group?
© 2015 Newzoo CONFIDENTIAL | GLOBAL TOP ROUND EVENT 2015DOES MONEY SPEND DEFINE A POWER USER?
LEVEL OF MOBILE GAME SPENDING VS TIME SPEND
In the US, There Are
4.2M
© 2014 Newzoo | Source: Newzoo Data Explorer
All Minor Average Big
Spenders Spenders Spenders Spenders
MONEY SPEND
ALL 51.9M 31.2M 16.4M 4.2M Big Spenders That Spend
< 3HRS / WEEK 27.7M 20.9M 5.6M 1.2M A Lot of Money But Not
3 – 10 HRS / WEEK 17.2M 8.5M 7.8M 0.8M All Spend A Lot Of Time.
> 10 HRS / WEEK 7.0M 1.9M 2.9M 2.2M
SINGLE COUNTRY SCOPE: US
4.2M “Big Spenders”
The Prime Sales Target Group?
© 2015 Newzoo CONFIDENTIAL | GLOBAL TOP ROUND EVENT 2015DOES MONEY SPEND DEFINE A POWER USER?
LEVEL OF MOBILE GAME SPENDING VS TIME SPEND
© 2014 Newzoo | Source: Newzoo Data Explorer
The Big Spenders, 3.5%
of All Mobile Gamers,
All Minor Average Big Generated at Least
Spenders Spenders Spenders Spenders
$1.7Bn in 2014, or
33%
MONEY SPEND
ALL 51.9M 31.2M 16.4M 4.2M
< 3HRS / WEEK 27.7M 20.9M 5.6M 1.2M
3 – 10 HRS / WEEK 17.2M 8.5M 7.8M 0.8M
> 10 HRS / WEEK 7.0M 1.9M 2.9M 2.2M
of All Revenues
SINGLE COUNTRY SCOPE: US
4.2M “Big Spenders”
The Prime Sales Target Group?
© 2015 Newzoo CONFIDENTIAL | GLOBAL TOP ROUND EVENT 2015WHO ARE THESE POWER USERS?
TIME VERSUS MONEY SPEND ANALYSIS OF MOBILE GAMERS IN THE US
© 2014 Newzoo | Source: Newzoo Data Explorer
Of US Big Spenders, A
Dominant
30%
Free Riders Big Spenders
FEMALE MALE FEMALE MALE
65% 35% 38% 62%
MALE 21-35 MALE 21-35
12% 30% Is Male Between 21 and 35
4.7M 4.2M
(Typical Game Enthusiasts) vs
12% for the Free Riders.
SINGLE COUNTRY SCOPE: US
© 2015 Newzoo CONFIDENTIAL | GLOBAL TOP ROUND EVENT 2015THE BIG SPENDER IS A FAMILY MAN
Of All Mobile Big
HOME SITUATION: FREE RIDING VERSUS BIG SPENDING POWER USERS
© 2014 Newzoo | Source: Newzoo Data Explorer
Free Riders Big Spenders
Spenders in the US,
52%
NON-FAMILY FAMILY NON-FAMILY FAMILY
43% 57% 33% 67%
PARENTS PARENTS
34% 52%
4.7M 4.2M Have Children at Home
versus 34% for Free
Riders.
SINGLE COUNTRY SCOPE: US
© 2015 Newzoo CONFIDENTIAL | GLOBAL TOP ROUND EVENT 2015THE BIG SPENDER HAS A FULL-TIME JOB
Of All Mobile Big
FREE RIDING VERSUS BIG SPENDING POWER USERS
© 2014 Newzoo | Source: Newzoo Data Explorer
Free Riders Big Spenders
Spenders in the US,
61%
NON-WORKING WORKING NON-WORKING WORKING
60% 40% 29% 71%
FULLTIME JOB FULLTIME JOB
26% 61%
4.7M 4.2M Have a Full-Time Job
versus 26% for Free
Riders
SINGLE COUNTRY SCOPE: US
© 2015 Newzoo CONFIDENTIAL | GLOBAL TOP ROUND EVENT 2015THE BIG SPENDER SPENDS ON ALL SCREENS
Of All Mobile Big
FREE RIDING VERSUS BIG SPENDING POWER USERS
© 2014 Newzoo | Source: Newzoo Data Explorer
Spenders in the US,
73%
TV (CONSOLE) PC / WEB
BIG SPENDER BIG SPENDER
74% 73%
Also is a Big Spender on
PC Gaming. 74% Also on
Consoles. Total Wallet
Could Be $4bn.
MOBILE
BIG SPENDER
4.2M SINGLE COUNTRY SCOPE: US
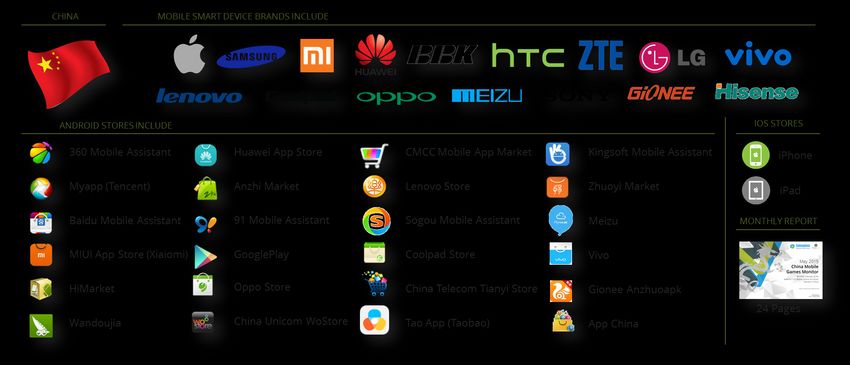
© 2015 NewzooTRACKING MOBILE IN CHINA
Monitoring the Diverse Ecosystem
TAKEN FROM NEWZOO’S MONTHLY
CHINA MOBILE GAMES MONITORPLATFORM TRACKING DATA
IOS GAME REVENUES TRACKING OF 10M YOUTUBE & TWITCH IOS & GOOGLEPLAY
IN 50 COUNTRIES PC GAMERS VIEWING DATA DOWNLOADS
DATA ON A BILLION+ SMART DEVICES IN CHINATHE CHINESE MOBILE ECOSYTEM
Apple Is China’s #1 Technology Brand by 2014 Revenues
Historic performance of Western company in China revealed
                  2014 CALENDAR YEAR REVENUES AND PROFIT IN CHINA FOR KEY TECH BRANDS                                                          KEY FACTS

                                                                                               © 2015

                                                                                                          year-on-year                                         year-on-year
                                                                                              Newzoo

                                                                                                        Revenue Growth                                        Profit Growth
                                                                                                             +32.3%                                           +54.1%
                                                            2014 Revenues in China
                                                                      Full Calendar Year

                                                                2014 Profit in China
                                                                      Full Calendar Year
                                                                                                                  for Apple                                         for Apple
                                                                                                                   in China                                          in China

                                                                                                                                                   NOTES

                                                                                                        All numbers related to calendar year 2014. Revenues and profits of companies with a different fiscal
                                                                                                        year have been calculated based on quarterly reports to ensure comparability.
                                                                                                        Apple numbers are based on reporting segment Greater China (incl. HongKong and Taiwan).
                                                                                                        Samsung numbers are based on reporting on segment “China”.
                                                                                                        Huawei numbers are based on articles in Forbes on March 31, 2015 and Wall Street Journal on
                                                                                                        January 13, 2015. Operating profit is assumed to be equal across all regions.
                                                                                                        Lenovo numbers are based on reporting segment “China”.
                                                                                                        Tencent numbers are based on reporting segment Mainland China. Operating profit is assumed to
                                                                                                        be equal across all regions.
                                                                                                        Xiaomi numbers are based on article in Wall Street Journal on November 5, 2014 and are total
                                                                                                        company revenues and operating profits (across all regions as segmentation is not public).
                                                                                                        Baidu numbers are total revenues and operating profits (across all regions as segmentation is not
                                                                                                        public).
                                                                                                        Except for Lenovo, USD amounts are calculated using exchange rates as per 31 December 2014.

Source: Newzoo’s Global Games Market Report Premium & Free China Report Update | April 2015                                                                                         www.newzoo.com
ANDROID STORE PERFORMANCE
REACH OF ANDROID STORES IN CHINA | JUNE 2015
App Store App Store Installs MAU MAU
Ranking Change # of Installs (M) Activity Index
(English) (Chinese) (Growth) (M) (Growth)
1 +1 360 Mobile Assistant 360手机助手 142.0 2.1% 112.1 3.4% 79%
2 -1 Myapp (Tencent) 腾讯应用宝 138.1 -1.8% 101.0 -3.6% 73%
3 +1 MIUI app store (Xiaomi) 小米应用商店
4 -1 Baidu Mobile Assistant 百度手机助手 CONFIDENTIAL
5 +2 Huawei App Store 华为应用市场 This data is part of the Newzoo/TalkingData monthly China
Mobile Games Monitor. More info:
6 -1 HiMarket 安卓市场 www.newzoo.com/chinamobile
7 +3 Vivo 步步高应用商店
8 - Google Play 谷歌
9 +2 Oppo Store 可可软件商店
10 -4 Wandoujia 豌豆荚
11 -2 Anzhi Market 安智市场
12 +3 Meizu 魅族应用商店
13 -1 91 Mobile Assistant 91助手
14 - China Unicom WoStore 中国联通沃商店
15 +1 Lenovo Store 联想乐商店
16 +1 Coolpad Store 宇龙酷派应用商店
17 +1 Sogou Mobile Assistant 搜狗手机助手
18 +4 Zhuoyi Market 卓易市场
19 +4 Gionee Anzhuoapk 金立应用商店
20 -1 China Telecom Tianyi Store 中国电信天翼空间
© 2015 NewzooTop iOS Games| July 2015 | China
powered by
By Revenues powered by By Downloads powered by
RANK GAME TITLE PUBLISHER CHANGE RANK GAME TITLE PUBLISHER CHANGE
Netease - 1 Xia Zhang new
has 2 titles in the
花千骨 正版手游
1 梦幻西游-2015国民手游 人人都玩 不玩才怪
(The Journey of Flower)
(Fantasy Westward Journey)
2 全民突击-全球第一真人实时对战FPS枪战手
游
(WeFire)
Tencent - 2 开心消消乐
(Anipop)
Happy Elements 3
Top 10
3 Happy Elements 3 3 植物大战僵尸2
(Plants vs. Zombies 2: It’s About Time) PopCap 4 games by revenues
开心消消乐
(Anipop) 欢乐斗地主(QQ游戏官方版)
4 Hero Network 1 4 (Happy Lord QQ Official) Tencent -
神武
(Shen Wu) 拳皇98终极之战OL
5 Tencent 3 5 (The King of Fighters 98) Tencent new
天天爱消除
(Craz3 Match) 狂野飙车8:极速凌云
6 Tencent 2 6 Gameloft
全民飞机大战
(Asphalt 8: Airborne) 7
(WeFly)
7
部落冲突
Supercell 6
7
九龙战-腾讯第一动作竞技手游
(Kowloon War) Tencent new The Journey of
(Clash of Clans)
Tencent 1 Flower debuts as
8 猫和老鼠官方手游-开放新关卡,登录送火腿
Netease 7
#1
欢乐斗地主(QQ游戏官方版) 8 (Tom and Jerry)
(Happy Lord QQ Official) 全民突击-全球第一真人实时对战FPS枪战手
9 Youzu new 7
少年三国志(7天送赵云,两周送红将!) 9 游 Tencent
(Junior Three Kingdoms)
(WeFire)
downloaded game
10 Supercell - 漫威 : 未来之战
1
海岛奇兵 10 (MARVEL Future Fight) Netmarble
(Boom Beach)
Find the Top 20 iOS Games every month at:
http://www.newzoo.com/free/rankings/iOSrankings
www.newzoo.comGAME METRICS
Finding An Alliance of Partners & Clients
WILLING AND ABLE TO SHARE DATA
AND DEVELOP NEW METRICSGAME METRICS & PARTNERS
PAYMENT (CONVERSION) RATE PER GENRE FOR IOS AND ANDROID GAMES IN CHINA | JUNE 2015
Casual Puzzle Role play Action Strategy Simulation Casino Cards
Android
休闲游戏 智力游戏 角色扮演 动作游戏 策略游戏 模拟类 棋牌游戏 卡牌游戏
Payment Rate 2.7% 1.9% CONFIDENTIAL
This data is part of the Newzoo/TalkingData monthly China
Average sessions per user 3.53 4.22
Mobile Games Monitor. More info:
www.newzoo.com/chinamobile
Casual Puzzle Role play Action Strategy Simulation Casino Cards
iOS
休闲游戏 智力游戏 角色扮演 动作游戏 策略游戏 模拟类 棋牌游戏 卡牌游戏
Payment Rate 3.2% 3.2%
Average sessions per user 3.73 3.79
© 2015 NewzooGAME METRICS IN ACTION
EXAMPLES HOW GAME METRIC ANALYSIS IMPROVE MONETIZATION | AMAZON ANALYSIS OF GOOD & LESS {ERFORMING GAMES
Not too much variety in price Ease of purchase at time of need Help people to spend credits
Games that providing a post-
purchasing tutorial generated
65% more repeat orders than
the market average.
source: Amazon keynote at Casual Connect SFTAKE A STEP BACK FROM THE BIG DATA ANALYTICS SOUP NOW AND AGAIN……
MOBILE MARKET INTELLIGENCE
                BY NEWZOO & TALKINGDATA
 HISTORIC   MARKET    MARKET    CONSUMER    PLATFORM     GAME/APP   PREDICTIVE
TRENDING    TRENDS    SIZING     INSIGHTS     DATA        METRICS   ANALYTICS

                              JOINT AMBITION
                     the full suite, on a global scale
The Global Games Market:
Trends, Market Data and
Opportunities
PeterWarman Peter Warman | CEO & Co-Founder | NewzooYou can also read