Valid Statistical Analysis at John Deere and Use of the R Programming Language - Derek Hoffman Nov-8-2012
←
→
Page content transcription
If your browser does not render page correctly, please read the page content below
Valid Statistical Analysis at John
    Deere and Use of the R
    Programming Language
            Derek Hoffman
             Nov-8-2012
A bit about your speaker…

 • BS in Statistics and
    Material Science
    @ Winona State
        University
 • Masters in Statistics
    @ Iowa State
        University
 • 5 Years @ John Deere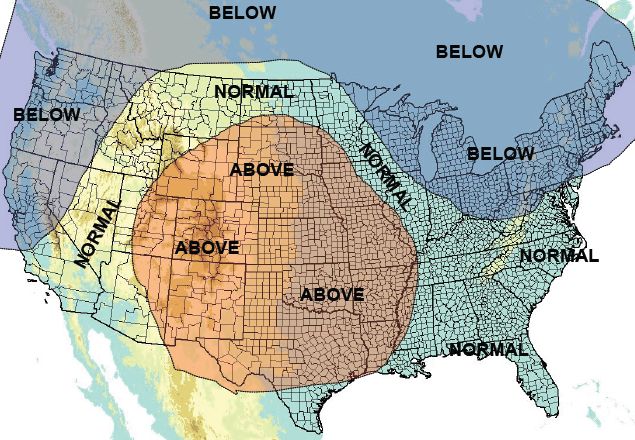
Forecasting Group in 2012

 •   Improvements due to the science of forecasting
 •   Explosion in value and statistician hiring
 •   Increase in problem solving flexibility due to use of R
 •   Huge company saving with dropping flop forecasting software
• Revenue of roughly 35
  billion, 8.7% profit
• Has been a Fortune 500
  company for the last 56
  years, roughly 94th in
  rank.
• Employs about 50,000
  people world wide –
  roughly 5,000 of them in
  the Moline headquarters.
Deere & Company – 3 parts

 • Agriculture ~70%

                                 • Turf~15%

                • Construction
                  ~15%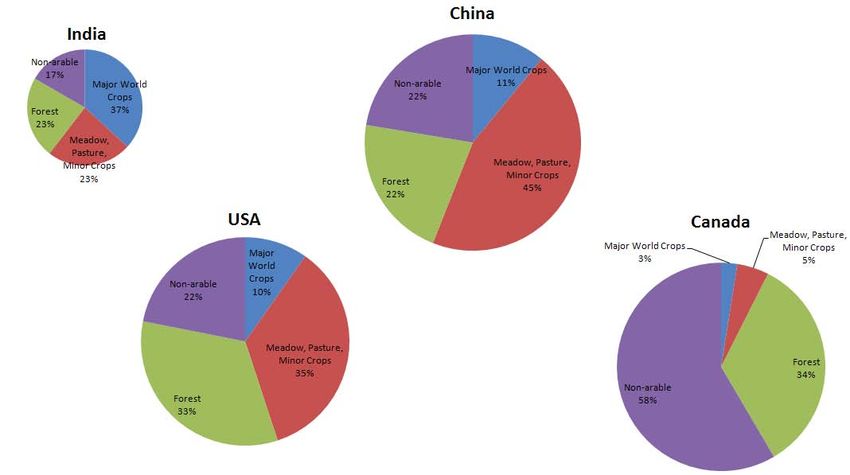
Why does Deere hire forecasters?

 • Availability needs to match demand OR you
   lose market share
 • Inventory needs to stay low OR you pay lots
   in taxes and storage costs
 • New factories need to be built at the right
   size and time OR you made a multi million
   dollar mistake.
 • Work force needs to be hired/cut depending
   on production plans OR you lose tons
   training and severance.

My group’s reach at John Deere

       CEO,                        Flexibility of
    Presidents,                     Inventory
    Financials                     Next Month

                  Forecasts

                                 Factory Shifts
   New Markets,
                                      and
   10 Years Out
                                  Production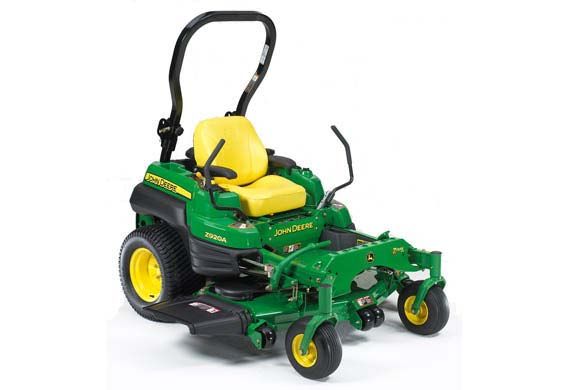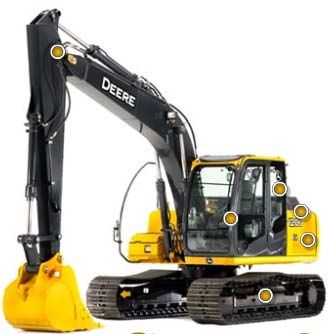
Why do statisticians love R?

 • Common statistical methods are available as
   packages (advantage over C++)
 • Large support group of users worldwide
 • Credibility due to submission standards and
   university usage.
 • Often the program of choice during education
 • Easy to send results to another person (even
   if just text files for data and code)
Why does Deere love R?

• The cost is right
• Open source – no black box mysteries, no
  propriety lock downs
• Easy to share across the business
• Relatively easy to learn
• Often works better or faster than microsoft
  products for data and analysis
• Infinitely customizable to your problem and
  your products – vertical integration
Case Studies at John Deere

•   Short Term Demand Forecasting
•   Crop Forecasting
•   Long Term Demand Forecasting
•   Parts Decision Tree (APO)
•   Order Line Up
•   Data Coordinator
Short Term Demand Forecasting

                      Marketing   Potential Good:
                      Forecast
        Factory                   •Multiple view points
        Forecast
                                  •Buy-in from all players
                                  •Disciplined in forecast creation
                   Estimate
                    Group
                   Forecast       Potential Bad:
                                  •Group-think
                                  •Pressures other than accuracy
                                  •Poor information digestion

       Composite Forecast
Bad Forecasting Philosophies
Executive Override Gut Feel / Art Blackbox Forecasts
News,
News,
Experience, Last History
Experience YR’s #’s
Experience + Math Comparisons,
Feelings on that Finical Forecasting,
Day + Outside Experience, ?
pressures Outside forecasts
Forecasts (NO
“Forecasts” and
estimates of
directives and Forecasts
accuracy, NO
goals
interpretation)Forecasting Philosophies
Statistical Models Assumption Models Economic Models
Historical Data Assumptions Data, Assumptions,
(user generated News, ???,
(known because is in the
assumptions about the
past or current)
future)
Outside Forecasts
Data + Data + Data + Economics
Math/Statistics Math/Statistics + ???
as calculated by a as calculated by a as created by a
trained statistician trained statistician trained economist
Forecasts and Forecasts and Forecasts,
MEANINGFUL Analysis of Outside
plus/minus Forecast Error Forecasts,
intervals Contributions by Current Economic
(flexibility and bad
forecast detection)
Assumptions NewsUse of Data-Driven Analysis
Analysis done in
my group using R
and company data.Case Studies at John Deere • Short Term Demand Forecasting • Crop Forecasting • Long Term Demand Forecasting • Parts Decision Tree (APO) • Order Line Up • Data Coordinator
Crop Yields Forecasting
Relative Land Area and Use
Circle = Total LandAcres in Major World Crops
Circle = Total Crop LandCrop Yields Forecasting
Crop Yields Forecasting
History 2nd Year OUT
1 Year OUT 3rd Year OUT
The whole time, calculating the valid forecast error and influences.
A large computational task, heavily using programs written in R.Changes in Crop Splits
Corn Yields
Case Studies at John Deere

•   Short Term Demand Forecasting
•   Crop Forecasting
•   Long Term Demand Forecasting
•   Parts Decision Tree (APO)
•   Order Line Up
•   Data Coordinator
The Wrong way – Growth f(t) • The problem really is that we are looking at a correlation with time, not a causation. Also we will always be extrapolating (because the future value of time is outside the our historical data set).
What are Likely Causes?
• Crop Yields
• Planted Acres
• Crop Prices
• Population
• Gross Domestic Product
• Farm Size
• Government
• Mechanization Level of Farming
• Crop Choices (Corn damages combines faster than
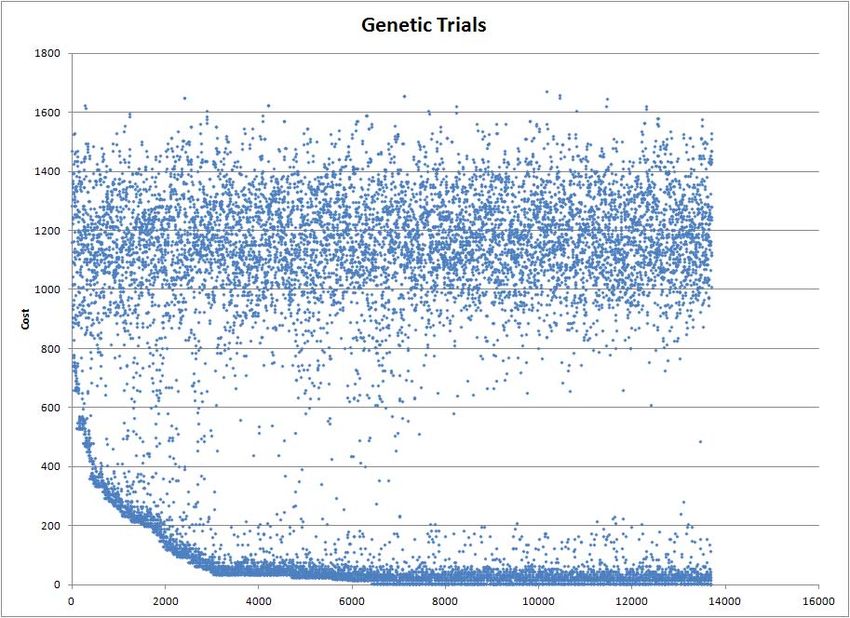
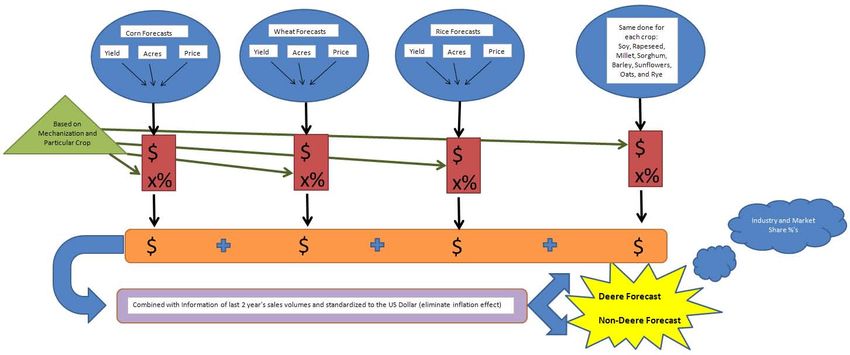
wheat.)Example of Calculations
The whole time, calculating the valid forecast error and influences.
A large computational task, heavily using programs written in R.Case Studies at John Deere • Short Term Demand Forecasting • Crop Forecasting • Long Term Demand Forecasting • Parts Decision Tree (APO) • Order Line Up • Data Coordinator
Parts Forecasting
• Tons of parts, need direction
how to best forecast with
SAP.Parts Forecasting – Trilingual?
Case Studies at John Deere

•   Short Term Demand Forecasting
•   Crop Forecasting
•   Long Term Demand Forecasting
•   Parts Decision Tree (APO)
•   Order Line Up
•   Data Coordinator
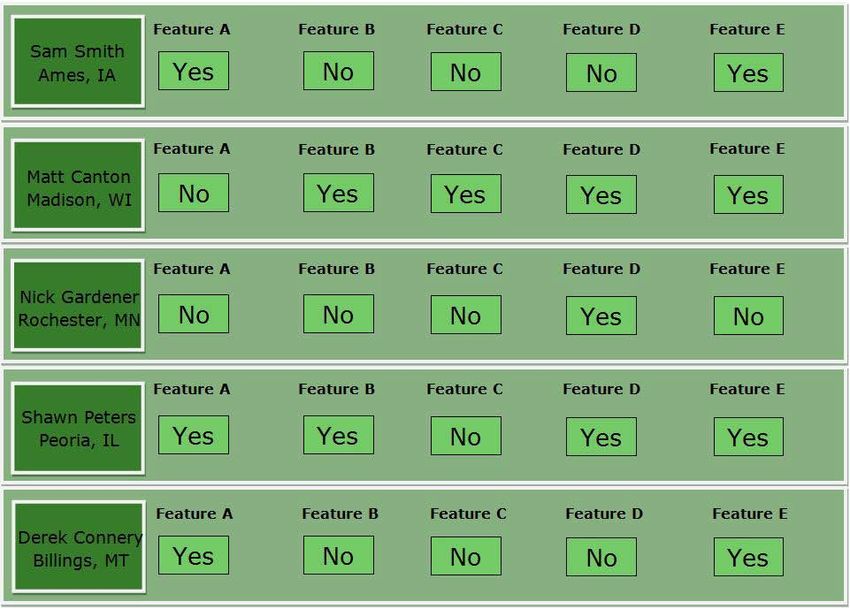
Order Scheduling
Order Scheduling

 Restraint on
 Feature A:
 At most 2
 per 4 in a
 row.

 We’re OK!
Order Scheduling

 Restraint on
 Feature A:
 At most 2
 per 4 in a
 row.

 We’re OK!
Order Scheduling

 Restraint on
 Feature B:
 At most 1
 per 3 in a
 row.

 We’re OK!
Order Scheduling

 Restraint on
 Feature A:
 At most 1
 per 3 in a
 row.

 We’re got a
 problem!

 Have to
 move Matt
 or Shawn’s
 tractor to
 another spot
 and recheck
 it all!
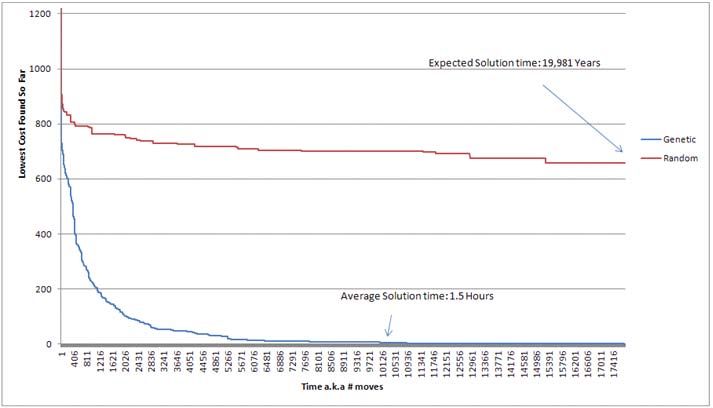
Harvester Lineup – Random Guess
Harvester Lineup – Program Results
Order Scheduling – Time
Order Scheduling = $$$

 •   Old Process                 • Derek’s Process
     – Done manually by             – Automates the process
       hand                         – Duration: 1.5-2 hours
     – Weekly                       – Human time:15 mins
     – Duration: 8 Hours
     – Not necessarily perfect      – Saves about 8 hours
                                      per week
                                    – Saves ~$12K per year,
                                      per product
                                      implementation
Case Studies at John Deere • Short Term Demand Forecasting • Crop Forecasting • Long Term Demand Forecasting • Parts Decision Tree (APO) • Order Line Up • Data Coordinator
Data Coordinator Uses
                                           Scheduled
                                             Tasks
  Multiples
    Data        Multiple
 sources and     ODBC                                  DB2
                                           Batch
  Data types   Connections                 File
                                           execution
    DB2
                               Single R                 Export
                             source Code               Channels
    SQL

    DB2

   Oracle
A forecast of “Analytics”
• A short history of “cool topics”
• The future of forecasters
• The coming data flood and analytics boom
increase in scalpels ≠ increase in surgeonsThe cool word of the year – Dot-com
The cool word of the year - Radiation
The cool word of the year – Big Data

                       How can we grow responsibly as data
                       scientists and statisticians?
Signs you are in the hype • Everyone claims it will change the world • It’s taught in business schools • Features on covers of general magazines • TONS of snake-oil salesmen • Legitimate ease in access to the new thing
Cautionary tale:

                   • Thousands spent on a
                     weather “forecast”
                   • Ridiculous accuracy
                     measures
                   • Business users don’t
                     know the short falls till
                     it’s too late
Growing Need of Forecasting Professionals • A need for educated gate keepers to weed bad analysis from good. • More people are needed to practice forecasting as a profession – or the whole industry will suffer. • More data, more ease, more computing needed, with greater need for responsible use.
Statistics and R at John Deere

 • John Deere is among the best in large
   manufactures in implementing good
   forecasting methods to demand planning
 • There are still huge areas to grow – no
   where near the data usage of companies like
   Amazon or Wal-Mart
 • The challenge is to increase usage and
   access while maintaining a good internal and
   external reputation
You can also read