Learning, Data and Methodological Approaches - Qualitative, Quantitative or Mixed Methods Dilemmas? - Qualitative ...
←
→
Page content transcription
If your browser does not render page correctly, please read the page content below
7th International Doctoral Consortium on Informatics
        Engineering Education Research, Druskininkai, Lithuania, 2016

  Learning, Data and Methodological
Approaches - Qualitative, Quantitative or
      Mixed Methods Dilemmas?
                                      Don Passey
                     Professor of Technology Enhanced Learning
                 Director, Centre for Technology Enhanced Learning
  Director, Doctoral Programme for e-Research and Technology Enhanced Learning
                        Department of Educational Research
                                 Lancaster University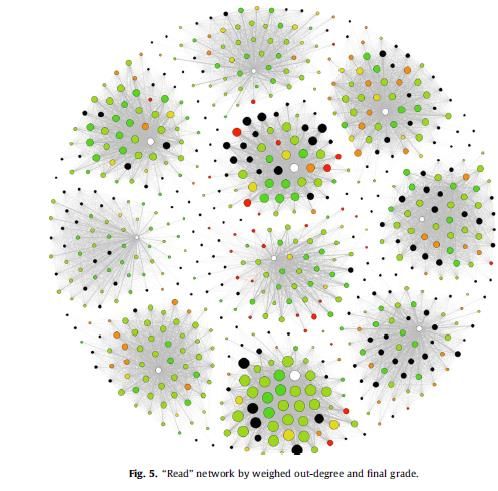
Summary of this presentation

•   A bit of background – my involvement with data and learning
•   Data analysis and learning
•   Methodological approaches and research design
•   Aims and intentions
•   Data and stakeholders
•   Example studies
•   Data about extents of reported research approaches
•   Conclusion

Data analysis and learning

• Learning can be considered as processes that can be grouped into
  three main categories (Child, 1973; Passey, 2014)
   – Internalisation – the ways we engage with ideas, concepts, knowledge
     and details from our external environment or existing internal thoughts
   – Internal cognitive processes – the ways we handle those ideas, concepts,
     knowledge and details, and use them to build on, support or review our
     existing knowledge and concepts
   – Externalisation – the ways we make our learning known to others,
     through different external routes
• So what data (or learning analytics) are needed to gain insights into
  these processes?
• Can we assume that one form of data about one of these categories
  can inform us about one or more learners, or provide insights for one
  or more users (teachers, advisors, policy makers, etc.)?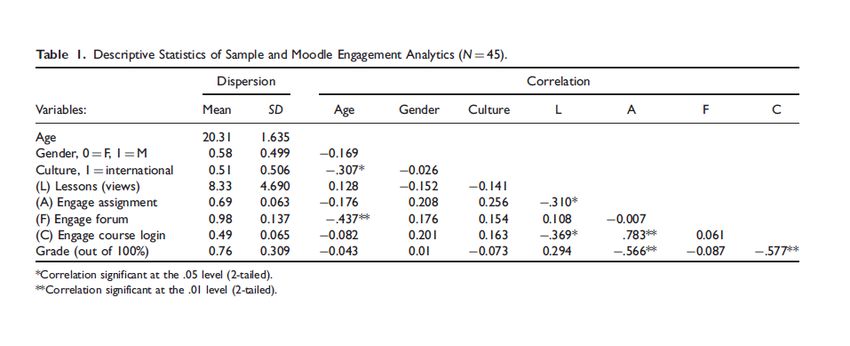
Methodological approaches

• Data and methodological approach should be intrinsically linked, and
  to the end audience of the research:
    –   Action research implies the researcher is the user
    –   Design-based research implies the developers are the users
    –   Case studies imply an organisation, or group, or individual is the user
    –   Phenomenology implies looking for variations in a group
• These approaches have little to do with whether the data are
  quantitative or qualitative, whether they are analysed in quantitative
  or qualitative ways, or presented in quantitative or qualitative ways
• The ‘what’, the ‘why’ and the ‘how’ can all be important
• ‘Extents and levels’ and ‘explanations’ may all be worthwhile
Research design • There needs to be a clear link between a study’s: – Rationale and its purpose (aims and intentions) – Prior studies and insights – Research questions – Methodological approach – Data gathering methods and tools – Data analysis – Presentation of findings – Audience • How do learning analytics fit with matters of research design?
Aims and intentions

• The aims of using data can be varied
• Some categories are:
   –   Exploring the use of data gathering tools
   –   Developing data analysis tools
   –   Providing visualisations of ideas or outcomes
   –   Providing visual interpretations of findings
   –   Providing feedback for other researchers
   –   Providing feedback to specific users, including students and
       teachers

• How do learning analytics fit with aims and intentions?
What data do stakeholders need from data or learning analytics? • Policy makers – Overviews? Options? Averages? Outliers? • Educational advisers – Gaps? Issues? Exceptions? • Head teachers or principals – Overviews? Comparisons? • Teachers – Group views? Individual views? Outliers? • Parents – Individual views? Comparisons? • Students – Individual analyses? Personalised? • Educational software developers – Successes? Averages? • Macro, meso and micro levels (Buckingham-Shum, 2012)
Example study 1

• “Learning analytics have been applied to study and visualize the relationship
  between student activity and performance in online-basedExample     image
                                                              university-level
  courses during the last decade
• “The authors of 11 relevant studies published in peer-reviewed scholarly
  journals all found some benefits, but they also cited many problems when
  trying to assess student learning through combinations of learning analytics,
  learning management system (LMS) activity data logs, and graded
  performance results
• “All 45 participants were undergraduate students in an upper division
  Professionalism Seminar and Human Resource Management (HRM) course
  taught by the researcher”

    Source: Strang, 2016
Example study 1 - visualisation Source: Strang, 2016
Example study 2

• “The purpose is to explore the relationships between student grade and key
  learning engagement factors using a large sample from an online
  undergraduate business course at an accredited American university
  (n = 228)
• “The final size of this sample was 228 students who were drawn from
  several sections of the same courses taught by two professors (one was the
  author), all undergraduate students in an upper division Professionalism
  Seminar and Human Resource Management (HRM) course”

   Source: Strang, 2016
Example study 2 - visualisation

Source: Strang, 2016
Example study 3

 •   Figure 4 displays nodes and edges “contained in a circular area, which is especially
     useful to analyze student and teacher active behaviors on a per classroom basis
 •   It “shows the interactions in each classroom, with the size of each node
     corresponding to the number of new messages posted by each student; except for
     classroom 10, the node with a higher number of new posts represents the
     consultant teacher
 •   It “provides useful information about how many students are weakly connected with
     the rest – i.e. which students have read few messages, or none, which could be an
     early warning sign of an at-risk student
 •   Figure 5 node colours indicate “final grade – from green to yellow, students who
     passed the continuous assessment; from orange to red students who failed to pass
     the continuous assessment; gray nodes are students who did not finish the course;
     white nodes are the consultant teachers – and node size representing weighed out-
     degree – i.e. how many posts did each student read”

Source: Hernández-García, González-González, Jiménez-Zarco and Chaparro-Peláez, 2015
Example study 3 - visualisation Source: Hernández-García, González-González, Jiménez-Zarco and Chaparro-Peláez, 2015
Data about extents of reported
research approaches
• From the Lancaster University Library One-Search online
  journal access tool, the following numbers of articles were
  found:
    Focus of the article                   Results found
    Learning analytics quantitative approaches    31
    Learning analytics qualitative approaches     36
    Learning analytics mixed methods approaches   7
    Learning analytics case studies               721
    Learning analytics design-based research      165
    Learning analytics action research            531
    Learning analytics student outcomes           686
    Learning analytics teacher support            117
    Learning analytics longitudinal studies       26
Conclusions
• Learning analytics are expanding the possibilities of methodological approach
• This does not mean there is necessarily a need to distinguish always between
quantitative and qualitative approaches; research design is more crucial as a factor
• Data visualisation is becoming increasingly important and is being enhanced in terms
of formats and user engagement
• Stakeholder needs are important if research is not to just inform other researchers,
and to meet some national ‘performance’ needs
• Data analysis and presentation should be considered as means to support discussion
prior to decision making wherever relevant (Passey, 2013)
• Many studies appear to be focused on short-term rather than longer-term findings
and their implications and interpretations
• Learning analytics appear to be focusing on social engagement and interaction as
much as on subject outcomes, grades or levels; whether correlations have any
causality is yet to be fully arguedReferences
• Buckingham-Shum, S. (2012). Learning analytics [policy brief]. Moscow, RU: United Nations
Educational, Scientific and Cultural Organization (UNESCO) Institute for Information
Technologies in Education. Retrieved from
http://iite.unesco.org/pics/publications/en/files/3214711.pdf
• Child, D. (1973) Psychology and the teacher. London: Holt, Rinehart and Winston.
• Hernández-García, Á., González-González, I., Jiménez-Zarco, A.I. and Chaparro-Peláez, J. (2015).
Applying social learning analytics to message boards in online distance learning: A case study.
Computers in Human Behavior, 47, 68-80.
• Passey, D. (2013). At the Heart of the Next Generation of Information Technology in Educational
Management: Data Driven Discussion Making. In D. Passey, A. Breiter, and A. Visscher (Eds.).
Next Generation of Information Technology in Educational Management. Springer: Heidelberg,
Germany.
• Passey, D. (2014). Inclusive Technology Enhanced Learning: Overcoming Cognitive, Physical,
Emotional and Geographic Challenges. Routledge: London.
• Strang, K.D. (2016). Do the Critical Success Factors From Learning Analytics Predict Student
Outcomes? Journal of Educational Technology Systems, 44(3), 273-299.
• Strang, K.D. (2016). Beyond engagement analytics: which online mixed-data factors predict
student learning outcomes? Education and Information Technologies. doi:10.1007/s10639-016-
9464-2Thank you for listening! Contact d.passey@lancaster.ac.uk
You can also read