Indicators of Broadband Need User Guide - BroadbandUSA
←
→
Page content transcription
If your browser does not render page correctly, please read the page content below
Indicators of Broadband Need User Guide
The Indicators of Broadband Need map was created by the United States Department of Commerce,
National Telecommunications and Information Administration (NTIA). The map brings together
several different datasets to show information on broadband availability within the United
States. Layers in this map were created using data from the U.S. Census (the American Community
Survey), Ookla Speedtest results, Measurement Lab (M-Lab) speed test results, Microsoft, the Federal
Communications Commission (FCC), the Department of Education and internal NTIA data resources.
All data is shown at one of three Census geographic levels: county, census tract, or census block.

                                      a. The application splash screen

Application Data & Layers

American Community Survey (ACS): The ACS layers shown on the map are based on the collective
results of the U.S. Census American Community Survey taken from 2015-2019, processed, and made
available via Esri Living Atlas. There are three ACS layers in the application. Two of the layers
function as indicators of broadband need. These layers are based on the Internet Connectivity portion
of the ACS. The data for these two layers gives the five-year estimates at the tract level for
responses to the ACS questions:

   •   “At the house, apartment, or mobile home do you or any member of this household have
       access to the Internet?” and
   •   “At this house, apartment or mobile home do you or any member of this household own or use
       any of the following types of computer?”

A third ACS layer showing “High Poverty Communities” appears in the Additional Layers section of the
application. This layer was built using the ACS estimates for the last 12 months of 2019 and shows
census tracts based on the percentage of residents who report living below 100% of the U.S. Census
poverty threshold. The ACS is a yearly survey conducted by the U.S. Census with information collected

                                                     1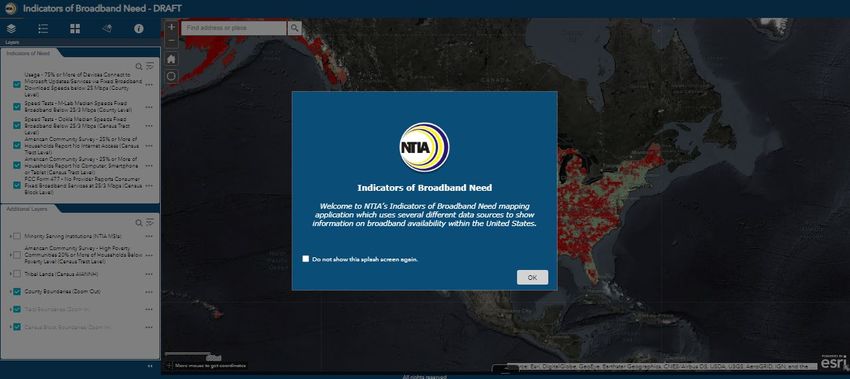
from approximately 3.5 million American households. ACS data is collected at the census block group
level and can be aggregated to higher census geographies including the census tract level seen on the
map. Census tracts without data are shown in gray. ACS Esri Living Atlas layers sourced in the map
include:

   •   ACS Internet Connectivity Variable Boundaries
   •   ACS Poverty Status Variable Boundaries

Measurement Lab (M-Lab): Data is derived from speed test values recorded by Measurement
Lab during the time period from January - June 2020. The layer shows speed test results at the
county level. Counties with collective median speed test results below 25/3 Mbps are shown in red
while counties with median results above 25/3 Mbps are shown in green. Median values for each
county were calculated using the methodology outlined here by M-Lab, which accounts for user test-
taking practices that may skew the median for a given geography. Counties where M-Lab data was not
available to the cartographer at the time of this analysis are displayed in gray on the map.

Ookla: Values shown were derived from Ookla Speedtest results run over the time period from
January - June 2020. The layer shows speed test results at the census tract level. Tracts with
collective median speed test results below 25/3 Mbps are shown in red while tracts without Ookla
results are shown in gray. Tracts with median speeds above 25/3 Mbps are shown in green. Median
values for each county were calculated using a methodology recommended by Ookla, similar to the
methodology used for M-Lab median calculations, which accounts for user test-taking practices that
may skew the median value for a given geography. A description of Ookla's use of median speed test
values can be found here.

Microsoft: The dataset combines information on county populations with an estimate of broadband
usage over multiple Microsoft services in November 2019. Every time a device using Microsoft
software receives an update or connects to a Microsoft service, Microsoft is able to estimate the
device's throughput speed based on the size of the packet sent and the time it takes to
download. Using this information, Microsoft was able to provide an estimate of the percentage of the
population using the Internet at 25 Mbps download speeds or higher in each county. Microsoft
estimates that ~157 million people in the US are not using the Internet at such speeds. The layer in
this map shows counties in red where 75% or more of users are not using the Internet at 25 Mbps
download speeds or higher, according to the Microsoft estimates (reported percentage of broadband
use below 0.25 in the dataset). Data does not include values for all counties. Areas with higher usage
percentages are shown in green, while areas without data are shown in gray. This dataset is available
free for download at this link.

FCC Form 477: This layer was created using the Jan-Jun 2020 FCC Form 477 data collection from
U.S. Internet service providers (ISPs). The layer shows areas of the U.S. where no ISP reported
consumer fixed broadband Internet services at speeds that meet the FCC's 25/3 Mbps benchmark for
fixed broadband. This layer shows services available from fixed technologies only (available satellite
services are not shown). Form 477 data is reported at the census block level, and this layer was
created by selecting all land-based census blocks (water census blocks excluded) that had no
providers reporting fixed broadband consumer offerings at the 25/3 Mbps threshold or above. Form
477 data is available for download at the FCC's website using this link.

Minority Serving Institutions (MSIs): This point layer shows the locations of institutions eligible as
Minority Serving Institutions (MSIs) under NTIA's Connecting Minority Communities (CMC) grant
program. The location of each school is taken from the NCES GIS Database for Post Secondary
Schools. The school type and its eligibility for NTIA grant programs is determined by the Department
of Education Eligibility Matrix for 2020. Schools defined as eligible or potentially eligible by the
eligibility matrix in a given category are designated as MSIs for the purposes of the CMC program. A
list of MSI abbreviations is included below:

                                                   2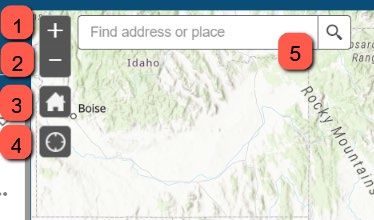
AANAPISI - Asian American and American Pacific Islander Serving Institutions

ANNH - Alaska Native and Native Hawaiian Serving Institutions

HBCU - Historically Black Colleges and Universities

HSI - Hispanic Serving Institutions

NASNTI - Native American Non-Tribal Serving Institutions

PBI - Predominantly Black Institutions

TCU - Tribal Colleges and Universities

Tribal Lands: This layer shows areas designated as American Indian, Alaska Native and Native
Hawaiian Areas (AIANNH) by the U.S. Census in 2020. This dataset is updated on an annual basis as
part of the Census TIGER program and is available for download on the program's website. Areas
shown include: Alaska Native Regional Corporations, Tribal Subdivisions, Federal American Indian
Reservations, Off-Reservation Trust Lands, State American Indian Reservations, Hawaiian Home
Lands, Alaska Native Village Statistical Areas, Oklahoma Tribal Statistical Areas, State Designated
Tribal Statistical Areas, Tribal Designated Statistical Areas, and American Indian Joint-Use Areas.

Disclaimer: The data presented is “as is,” “as available” for informational purposes. NTIA does not
warrant the accuracy, adequacy, or completeness of this information and expressly disclaims any
liability for any errors or omissions.

Map Tools
The map portion of the application contains tools for users to navigate the web map.

                     b. The Zoom In, Zoom Out, Default View, My Location and Search Bar tools

   1. Zoom In: Zooms closer into the map.
   2. Zoom Out: Zooms out away from the map.
   3. Default View: Resets the application to its default view.
   4. My Location: By allowing the application access to your system’s location, users can zoom the
      map into their current general location.
   5. Search Bar: Users can type in a location and zoom into that area by clicking on the magnifying
      glass.

                                                        3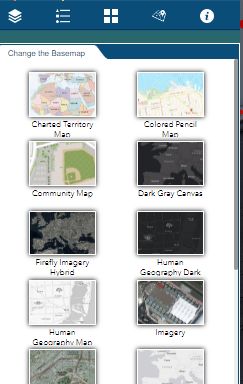
Map Tabs
The map features five main tabs: Layers, Legend, Change the Basemap, Select MSI Type, and About.

                                      c. The five main tabs of the application.

Layers
The Layers tab provides a list of the available data layers in the application. By selecting the check boxes
on the left, users can turn the associated layer on and off. To access additional options for each layer,
click the ellipses … to the right of the layer.

                                        d. The Indicators of Need Layers tab

Multiple options are available to users for each layer. These include:

    •    Zoom To: Zooms to the full extent of that layer.

                                                         4
• Transparency: Allows users to adjust the transparency of the layer. Adding transparency to the
top layers allows you to see them while still viewing underlying layers.
• Set visibility range: Allows users to set the scale range for that layer. The layer will appear only
inside of the set scale range.
• Enable pop-up: Enables and disables that layer’s pop-up on the map screen. Popups are
displayed by clicking on a location in the layer.
• Move Up / Move Down: Allows users to change the order of layers in the Content Pane. Layers
at the top of the pane will appear on top of the other layers underneath of it in the pane.
• View in Attribute Table: Opens the layer’s attribute table. The attribute table is discussed more
below.
• Description: Redirects users to the Item Description for that service.
b. The additional layer options
Legend
The Legend tab shows the corresponding symbols and colors used by layers in the map. The legend
includes a table showing geographic boundaries used by each indicator of broadband need and the
colors showing need (red), no need identified (green) and no data available (gray) for each indicator.
The legend is static and shows the symbols for all layers whether the layer is active in the map or is
turned off.
5e. Application legend
Change the Basemap
The Change the Basemap tab allows users to activate various Esri basemaps. The Firefly Imagery Hybrid
basemap is loaded by default.
6f. The Basemaps tab
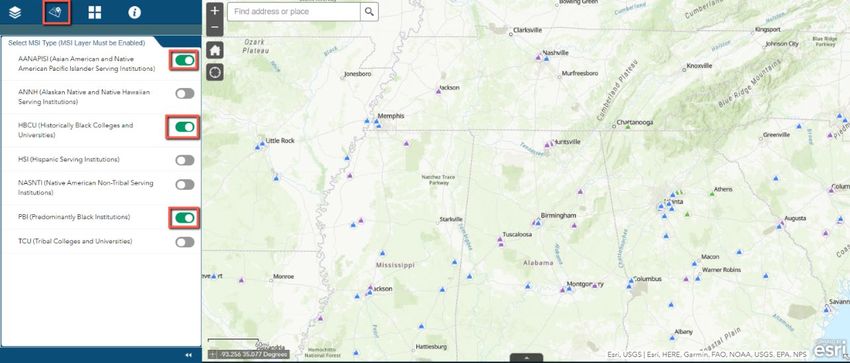
Select Minority Serving Institution (MSI) Type
The Select MSI Type tab is a specialized tab designed to work in tandem with the MSI data layer. When
the MSI layer is turned on, users can activate this tab’s sublayers to view MSI locations by the individual
categories outlined below. Slide each toggle button to the right to activate the category. If the MSI
layer is turned off, no icons will appear.
AANAPISI - Asian American and American Pacific Islander Serving Institutions
ANNH - Alaska Native and Native Hawaiian Serving Institutions
HBCU - Historically Black Colleges and Universities
HSI - Hispanic Serving Institutions
NASNTI - Native American Non-Tribal Serving Institutions
PBI - Predominantly Black Institutions
TCU - Tribal Colleges and Universities
7g. Turn on the MSI layer
h. The Select MSI Type pane, with icons on the map
About
The About tab provides detailed information about the map, including links to the sources used.
8i. The About tab
Attribute Table
Finally, the attribute table can be opened by clicking on the arrow at the bottom of the screen. By
default, clicking on the arrow brings up attribute tables with data from all census geographies: counties,
census tracts, and census blocks. By clicking on the arrow again, users can hide the attribute table.
j. The attribute table Show/Hide arrow
Spreadsheets containing the corresponding county, census tract and census block level data used in the
map are available for download in CSV spreadsheet format using the links provided below. Additionally
limited datasets (less than 2,000 records) can be filtered and exported using the attribute table widget
shown above.
• County CSV Data
• Tract Level CSV Data
• Census Block CSV Data
9Mobile App
This web application is also available to users on mobile devices. Scan the QR code below to access the
mobile version.
l. This QR code allows users to access the mobile version of the app
10You can also read