BCCDC Data Summary 17 June 2021
←
→
Page content transcription
If your browser does not render page correctly, please read the page content below
BCCDC Data Summary
     17 June 2021

                     1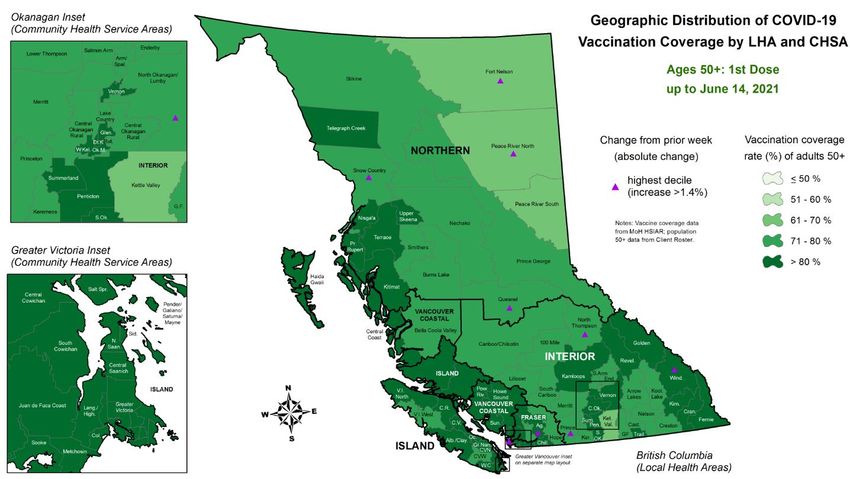
Purpose
The surveillance deck is a summary of COVID-19 related indicators that can help inform the pandemic
response in British Columbia. This surveillance monitoring constitutes the medical chart for population
health assessment that guides the public health community of practice. As such this is a working
document that reflects a snapshot in time and may differ from other published reports.
Data Sources
The collection, use and disclosure of case data is subject to the Public Health Act. COVID-19 cases are
reported under the Public Health Act to the health authority of residence. Public health case
notification, clinical management, contact tracing and follow-up contributes surveillance data for
regional and provincial COVID-19 monitoring. Each regional health authority have their own workflows
and information systems for capture of relevant data. This data foremost serves the public health and
clinical management of the case and their contacts.
Disclaimer
• Data and key messages within these documents are not finalized and considered to be work in
  progress that is subject to retroactive changes as more data and information become available.
• Accurate interpretation of figures may be difficult with the limited inclusion of data notes and
  methodology descriptions in this document.
                                                                                                   2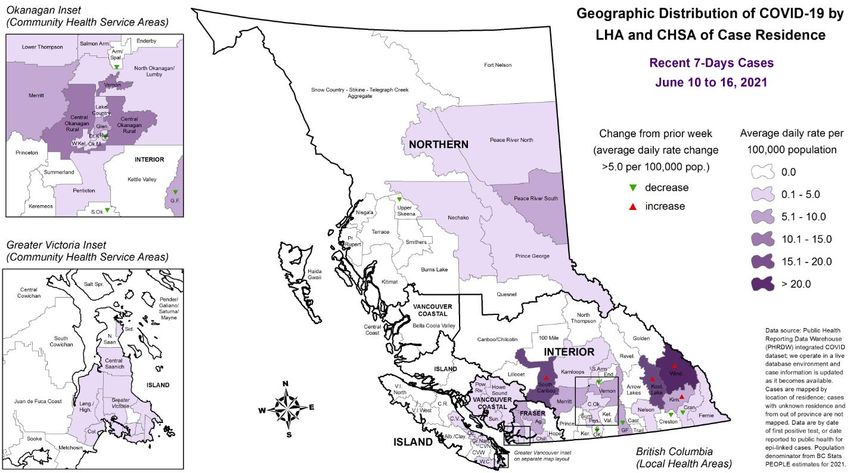
Table of Contents
 Overall Summary ……….…………………………………………………………………………………………………………………………4

 Surveillance ………………………………………………………………………………………………………………………………………….5

        BC Epidemiology………………………………………………………………………………………………………………….….5

        Vaccinations…………………………………………………………………………………………………………………………..15

        Labs/Genomics…………………………………………………………………………………………….………………………..21

 Modelling…………………………………………………………………………………………………………………………………..…………29

 *NEW* Assessment of the UK epidemiological situation……………………………………………………………………...31

 Additional Resources………………….……..………………………………………………………………………………………………….46

                                                                                  3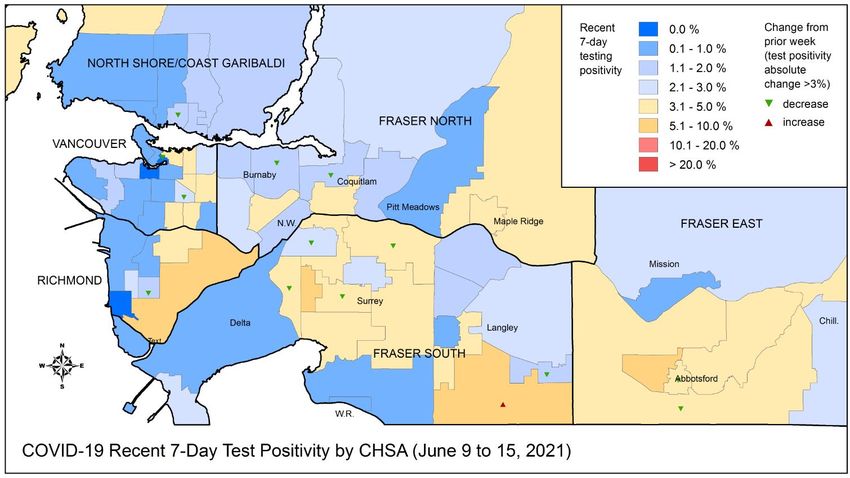
Overall Summary
• Case rates are declining in all HAs, and provincially cases are back to September 2020 levels; test
positivity continues to decline, ~3.7% provincially for publicly funded tests and 2.7% for all tests.
• Percent positivity ≤5% in all HAs and age groups is declining
• New hospitalizations continue to decline; hospital/critical care census is declining across BC (at April
2020 level); new deaths are stable and low.
• Majority of hospitalizations continue to be among individuals aged >40 years
• The share of VOCs among all positive tests in BC is ~90% from June 6 to 12. Among sequenced
samples provincially based on information for June 6 to 12, P.1(Gamma) (~45%) and B.1.1.7 (Alpha)
(~49%) remain two dominant VOCs, with B.1.617.2 (Delta) representing ~6% of VOCs.
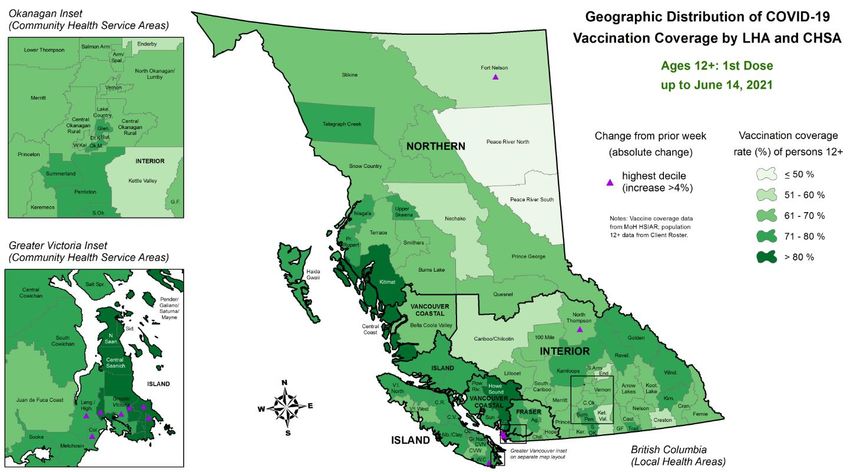
• Vaccine coverage in BC by age, June 17th: ~3/4 of 12+ and ~2/3 total population vaccinated.
Vaccination rates among 30-39 years have slowed down, early signs of slowing among 20-29 years;
~1/4 of adults 50+ have their 2nd dose.
• Recent case resurgence in the UK is largely driven by infections in younger individuals, most of
whom are not yet vaccinated. The UK situation is not directly comparable to BC, in part due to the
differences in the distribution across age and geography of the unvaccinated susceptible population.
4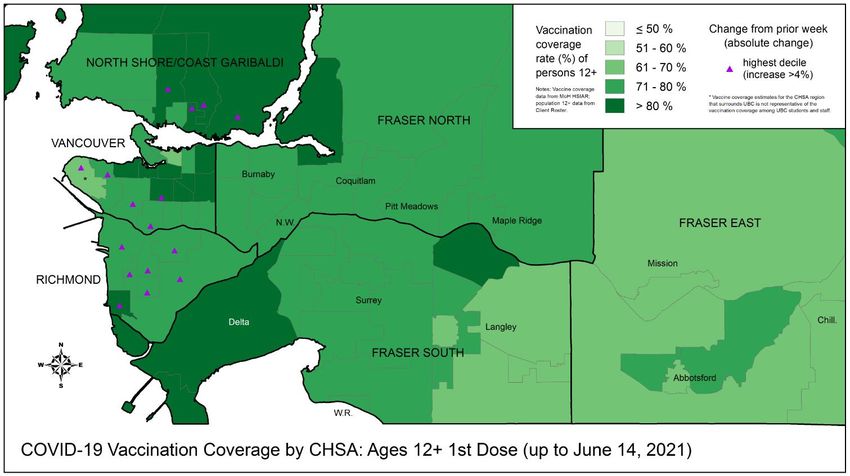
Jun 11 to Jun 17: BC COVID-19 Profile
  146,794 total cases           1,739   total deaths
     798 new this week            10    new this week

    7,879 ever hospitalized   143,579   removed from isolation
      69 new this week          1,265   new this week

                                                                 4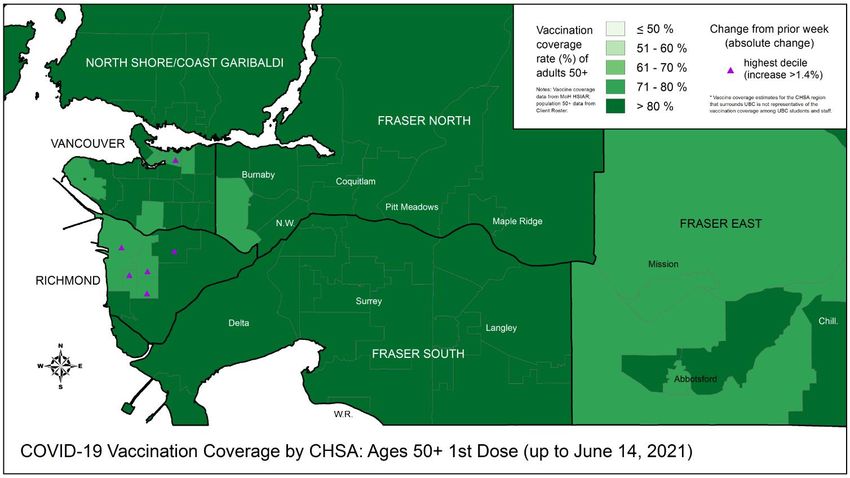
Case rates are declining in all HAs; new hospitalizations are declining or stable in all HAs; new
deaths are stable and low.

                                                                         For latest version of a graph similar to this one (difference:
                                                                         hospital census, not new hospitalizations), see the Epi App

                                                                                                                               5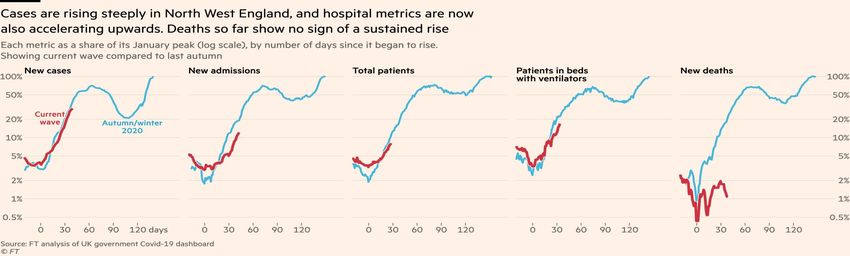
Hospital and critical care census is declining or stable in all regions.

                                                                           16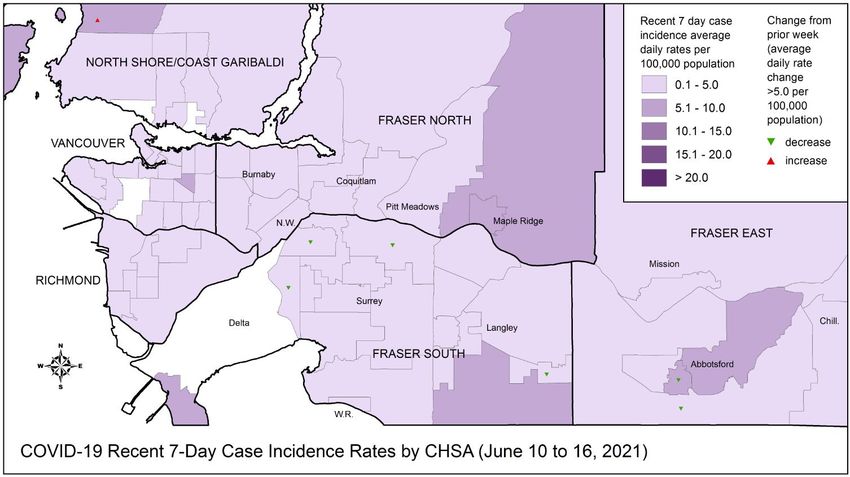
Number of new hospital admissions continues to decrease. The number of
hospitalizations among individuals
For latest version of this map, see the new (note: change   9
symbols not included) COVID-19 Surveillance Dashboard
For latest version of this map, see the new (note: change   10
symbols not included) COVID-19 Surveillance Dashboard
For latest version of this map, see the   11
new COVID-19 Surveillance Dashboard
For latest version of this map, see the   12
new COVID-19 Surveillance Dashboard
For latest version of this map, see the   13
new COVID-19 Surveillance Dashboard
Case incidence decreasing or stable in all HAs. Percent positivity ≤5% in all HAs.

                                                                                     14
Vaccine coverage in BC by age, June 17th: ~3/4 of 12+ and ~2/3 total population vaccinated.
Vaccination rates among 30 year olds have slowed down, early signs of slowing among 20 year
olds; ~1 in 4 of adults 50+ have their 2nd dose.
DRAFT 15For latest version of this map, see the 16 new COVID-19 Surveillance Dashboard
For latest version of this map, see the   17
new COVID-19 Surveillance Dashboard
For latest version of this map, see the   18
new COVID-19 Surveillance Dashboard
For latest version of this map, see the   19
new COVID-19 Surveillance Dashboard
Nationally, BC’s vaccination rate is very close to Canadian average; internationally, Canada is
      one of the countries with the highest proportion of the population with at least one dose.

Data source: Open Data                                                                    Data source: Our World in Data
Visualization: BCCDC                                                                                Visualization: BCCDC

                                                                                                               20
Lab - Key Messages
1. Percent positivity among publicly funded tests is 3.7% and among all tests it is 2.7%.
• Testing rates decreased 4% this week (~38,000 total tests June 6 to June 12)
2. There are regional differences in percent positivity, ranging from 0.8% in VIHA to 5.0% in IH.
3. Incidence continues to decline in all age groups; percent positivity is ≤5% in all age groups.
4. The provincial weekly median turnaround time (time from specimen collection to lab result) is
13 hours, indicating good testing capacity; only 1 in 4 tests took ≥24 hours to result.
5. The share of VOCs among all positive tests in BC is ~90% from June 6 to 12.
6. Sequencing-based VOC prevalence for June 6 to 12 shows distribution of lineages: P.1 (
Gamma)~45%, B.1.1.7 (Alpha)~49% and B.1.617.2 (Delta) ~6%.
21Weekly Summary of ALL lab tests performed
2,820,994 total specimens tested
4% relative to last week
37,928 new this epi week
154,184 total positive specimens 2.7% positivity
0.9% absolute change from
1,021 new positive this epi week last week
15 hr mean turnaround time (TAT)
4% TAT relative to last
13 [9-24] Median [Q1 – Q3] TAT week
Weekly Summary of Lab tests paid Publicly
2,315,634 total specimens tested
3% relative to last week
27,536 new this epi week
152,789 total positive specimens 3.7% positivity 22
1.3% absolute change from
1,008 new positive this epi week
last week
Data source: PLOVER extract at 10:30am on June 16, 2021.
Epi week 23 (June 6 - 12)For latest version of this map, see the new (note: change 23 symbols not included) COVID-19 Surveillance Dashboard
Includes all tests

For latest version of this map, see the new (note: change          24
symbols not included) COVID-19 Surveillance Dashboard
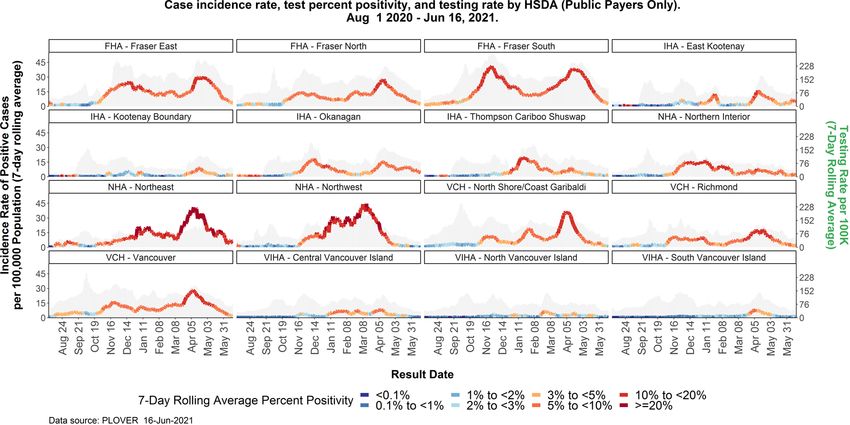
Incidence is stable or decreasing across regions; positivity is >5% in Northeast and East
Kootenay HSDAs.

                                                         For latest version of a graph similar to this one            25
                                                         (difference: all tests, not public tests), see the Epi App
Incidence continues to decline in all age groups; percent positivity is ≤5% in all age groups.
23Of all COVID-19 positive test samples June 6 to June 12 in BC, ~90% were confirmed VOCs.
Shaded area reflects
partial data and is
subject to change
Data from the Plover system at the BCCDC Public Health Lab This figure can also be found in the weekly VOC report
27Among sequenced samples provincially based on information for June 6-12, P.1 (~45%) and
B.1.1.7 (~49%) remain two dominant VOCs. B.1.617 increasing, currently represents ~6% of
VOCs
B.1.1.7 (Alpha) 49%
B.1.617.2 (Delta) 6%
P.1 (Gamma) 45%
B.1.351 (Beta)Dynamic compartmental modeling: recent trends Our model shows that Rt remains below 1 and is stable in most regions of BC
Model notes and assumptions
• Rt modelling: a dynamic compartmental model was fit to COVID-19 data for BC using a Bayesian framework
  (Anderson et al. 2020. PLoS Comp. Biol. 16(12): e1008274). Results are presented as provincial and regional
  time-varying estimates of average daily transmission rate (Rt).
     • the model does not consider importation of cases, hence all transmission is assumed to arise from local
       cases
     • the model does not distinguish cases arising from variants of concern (VoCs) versus ‘wild-type’ COVID-19,
       hence model estimates represent average rates of transmission

                                                                                                                   30
Addendum: assessment of the UK
epidemiological situation and
comparisons with BC
June 17, 2021
31Assessment of the situation in the UK • UK is experiencing a resurgence in cases after ~2 months of low and stable rates. Current case incidence in the UK is higher than BC and overall % population with at least 1 dose is slightly lower than in BC. • Most of the new infections are attributed to the Delta (B.1.617.2) variant. It took the Delta variant ~2 months to become dominant in the UK, a similar time frame to Alpha variant. • Current resurgence in the UK is largely driven by infections in individuals
UK is experiencing a resurgence in cases after ~2 months of low and stable rates. Current overall
incidence in the UK is higher than in BC.

                                                                 For latest version of this graph, see the Epi App

                                                                                                                     33
Scale for
UK & Scale for
BC’s declining case
Israel trajectory since the peak BC curve
curve has been similar to Israel’s
34Most of the new infections in the UK are attributed to the Delta (B.1.617.2) variant. It took the Delta
variant ~2 months to become dominant in the UK, a similar time frame to Alpha variant.
B.1.617.2 (Delta):
became dominant
between early April and
early June (~2 months) Please note that the
way samples were
Source
identified for these
two variants were
different (screening
for Alpha and
SGTF was used as sequencing for
proxy for Alpha Delta) and for Alpha,
may have captured
B.1.1.7 (Alpha): other lineages.
became dominant
between early Nov and
early Jan (~2 months)
Source
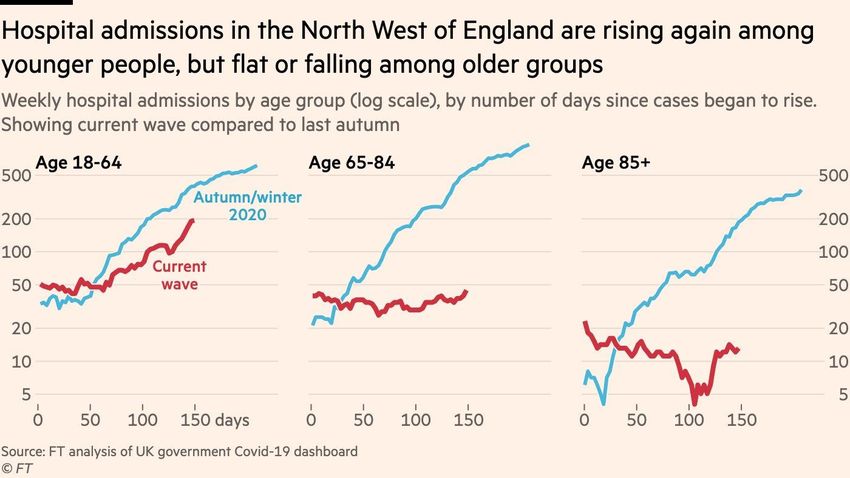
35Current resurgence has been largely concentrated in North West of
England initially, but has recently spread to other parts of the country
North West England
* Manchester
Visualization
source:
Data to 10 June. Source: Guardian Wikipedia
36Source: Financial Times
37Current resurgence is largely
Heat map of cases in Manchester over time
driven by infections in
individualsThis pattern is observed at the national level as well. However, it is important to note that new resurgences generally begin in that age group, a phenomenon consistently observed in various jurisdictions. One of the reasons for this is a very high contact rate in
The same key contact patterns are consistent across countries: people tend to
interact the most with people who are the same age, and children and young adults
have the highest contact rates.

The other two heat
lines on these graphs
are parents/
grandparents/ teachers
interacting with
children/
grandchildren/
students

                                                                          Source: Mossong et al,
                                                                          PLOS Medicine

                                                                                        40
We observe these patterns in Canada as well. Note how contact patterns also differ
by setting.
Darker colors in the figures shows higher frequency of contacts
Similar to European countries, assortative age mixing and higher contacts in children 9-19 yrs
As expected work place contacts are higher between age 25- 55 yrs.
Prem K, Cook AR, Jit M (2017) Projecting social contact matrices in 152 countries using contact surveys and demographic data. PLOS Computational Biology 13(9): e1005697.
https://doi.org/10.1371/journal.pcbi.1005697 https://journals.plos.org/ploscompbiol/article?id=10.1371/journal.pcbi.1005697
41Data from Zoe COVID
Symptom Study, which
uses smartphone real
time self-reported data
based on positive tests
from over 4.6 million UK
participants, also suggest
that a lot of the new
infections in the UK are
among the unvaccinated
individuals.
42At the end of May, just when the resurgence of cases was beginning, ~93% of
unvaccinated individuals in the UK were under 40 years of age
Among those under 40
years old, ~80% have
not had 1 dose yet at
the end of May
Not vaccinated
Source: Public Health England
43England had a different age-specific vaccination status of the population back in mid-April, a comparable
point in time to where BC is at now in terms of incidence rate, # months since vaccination campaign
began, and Delta prevalence. But even today, significantly lower share of younger individuals in the UK
have received at least 1 dose compared with BC – but a much higher share of older adults have a 2nd dose.
BC: mid-June England: mid-April England: mid-June
3 months since start of 3 months since start of 5 months since start of
vaccination campaign vaccination campaign vaccination campaign
% Delta: ~9% % Delta: ~10% % Delta: >90%
DRAFT Source: Public Health England 44Vaccine effectiveness against the Delta variant
Another consideration, which may or may not end up being an important factor in the most recent resurgence in
the UK, is the difference in the types of vaccines distributed to the population. In the UK, ~2/3 of 1st doses were
AZ and ~1/3 were Pfizer.* In BC and Canada, the majority of 1st doses were Pfizer/Moderna. *Source
Data from England and Scotland suggest that both vaccines are effective against the Delta variant:
Symptomatic infection: 1 dose of vaccine is not as effective against Delta as 2 doses, and AZ not as effective as Pfizer
Severe outcomes: Both vaccines are very effective after 1 dose, and offer excellent protection after 2 doses
Effectiveness estimates against symptomatic disease Effectiveness estimates against hospitalizations
Vaccine 1 dose 2 doses Vaccine 1 dose** 2 doses
Alpha* Delta Alpha Delta Alpha Delta Alpha Delta
Pfizer 27-49% ~33% 92-93% 83-88% Pfizer 83% 94% 95% 96%
Astra-Zeneca 39-51% ~33% 73-81% 60-61% Astra-Zeneca 76% 71% 86% 92%
Sources: PHE Lancet
Source
*Note how VE estimates for Alpha for both Pfizer and Astra-Zeneca are lower
than what was estimated based on BC data and on the lower end of the range
reported in other studies (46-60% for Pfizer and 70% for Astra-Zeneca).
45Additional Resources
• BCCDC COVID-19 Surveillance Dashboard showing maps, vertical plots, and trends by LHA can be
found here
• More BC COVID-19 data, including the latest Situation Report, maps, and BC COVID-19 public
dashboard, can be found here
• For more information on variants of concern and whole genome sequencing, the latest report is
posted here
• To put BC provincial, Health Authority, and HSDA trajectories into national and international
context, see BCCDC COVID-19 Epidemiology app
• COVID SPEAK 2020 Round 1 Survey results
• Slides for previous public and modelling briefings by Dr. Bonnie Henry can be found here
• PHAC’s COVID-19 Epidemiology update can be found here
46You can also read