Coral Reef Fisheries Technical Summary - Overview
←
→
Page content transcription
If your browser does not render page correctly, please read the page content below
Coral Reef Fisheries Technical Summary

 Overview

 Under the Caribbean Regional Oceanscape Project (CROP) Subcomponent 2.1, the
 Organisation of Eastern Caribbean States Commission (OECSC) engaged The Nature
 Conservancy (TNC) to develop ecosystem service (ES) models for five countries in the
 Eastern Caribbean (Dominica, Grenada, Saint Lucia, St. Kitts and Nevis, and St. Vincent and
 the Grenadines) using methodologies developed under TNC’s Mapping Ocean Wealth (MOW)
 initiative, and to develop training and resources to improve data access for decision-makers.

 This document provides a technical overview of the Coral Reef Fish and Fisheries models
 and maps derived under this project by Florida International University. Click here to see
 the full technical report.

 Coral reefs in the Eastern Caribbean provide food and income to fishers and communities,
 but are threatened by a range of stressors that have impacted the health of reefs and the
 fish assemblages they support. To address these stressors and manage coral reef
 ecosystems for continued provision of ecosystem services, a local understanding of the
 factors that influence fish biomass, the current distribution of fish biomass, and insight into
 the potential outcomes of management is useful. This analysis followed similar methods
 employed in Micronesia, the Bahamas, and Florida, and used fish surveys, socioeconomic,
 and biophysical data from across the Eastern Caribbean to model and map fishing impact,
 model and map current fish biomass, and assess the potential benefit of conservation and
 management measures on reef fisheries. Although the research focused on the five CROP
 countries listed above, models were produced for the entire region from Anguilla (in the
 North) to Grenada (in the South) to account for connectivity among fish populations and to
 increase the number of fish surveys available to parameterize models.

 The datasets produced from this model will enable planners to examine management
 scenarios for the effects on fish biomass, specifically fishing closures on snapper-grouper,
 and increase in coral cover for parrotfish.
Data Sources
Table 1. List of model input data and sources
Data input Source(s)
Biophysical Variables
Depth GEBCO
Diadema density Siegel et al. 2019
Geomorphology Google Earth imagery
Coral Reef Habitat TNC (benthic habitat maps created under the ECMMAN
Project) and TNC Reef Report Cards
Oceanic net primary Oregon State University (mean net primary productivity from
productivity monthly data 2012 – 2016)
Protected status TNC protected areas layer
Sea surface temperature NOAA CoRTAD satellite-based ocean temperature dataset
Wave exposure Chollett et al. 2012
Fishing-related variables
Demography Various governmental and non-governmental sources
Fish Landing Sites Stakeholder input and various reports and articles (e.g.
Staskiewicz et al. 2008, Guyader et al. 2 13, Ramdeen et
al. 2014a, de Graaf et al. 2017, Gumbs et al. 2015, Lindop
et al. 2015
Fisheries economy Siegel et al. 2019
Fish Survey datasets Atlantic and Gulf Rapid Reef Assessment (AGRRA); Steneck et
al. 2018, Waitt Institute, Institute for Tropical Marine Ecology
(ITME), Observatoire du Milieu Marin Martiniquais (OMMM),
and the FORCE project.
Governance Worldwide Governance Indicators Kaufman et al. 2010;
compiled by Siegel et al. 2019
Market gravity Cinner et al. 2018
Population LandScan human population data
Ports Various governmental sources and non-governmental sources
Modelling and Geoprocessing
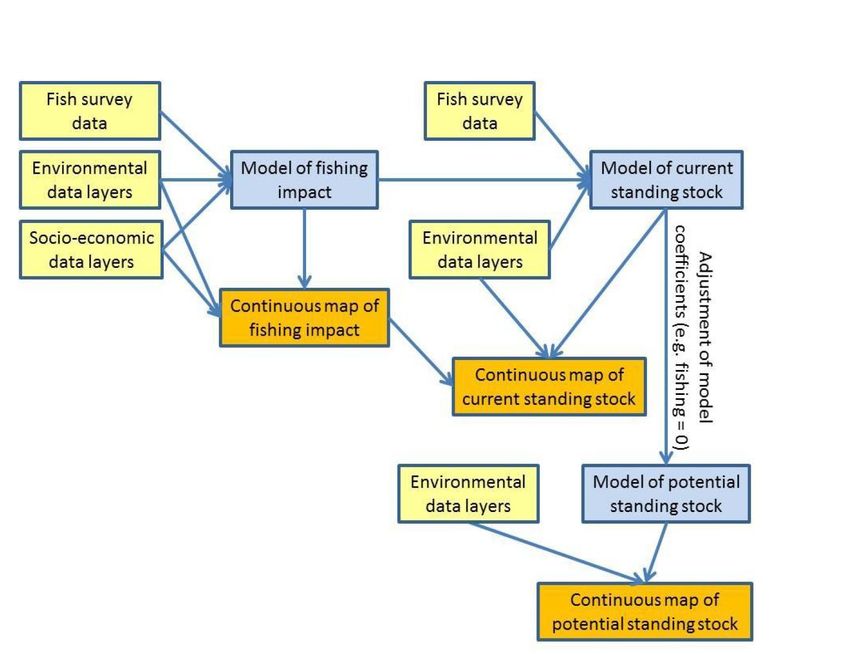
The methods presented below in the conceptual overview (Figure 1) and the subsequent
descriptions were informed by previous efforts, adapted to the needs and data availability in
the region. Methodologies and interim results were reviewed by stakeholders at in-person
and virtual workshops in 2019 and 2020.
2
Conceptual Overview

Figure 1. Overview of the methods for modelling and mapping fishing impact and fish biomass. Yellow
boxes represent input data, blue boxes represent output models, and orange boxes represent output
maps.

Map of Coral Reefs

A high-resolution benthic habitat layer developed by TNC (Schill et al. in prep) using Planet
Lab Inc.’s Dove satellite 4-meter imagery (Li et al. 2019) was used to establish the extent
of reef areas for the model. The layer categorizes shallow benthic habitats across the
region, including five coral reef habitat types: Reef Crest, Reef Fringing, Reef Fore, Reef
Back, Spur and Groove. This map was rasterized to a 100m (1ha) resolution, such that all
map products from the project are at a 1ha resolution. To further capture differences in
fishing and fish biomass across habitat types in the models, a higher-resolution habitat layer
developed by TNC for only the five CROP countries was used to assign additional
information to sites in those countries. This second, higher-resolution layer included the
following habitat classes: Boulders and Rocks, Coral Acropora, Coral Algal Rim, Coral
Framework, Coral Orbicella (Montastraea) with Gorgonians, Coral Patch Reef, Deep water,
Hardground Algal, Hardground Gorgonian, Hardground Turf, Land, Mud and Silt, Rubble,
Sand, Sand with Macroalgae, Seagrass Dense, Seagrass Sparse.

                                                                                                  3
Fishing Impact
Fishing impact was modelled using the metric of mean parrotfish length (derived from fish
survey data), which has been shown to be negatively correlated with fishing pressure. Mean
parrotfish length was modelled in relation to environmental (e.g. wave exposure) and
fishing-related (e.g. population) variables to isolate just the fishing-related factors
influencing parrotfish length. This allowed for estimates of fishing impact that are based on
fishing-related factors, but that control for the influence of biophysical gradients on
parrotfish length. The model of fishing impact was parameterized using data from reefs
where fish survey data were available, but it was used to extrapolate values across the
region using continuous data layers of each significant explanatory variable, thus deriving a
continuous map of fishing impact. The maps of fishing impact generated by the project
represent relative, unitless patterns of estimated total fishing impact, as opposed to
absolute fishing rates as measured by metrics such as catch per unit effort.
Current Biomass
The predicted values of fishing impact were then a key input into a model of current fish
biomass. The model of current biomass used data independent of the data used to model
fishing impact to ensure robust statistical models (i.e. we did not derive fishing impact from
a dataset, then use the fishing impact metric to model biomass in the same dataset).
Predicted fishing impact was combined with environmental data (Table 1) to model the
biomass of two species groups: snapper and grouper species and parrotfish species, in
addition to the total biomass which included all species documented in AGRRA surveys. The
model was then used to extrapolate these results to all 1ha cells, resulting in high-
resolution maps of the current biomass of each species group across the region.
Potential Biomass
Coefficients from the current biomass model were adjusted to estimate potential biomass
under different management initiatives. This report includes the results of adjusting fishing
impact to zero, simulating the effects of a no-take marine reserve on snapper and grouper
species. It also includes increasing the percentage of hard coral cover to simulate the effects
on parrotfish species of a restoration effort that increases live coral. These adjusted models
were combined with all significant environmental data layers to generate continuous maps
of potential biomass under the two management scenarios.
Other Considerations
These are modelled data products, with overall accuracy dependent on the quality of input
datasets. Due to low sample sizes, a full range of management scenarios, other
species/species groups, and relationships between fish biomass and other variables have
not been evaluated under this project. These products can be most useful in a management
4context when used together with other forms of data and knowledge regarding the
distribution of fishing and fishing impacts and fish biomass on these reefs.
Suggested Citation
Zuercher R, Esch M, Harborne AR. 2021. Coral Reef Fish and Fisheries in the Eastern
Caribbean. Produced by Florida International University for the Organisation of Eastern
Caribbean States and The Nature Conservancy under the Caribbean Regional Oceanscape
Project
Data Access
Coral Reef Fisheries Data Models
Other Fish Survey Data
• AGRRA
• Waitt Institute
Acknowledgements
The following individuals and organizations kindly provided essential data for this project: Dr
Lynnette Roth and the Atlantic Gulf Rapid Reef Assessment (AGRRA), Dr Sascha Steiner
(Institute for Tropical Marine Ecology), Drs Robert Steneck (University of Maine) and Peter
Mumby (University of Queensland), Drs Andy Estep, Matt Pauvfe and the Waitt Institute, Dr
Jason Flower (UC Santa Barbara), Dr Jean-Philippe Marechal (Observatoire du Milieu Marin
Martiniquais), Drs. Steven Newman and Nick Polunin (Newcastle University), and Dr Iliana
Chollett (Independent Consultant). In addition, multiple spatial data layers for the project
were provided by The Nature Conservancy, and we acknowledge funding for data
development from the German Federal Ministry for the Environment, Nature Conservation
and Nuclear Safety (BMU).
Additional contributors provided direction and shared their knowledge of fisheries and the
marine environment in the Lesser Antilles: Olando Harvey (Grenada Fisheries Division),
Charlie Prospere (St. Lucia Department of Fisheries), Marc Williams (St. Kitts and Nevis
Department of Marine Resources), Jennifer Cruickshank-Howard (St. Vincent and the
Grenadines Fisheries Division), Mark Archibald (Antigua and Barbuda Fisheries Division),
Kris Isaacs (St. Vincent and the Grenadines Conservation Fund), Jullan Defoe (Dominica
Fisheries), Kurt Hilton (Dominica Fisheries), Tricia Greaux-King (St. Kitts and Nevis
Department of Marine Resources), Dr. Mary Donovan (UC Santa Barbara), and all who
participated in the 2019 CROP Project Kick-off workshop. This project would not have been
possible without their expertise.
5You can also read