Mapping & Modeling Migration and Displacement with "Big" Data
←
→
Page content transcription
If your browser does not render page correctly, please read the page content below
Mapping & Modeling Migration and Displacement
with “Big” Data

Alex de Sherbinin, PhD
CIESIN – The Earth Institute Columbia University
Population-Environment Research Network (PERN)
NASA Socioeconomic Data and Applications Center (SEDAC)

22 April 2021
Columbia Population Research Center and Data Science Institute
Lessons from the “big data” approach to modeling
migration and displacement
• Migration data are scant and often not comparable (e.g. stocks, flows,
  differing time periods)
• Using past and future population distributions offers potential
  solutions
• Modeling future migration is fraught with uncertainty but plausible
  futures can also be better understood
• Big data for displacement monitoring – a holy grail but we’re not
  there yet

 Illustrating these points through three projects – (1) estimating past net migration,
 (2) projecting future migration, and (3) using big data for displacement monitoring
                                                                                         2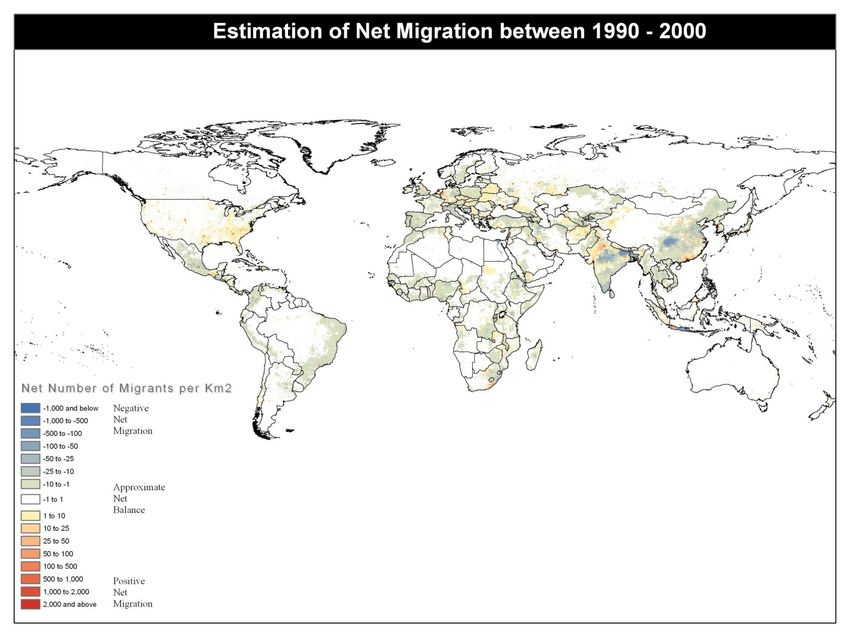
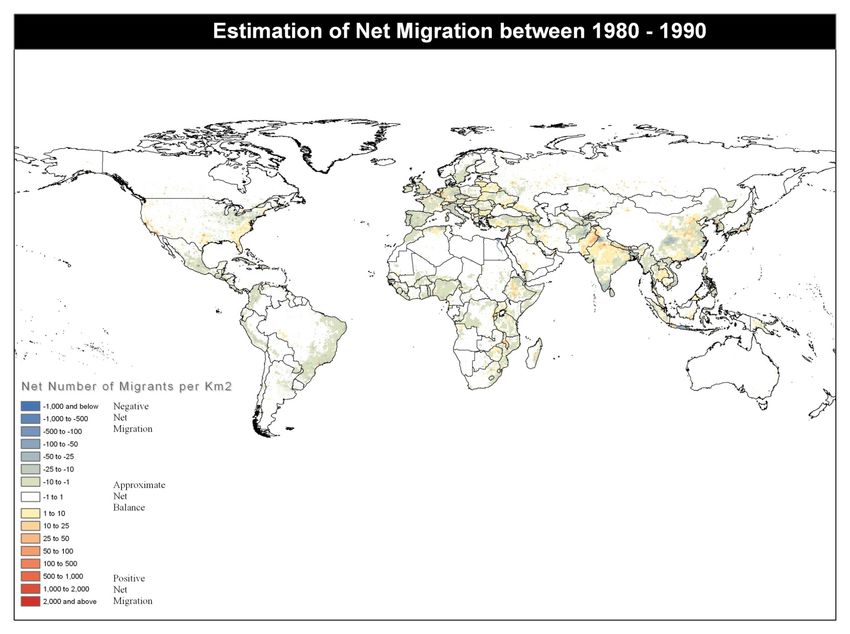
Modeling Net Migration
Project funded by the UK Foresight Project on Migration and Global Environmental
Change
Alex de Sherbinin (PI), Marc Levy, Susana Adamo, Kytt MacManus, Greg Yetman, Vali
Mara, Liana Razafindrazay, Ben Goodrich, Tanja Srebotnjak, Cory Aichele, and Linda
Pistolesi.
                                                                                 3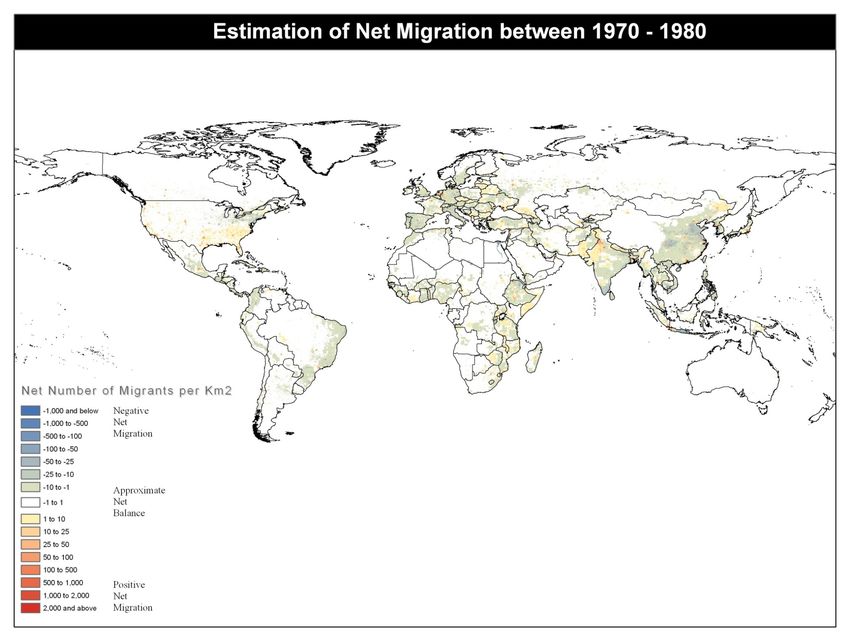
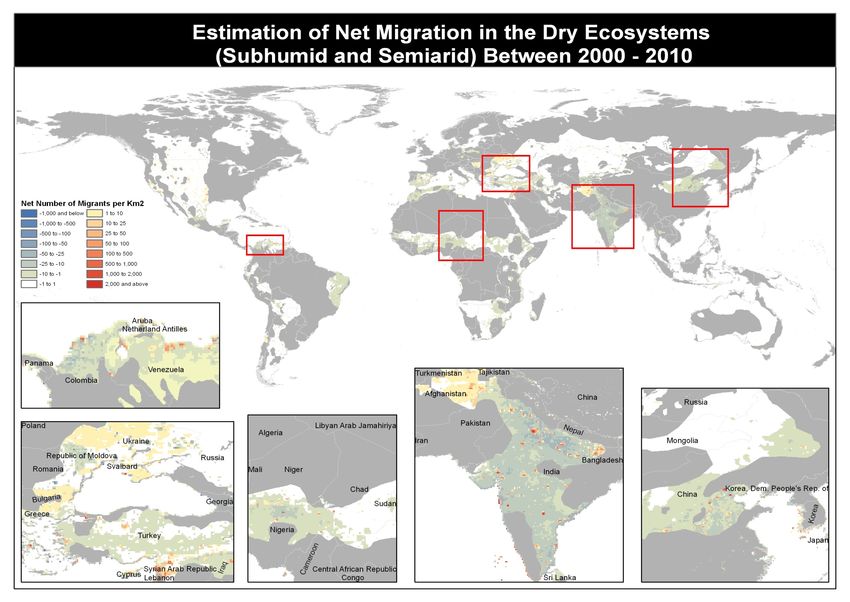
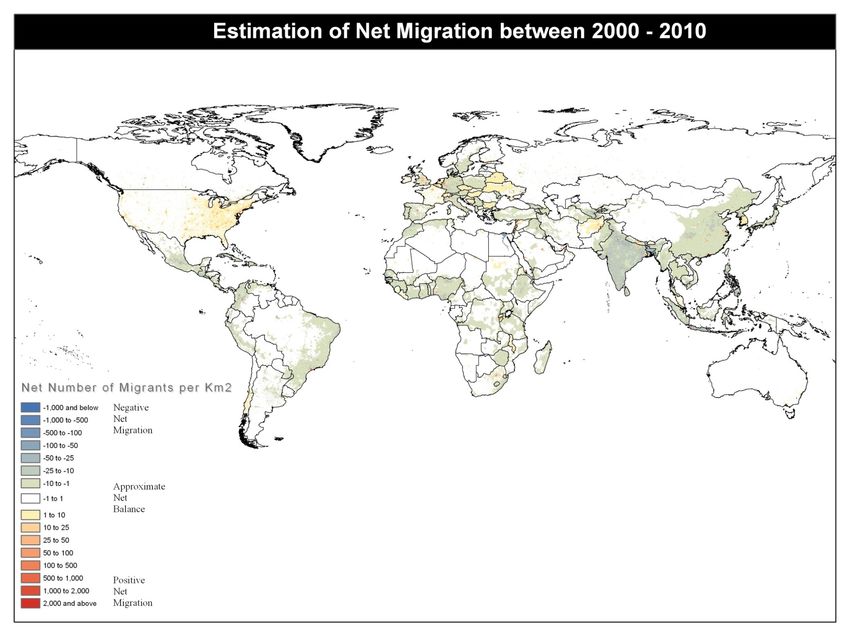
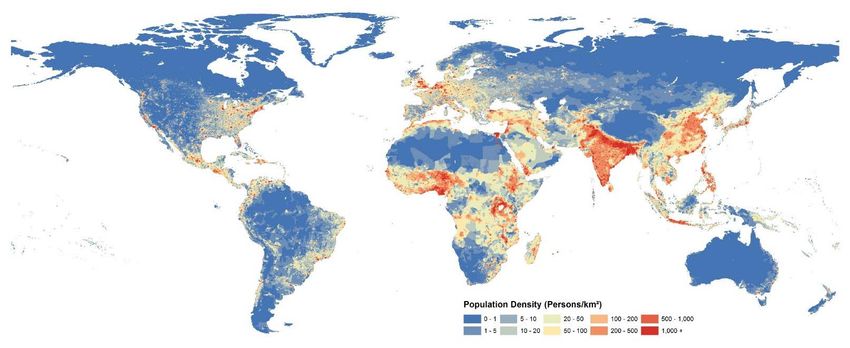
Migration data are scarce – so indirect estimation using “big” population
data is sometimes the best solution for global-scale analyses
5
The Approach
 Using the population balancing equation:

 Population Growth = (Births – Deaths) + (In-migration – Out-migration)

 Or:

 Population Growth = Natural Increase + Net Migration

 Therefore:

 Net Migration = Population Growth – Natural Increase
                                                                          6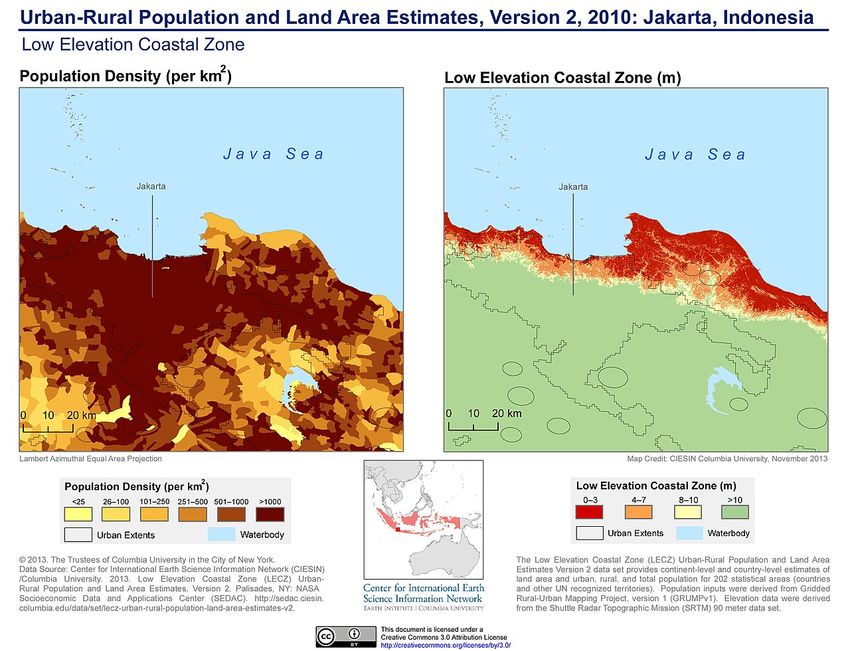
Methodological Challenge:
Natural Increase Grids
• Could have used country       Ratio of Urban to Rural Rates of Natural Increase (RNIs)
  level rates of natural
  increase (RNIs)
• But we know that RNIs are
  not uniform within
  countries
• So we compiled crude
  birth rates and crude death
  rates by urban and rural
  area for as many countries
  and years as possible from
  the UN Demographic
  Yearbooks
Methodological Challenge:
Natural Increase Grids
• So we sought to characterize natural increase
  at a subnational level
   • differentiating urban and rural rates of natural increase
• Compiled urban and rural crude birth and
  death rates for as many country-years as
  possible
   • 5,016 country-year observations
• Imputed the remainder using mi and Amelia
  package
• Used population density grids to spatially
  allocate differential rates of natural increase
• Last steps:
   • RNI grid x Pop Grid (t1) = Nat. Inc. Grid
   • Pop Grid (t2) – Pop Grid (t1) – Nat Inc. Grid
     = Net Migration Grid for decade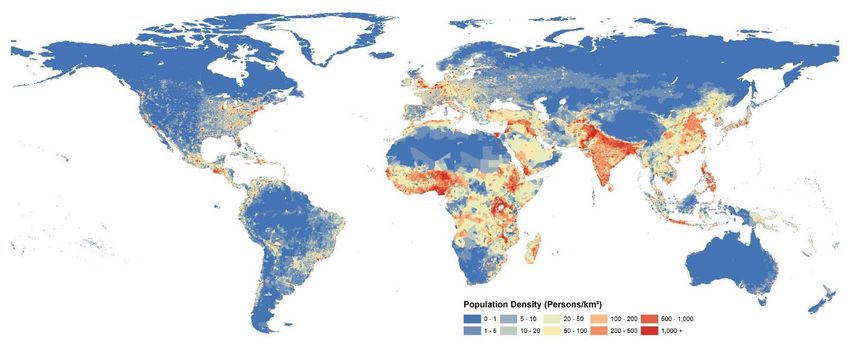
Download data at
http://sedac.ciesin.columbia.edu/data/set/popdynamics-global-
est-net-migration-grids-1970-2000
                                                                9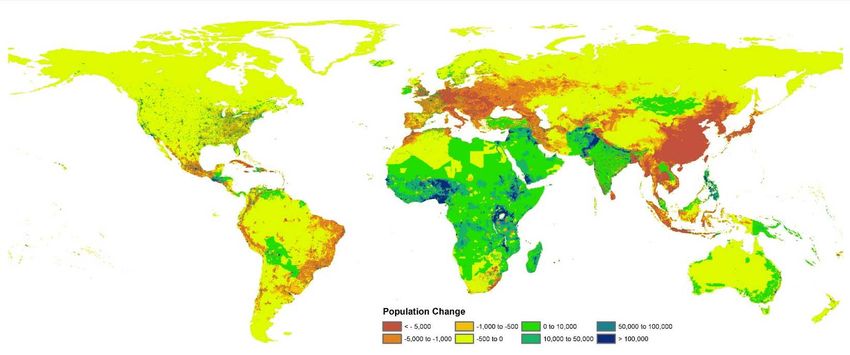
Emulation is the highest form of flattery…

                                                                                         10
                 Download at: https://knowledge4policy.ec.europa.eu/dataset/ds00167_en
Population Gravity Modeling to
Infer Migration
Project funded by the World Bank, with new work under the African Union
Commission funded by the Robert Bosch Foundation
Alex de Sherbinin (PI), Susana Adamo, Jane Mills, Tricia Chai-Onn, Alyssa Fico,
Malanding Jaiteh, Valentina Mara, Kytt MacManus, Kira Topik, and Haibin Xia
11Groundswell: Preparing for
Internal Climate Migration
• Groundswell was released in 2018,
and covered three regions – Latin
America, Sub-Saharan Africa, and
South Asia Modeling conducted by Bryan Jones, PhD
CUNY Institute for Demographic Research
• Groundswell II is expected to be CUNY Baruch College
released in June 2021 – covering the
remainder of World Bank regions With inputs form Jacob Schewe, PhD
Potsdam Institute for Climate Impact Research (PIK)
12• Groundswell uses a Model Modifications
population gravity
modeling approach
• Gravity models start with
a baseline population
• Future populations are
projected based on the
empirical observation
that people tend to move
to urban areas owing to
economic opportunities
and services
(attractiveness)
• Climate impacts could
be a push or pull factor
that will affect the
relative attractiveness of
locations
13Groundswell took a scenario based approach based on combinations of
development trajectories (Shared Socioeconomic Pathways) and climate
impacts on crop production and water availability (from the ISIMIP project)
14Two SSPs + Climate Impacts
SSP 2: Middle of the Road SSP 4: Inequality
We projected population distributions with and without climate impacts to
generate two future population distributions – the difference between the two
was assumed to result from the fast demographic variable…. migrationHeadline Numbers
• Up to 140 million internal
migrants by 2050 in the
three regions
• The largest numbers are in
Africa, suggesting high
climate sensitivity in that
region
• Numbers are lower for
SSP2: more inclusive
development, and lowest
for the climate-friendly
RCP2.6 scenario
16Migration Hotspots for two out of
three regions
(South Asia not shown)
17Urbanization
Urban Threshold: >=300 persons per sq. km.
18Net migration
(millions)
0
-1.0
-0.5
0.5
Livelihood Systems
Net migration
(millions)
0
-1.0
-0.5
0.5
19Big Data to Monitor and Quantify
Disaster Displacement
Project funded by Schmidt Futures through the Data Science Institute
Bob Chen (PI), Kytt MacManus, Greg Yetman, Nanshan Li, Andrea Navarrete and
Vikas Vicraman
20Problem Statement
• The number of internally displaced persons (IDPs)
is on the rise
• The development of official definitions / statistics
on IDPs has just begun
• Definitional issues are complicated
• Humanitarian groups need real-time data on
displacement
• Such data are difficult to collect in challenging
contexts (natural disasters, conflict)
• Novel data streams are increasingly being sought
to fill the gaps
21Monitoring is challenging
In and out flows
In flow
Out flowWhat are Skyhook data?
• Cross platform device location data based on wifi, GPS, and cell tower
signals
• MAC ID request and distinct user counts aggregated for 30m pixels
• Hourly temporal resolution
• Advantages:
• Includes smart phones, computers, laptops, and gaming devices (not just
phones)
• Does not require separate MOUs with each cell phone provider
• Disadvantages:
• Can’t track individual devices (as one would cell phones)
• Devices need to be data enabled (not simple flip phones) – which introduces a
potentially biased sample, esp. in least developed countries
23Total population by state in Mexico against device numbers
Nuevo Leon &
● Sample data from Mexico Chiapas have ~
same population
visualized by state exhibits wide according to
variation between mobile activity 2010 Census,
but the level of
and 2010 census population activity in the 2
estimates states in the
skyhook data
varies greatlyHourly MAC ID request and distinct Hourly Skyhook Mobility Data & VIIRS DNB - user counts, aggregated by 100m x Oaxaca, Feb 11 to 24 2020 100m tiles in Mexico, from Sep 30 - Oct 8 2018
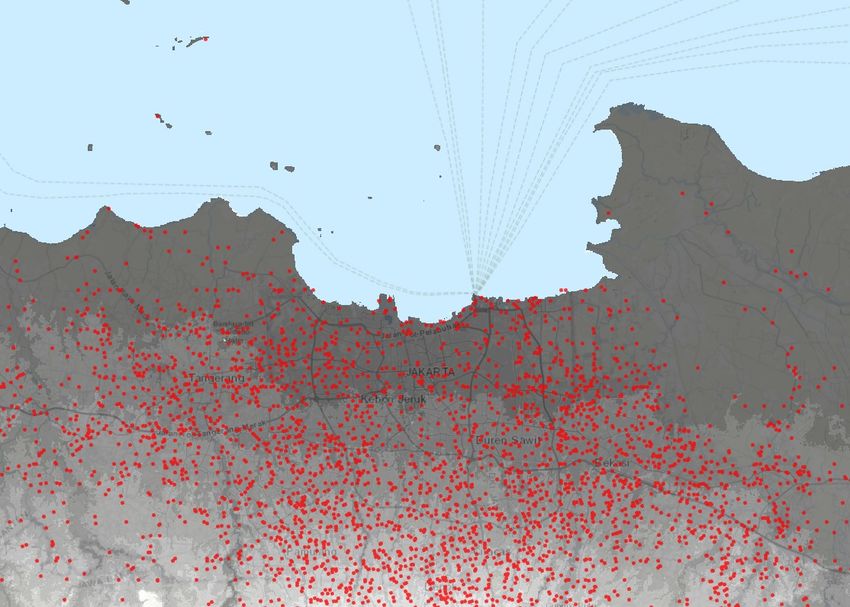
Jakarta, Indonesia
• Major flood occurred
  January 1, 2020
• 400mm of rain on New
  Year’s eve

                         Figure 1: The total number of
                         devices that connected to
                         internet endpoints across
                         Jakarta, West Java, and Banten
                         provinces of Indonesia on each
                         day from Dec 16, 2019 to Jan
                         17, 2020 from Skyhook data

                                                          Figure 2: The average of device counts for
                                                          each 100m x 100m tile in the Skyhook 26
                                                                                                data
Jakarta lies in a low, flat
basin, averaging 7 meters
above sea level and 40%
of Jakarta, particularly the
northern areas, is below
sea level, while the
southern parts are
comparatively hilly.
(source:
https://en.wikipedia.org/
wiki/Floods_in_Jakarta)
27Change in device counts before and after flood 100m x 100m tiles from Skyhook where the average number of Blue dots represent a decrease in the mean device count and green devices used increased after the floods. The red dots indicate the represent an increase areas where the number of devices connecting to internet endpoints were higher after the floods when compared to the 28 same number before the floods.
Cluster Analysis

                   Normalized change in device count
                                                       Jakarta

                                                                   Bandung

                                                                 Normalized elevation

                                                                                        29
Building on IDMC’s IDETECT:
Natural Language Processing
When?
What?
How many?
Where?
30https://idmc-mm.surge.sh/ Slide courtesy of IDMC
CIESIN – DSI Collaboration (with ISI
Foundation and IDMC)

                                       32
Conclusions
33Lessons from the “big data” approach to modeling
migration and displacement
• Migration data are scant and often not comparable (e.g. stocks, flows,
differing time periods)
• Using past and future population distributions offers potential solutions
• Results at local levels must be treated with caution
• However, results on aggregate are plausible
• Modeling future migration is fraught with uncertainty
• Future patterns are likely to be affected by economic interdependencies, conflicts,
and national policies in ways that can never be fully foreseen
• Yet, if the models cause policy makers to consider the potential migration impacts of
climate change for the first time, that is a useful result
• Big data for displacement monitoring – a holy grail but we’re not there yet
34You can also read