Update on COVID-19 in Canada: Epidemiology and Modelling - Canada.ca/coronavirus April 23rd, 2021

Page created by Kurt Hart
 
CONTINUE READING
Update on COVID-19 in Canada: Epidemiology and Modelling - Canada.ca/coronavirus April 23rd, 2021
Update on COVID-19 in
Canada: Epidemiology
and Modelling
April 23rd, 2021

Canada.ca/coronavirus
Update on COVID-19 in Canada: Epidemiology and Modelling - Canada.ca/coronavirus April 23rd, 2021
National disease and severity indicators have increased considerably
   over the past month
  Number of cases, total in                                              On average over the past 7 days:                     Number of deaths
      hospital and ICU                                                   8,444 cases
   10,000                                                                4,167 hospitalizations                                                900
      9,000                                                              1,268 ICU admissions                                                  800
                                                                            46 deaths
      8,000                                                                                                                                    700
      7,000
                                                                                                                                               600
      6,000
                                                                                                                                               500
      5,000
                                                                                                                                               400
      4,000
                                                                                                                                               300
      3,000
      2,000                                                                                                                                    200
      1,000                                                                                                                                    100
          0                                                                                                                                    0
          Mar 20             May 20             Jul 20            Sep 20             Nov 20            Jan 21            Mar 21

                                               Cases           Hospitalizations           ICU          Deaths

Data in figure as of April 20, 2021
Note: Trend lines reflect 7-day moving averages. Total hospitalizations and ICU admissions include all people in hospital and in ICU on that         1
day. The average length of stay in hospital is approximately two weeks.
Update on COVID-19 in Canada: Epidemiology and Modelling - Canada.ca/coronavirus April 23rd, 2021
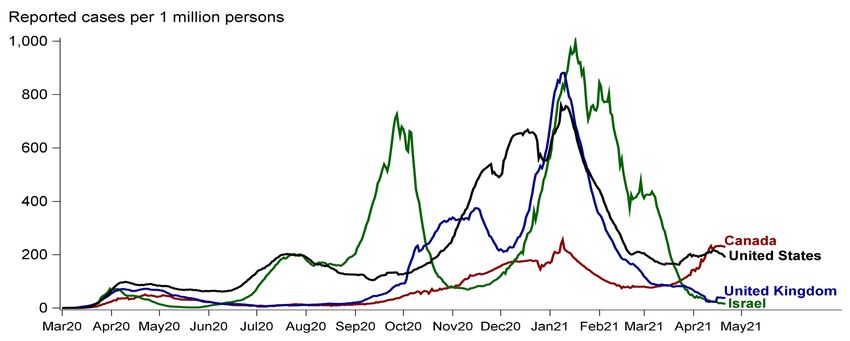
For the first time in many weeks, national Rt has fallen below 1

 2

1.5           When Rt is consistently >1,
              the epidemic is growing

 1

                                                                                    Canada’s Rt is now
Update on COVID-19 in Canada: Epidemiology and Modelling - Canada.ca/coronavirus April 23rd, 2021
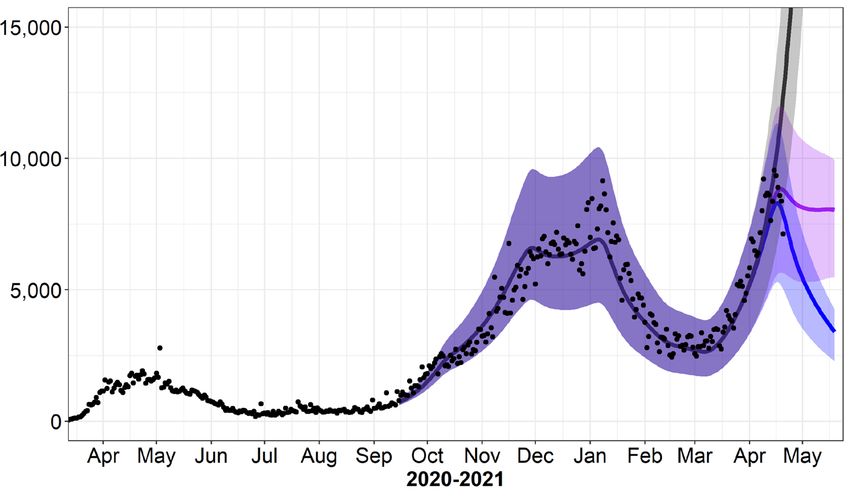
Variants of concern make up more than half of recently reported
    COVID-19 cases in Canada
 Daily number of VOC                                                                              Incomplete data,                               % of cases that
 cases                                                                                           due to reporting lag                              are VOC*
 3,500                                                                                                                                                      100
              140
              120                                                                                                                                                90
 3,000
              100                                                                                                                                                80
 2,500         80
                                                                                                                                                                 70
               60
               40                                                                                                                                                60
 2,000
               20                                                                                                                                                50
 1,500          0
                20 Dec 03 Jan 17 Jan 31 Jan 14 Feb 28 Feb 14 Mar 28 Mar 11 Apr                                                                                   40

 1,000                                                                                                                                                           30
                                                                                                                                                                 20
    500
                                                                                                                                                                 10
       0                                                                                                                                                         0
       18 Dec           01 Jan     15 Jan       29 Jan       12 Feb        26 Feb     12 Mar       26 Mar         09 Apr
         P.1         B.1.351   Lineage not assigned    B.1.1.7    % of all COVID-19 cases with a mutation indicative of a VOC
Data as of April 20, 2021
Note: By laboratory specimen collection date. *Includes cases with confirmed VOC lineage and cases with a mutation indicative of a VOC. VOC cases with no
assigned lineage are reported only by ON and PEI, resulting in underestimation of national number of cases with no assigned lineage. Data from SK are excluded
                                                                                                                                                                      3
from this analysis.
Update on COVID-19 in Canada: Epidemiology and Modelling - Canada.ca/coronavirus April 23rd, 2021
Increase in COVID-19 incidence and severe illness in heavily impacted
   provinces
  Number of cases and
  hospitalizations per
  100,000 population
 40                    BC                     40                 AB                   40                 SK
 30                                           30                                      30
 20                                           20                                      20
 10                                           10                                      10
  0                                            0                                       0
  Apr 20      Aug 20        Dec 20   Apr 21    Apr 20   Aug 20     Dec 20    Apr 21    Apr 20   Aug 20    Dec 20   Apr 21

 40                                           40                                      40
                       MB                     30
                                                                 ON                                      QC
 30                                                                                   30
 20                                           20                                      20
 10                                           10                                      10
  0                                            0                                       0
  Apr 20      Aug 20        Dec 20   Apr 21    Apr 20   Aug 20    Dec 20     Apr 21    Apr 20   Aug 20    Dec 20   Apr 21
                                                    Cases         Hospitalizations
Data as of April 20, 2021
                                                                                                                            4
Update on COVID-19 in Canada: Epidemiology and Modelling - Canada.ca/coronavirus April 23rd, 2021
Steepest rise in hospitalizations observed among those aged 40-59 years
Number of reported                                                                                                              Incomplete data,
hospitalizations                                                                                                               due to reporting lag
  160

   140

   120

   100
                                                                                                                         40 to 59
    80

    60

    40

    20

      0
      Jun 20       Jul 20       Aug 20       Sep 20       Oct 20       Nov 20       Dec 20       Jan 21        Feb 21      Mar 21         Apr 21
                                                                 Date of illness onset*
                                        0 to 19         20 to 39      40 to 59       60 to 79               80+
Data as of April 20, 2021
Note: Trend lines reflect 7-day moving averages. *The earliest of the following dates: Onset date, specimen collection date, laboratory            5
testing date, date reported to province or territory, or date reported to PHAC.
Update on COVID-19 in Canada: Epidemiology and Modelling - Canada.ca/coronavirus April 23rd, 2021
Vaccination coverage is increasing across Canada, with benefits being
  seen in prioritized high-risk populations

                                                                              • 29.9% of Canadian adults
                                                                                have received at least one
                                                                                dose
        72.2%
                      73.7%                                                   • 68.8% of adults in the
                                      57.3%                                     Territories have received at
                                                                                least one dose
                                                                      27.6%

         30.1%                        25.1%
                      27.0%                           33.4%
                              34.1%                                           25.7%
                                              29.1%

                                                                         21.4%
                                                              28.2%

Data as of April 17, 2021
                                                                                                               6
Update on COVID-19 in Canada: Epidemiology and Modelling - Canada.ca/coronavirus April 23rd, 2021
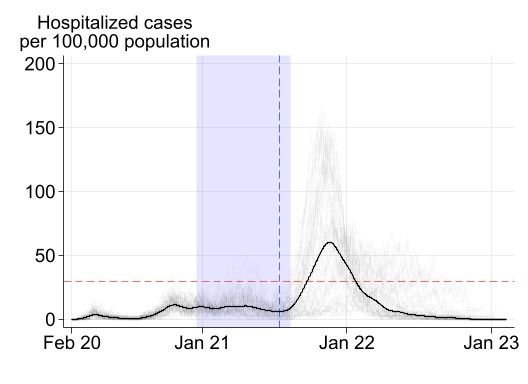
Dramatic decline in incidence rates among adults aged 80 years and older
Number of reported cases                                                                                                      Incomplete data,
 per 100 000 population                                                                                                      due to reporting lag
  35
                                                                                                         80+ years
    30

    25

    20

    15

    10

     5

     0
     Jun 20       Jul 20       Aug 20       Sep 20       Oct 20    Nov 20      Dec 20     Jan 21             Feb 21      Mar 21       Apr 21
                                                               Date of illness onset*
                                         0 to 19         20 to 39      40 to 59       60 to 79               80+

Data as of April 20, 2021
Note: Trend lines reflect 7-day moving averages. *The earliest of the following dates: Onset date, specimen collection date, laboratory         7
testing date, date reported to province or territory, or date reported to PHAC.
Update on COVID-19 in Canada: Epidemiology and Modelling - Canada.ca/coronavirus April 23rd, 2021
Sustaining public health measures as vaccination coverage expands is
  keeping Indigenous communities safer
                                                                                                     Doses administered in
 Active cases in First
                                                                                                         First Nations
 Nations communities
                                                                                                         communities
 6,000                                                                                                             250,000
                                                                                                                  225,000
 5,000
                                                                                                                  200,000
                                                                                                                  175,000
 4,000
                                                                                                                  150,000
 3,000                                                                                                            125,000
                                                                                                                  100,000
 2,000
                                                                                                                  75,000
                                                                                                                  50,000
 1,000
                                                                                                                  25,000
      0                                                                                                           0
      Mar 20     Apr 20 May 20 Jun 20          Jul 20   Aug 20     Oct 20 Nov 20 Dec 20 Jan 21   Feb 21 Mar 21
           Cumulative number of COVID-19 vaccine doses administered (includes 1st and 2nd doses)       Active cases

Data as of April 20, 2021
Note: Data from Indigenous Services Canada. Current week data is incomplete.                                                 8
Update on COVID-19 in Canada: Epidemiology and Modelling - Canada.ca/coronavirus April 23rd, 2021
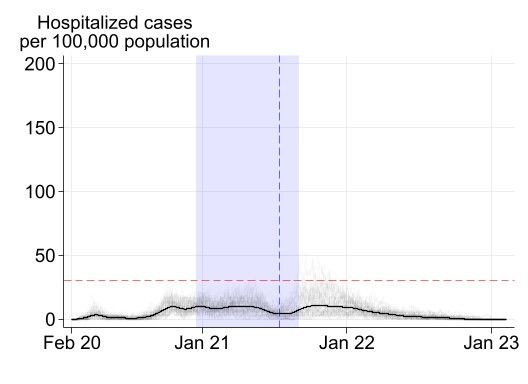
Short-term forecast predicts slower increase in cases, with a slight
                 acceleration in deaths
                                 Cumulative cases predicted to May 2, 2021:                                                Cumulative deaths predicted to May 2, 2021:
                                           1,209,780 to 1,281,040                                                                       24,000 to 24,570
                              1,300,000                                                                                 24,750

                                                                                          Cumulative number of deaths
 Cumulative number of cases

                                                                                                                        24,500
                              1,250,000
                                                                                                                        24,250
                              1,200,000                                                                                 24,000

                              1,150,000                                                                                 23,750

                                                                                                                        23,500
                              1,100,000
                                                                                                                        23,250
                              1,050,000
                                                                                                                        23,000
                              1,000,000                                                                                 22,750
                                      07 Apr 12 Apr 17 Apr 22 Apr 27 Apr 02 May                                              07 Apr   12 Apr   17 Apr   22 Apr   27 Apr   02 May
                                  Cumulatively reported cases in Canada by April 17                                       Cases added since April 17 when the prediction was made
                                  Prediction to May 2                       Lower 95% prediction limit                                           Upper 95% prediction limit
Data as of April 20, 2021
Note: Extrapolation based on recent trends using a forecasting model (with ranges of uncertainty).                                                                                  9
The previous longer-range modelling forecast from March 26th continues
  to play out in the data we are seeing now

                                                                                                                                                *Grey line - with spread
                                                                                                                                                of VOCs and we
                                                                                                                                                maintain the current
                                                                                                                                                number of people we
                                                                                                                                                contact each day

                                                                                                                                                 *Purple line - If VOCs
Reported
                                                                                                                                                 are controlled by
cases
                                                                                                                                                 reducing the current
                                                                                                                                                 number of people we
                                                                                                                                                 contact each day by 20-
                                                                                                                                                 30%
                                                                                                                                                Red points - surveillance
                                                                                                                                                data after the forecast
                                                                                                                                                from March 25th to April
                                                                                                                                                20th

                                                               2020-2021
*Model data as of March 24, 2021. Surveillance data as of April 20, 2021.   It assumes VoC introduced in mid-Dec (~1 week prior to first detected case in Canada) at very low prevalence;
                                                                            VoC is 50% more transmissible than wildtype; growth rates AND replacement rate are negatively correlated
Note: Ensemble of output from PHAC-McMaster and Simon Fraser                with the strength of public health measures. Proportion of VoC is indirectly fitted when calibrating to data.   10
University.                                                                 Recent changes in testing rates are not taken into account in this forecast. SFU methods are at
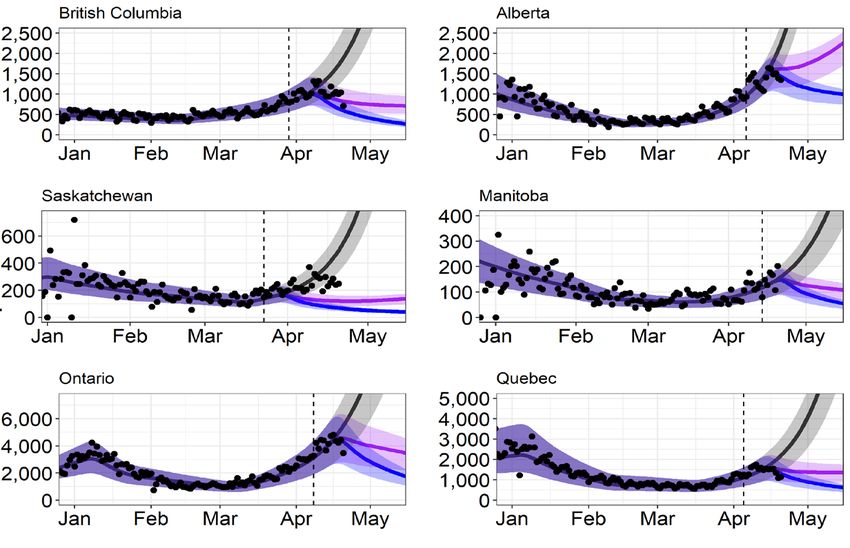
                                                                            https://www.sfu.ca/magpie/blog/variant-simple-proactive.html
Longer-range forecast shows strong measures are required to counter
   more transmissible variants as vaccines continue to roll out
                                                                                                              Without recent changes to
                                                                                                              public health measures.
                                                                                                              Many jurisdictions have
                                                                                                              recently implemented
                                                                                                              measures to prevent this
                                                                                                              trajectory
                                                                                                              Implementation of recent public
Reported                                                                                                      health measures and
cases                                                                                                         adherence to them reduces
                                                                                                              contact between people by
                                                                                                              30%

                                                                                                              Implementation of recent
                                                                                                              public health measures and
                                                                                                              adherence to them reduces
                                                                                                              contact between people by
                                                                                                              40%

 Data as of April 19, 2021
 Note: Model developed by PHAC and McMaster University. Model considers impact of vaccination and increased transmissibility of VOCs,      11
 refer to annex for detailed assumptions on modelling.
International experience shows strong and sustained measures are
  needed to suppress rapid growth of more contagious variants

   Rate per 1,000,000 population

Data as of April 20, 2021
Note: 7-day moving average.                                          12
High uptake of 1st vaccine dose will influence whether it will be safe to lift
  restrictive public health measures this summer
             PLAUSIBLE SAFE LIFTING SCENARIO                                      PLAUSIBLE ALTERNATIVE SCENARIO

     1st dose vaccine uptake is at least 75% among adults                 1st dose vaccine uptake is at least 55% among adults

        OUTCOME: hospital capacity not exceeded                         OUTCOME: hospital capacity widely exceeded in fall 2021
              Hospital capacity           Measures lifted          Median hospitalized cases            Vaccination period

          Physical distancing, mask wearing, and other personal protective measures alongside current levels of testing and
                         tracing would be maintained even when restrictive public health measures are lifted.

Note: In both scenarios, measures are lifted when 20% of the Canadians have received their second dose.                             13
Many factors influence the epidemiological situation and timing for
    adjusting public health measures…

Factors which could allow lifting of                                    Factors which could result in lifting of
restrictive measures SOONER:                                            restrictive measures LATER:

•   Vaccines highly effective                                           •   Vaccines less effective
•   Faster vaccine roll out                                             •   Slower vaccine roll out
•   High vaccine uptake                                                 •   Low vaccine uptake
•   Transmission is controlled                                          •   Transmission not controlled
•   Public health is able to test and trace                             •   Public health unable to test and trace
•   Hospitals and ICUs have enough                                      •   Hospitals and ICUs at risk or unable to
    capacity to meet community needs                                        meet community needs

    When more people are vaccinated, together with continued adherence to public health measures, we
    will get to lower levels of COVID-19, so we will have fewer restrictions to enjoy more activities

                                                                                                                 14
Summer holds promise if we can all keep doing our part

                                                                Chief Medical Officers of Health
Vaccines can help lead us out of this pandemic and we can all
                                                                    rolling up their sleeves
contribute to their success by:                                                                NS

   •   Get vaccinated as soon as it’s your turn
   •   Support others to get vaccinated when it is their turn                                           QC

   •   Keep following public health advice                         CPHO
   •   Keep up with Wash, Mask, Space
                                                                                                            AB

                                                                          Deputy Chief Public Health
                                                                          Officer of Canada

                                                                                                       BC

                                                                    YK
                                                                                                NT

                                                                                                             15
ANNEX

        16
Longer-range forecast shows strong measures are required to counter
   more transmissible variants while vaccines continue to roll out
                                                                                                                 Without recent changes to
                                                                                                                 public health measures.
                                                                                                                 Many jurisdictions have
                                                                                                                 recently implemented
                                                                                                                 measures to prevent this
                                                                                                                 trajectory
                                                                                                                 Implementation and
                                                                                                                 adherence to recent public
Reported                                                                                                         health measures reduces
cases                                                                                                            contact between people by
                                                                                                                 30%
                                                                                                                 Implementation and
                                                                                                                 adherence to recent public
                                                                                                                 health measures reduces
                                                                                                                 contact between people by
                                                                                                                 40%

 Data as of April 19, 2021
 Note: Model developed by PHAC and McMaster University. Model considers impact of vaccination and increased transmissibility of VOCs,    17
 refer to annex for detailed assumptions on modelling.
Longer-range forecasting model assumptions
• The forecast for April 23rd uses a compartmental model reflecting the biology of COVID-19 and public health response developed by PHAC in
  collaboration with McMaster University. It projects the near future given recent incidence of COVID-19 and scenarios for public health measures,
  variants of concern and vaccination.
• The model assumes that VOCs are 50% more transmissible compared to previous strains. This value is used to estimate the rate at which VOCs
  replace existing strains.
• VOCs are considered to have been introduced in mid-December (~1 week prior to first detected case in Canada) at very low prevalence. The
  proportion of cases due to VOCs is indirectly fitted when calibrating to data.
• Changes to public health measures impact the speed with VOCs replace previous strains; stronger public health measures result in slower growth
  and replacement rates.
• Since many jurisdictions have recently strengthened public health measures, and it is too soon to determine the full impacts of these measures, so
  their potential impacts are not yet reflected in the forecast. Recent changes in testing rates are not taken into account either.
• The forecast includes a graph showing the expected increase in cases if public health measures had not recently been strengthened (grey line), one
  that assumes recent changes to public health measures will decrease transmission by 30% (purple line), and one that assumes recent changes to
  public health measures will decrease transmission by 40% (blue line).
• The forecast includes simplified assumptions on vaccine roll-out, including an assumption that vaccinations are 60% effective against infection after
  one dose, a simplified roll-out that does not prioritise by age, and a static vaccination rate. Because only simplified assumptions on vaccine roll-out
  are included, the forecast is limited to 30 days.
• The forecast from March 26th uses a slightly different approach, with the following differences:
   •   It combines the PHAC-McMaster model with a model developed at Simon Fraser University to create an ensemble forecast
   •   The ensemble forecast assumes VOCs are 40-50% more transmissible and includes a graph showing expected increases in cases with VOC spread (grey line), and a
       graph which assumes that transmission (including VOCs) is controlled (purple line) by public health measures that are equivalent to a 20-30% reduction in rates of
       contact between people in Canada
   •   Forecasts are limited to mid-April because assumptions related to vaccination roll-out are not incorporated

                                                                                                                                                                            18
Lifting of restrictive measures modelling assumptions

• Complex models, including a deterministic, age-structured compartment model and an agent-based model, are used to explore
  scenarios for the lifting of restrictive public health measures. These models were initially developed to model measures needed to
  control COVID-19 and have recently been adapted to model the effects of vaccination and transmission of variants of concern.
• Assumptions in the model are either obtained based on current data and knowledge of the transmission of COVID-19 and updated as
  new data and evidence emerge or obtained by fitting the models to surveillance data. Key assumptions informing the scenarios
  presented here include:
   •   VOC were introduced in December 2020 and are 50% more transmissible and 40% more virulent than previous strains, but do not have immune
       breakthrough from vaccines;
   •   The vaccine is 60% effective at preventing infection and 80% effective at preventing hospitalization after one dose, and 92% effective at preventing
       infection and 96% effective at preventing hospitalization after two doses;
   •   Hospital bed capacity in Canada is estimated at 30 per 100,000;
   •   Vaccination roll-out proceed in order of priority groups as recommended by NACI with a 4-month interval between doses starting from March 4, 2021.
       The 4-month delay progressively decreases to the regular 28-day delay by August. The entire vaccination rollout period is Dec 14, 2020 to Sep 5, 2021;
   •   In the scenarios shown, restrictive measures are lifted and not re-imposed once 20% of the eligible population have received their 2nd dose of vaccine
       (which is at the same time point in both scenarios) to show what would happen based on different levels of vaccine acceptance in the population. Until
       then, the epidemic is controlled by a combination of restrictive closures, case detection, isolation, contact tracing and quarantine, and personal
       distancing;
   •   The model assumes 4 weeks after restrictive measures are lifting, the border reopens and the number of imported cases increases from 2 per 100,000
       per week to 12 per 100,000 based on current reduction in travel volume due to border restrictions, imported cases are estimated from the PHAC
       importation model;
   •   Restrictive measures refers to closures of settings such as workplaces/businesses, leisure facilities, and other public settings. Even when these
       measures are lifted, personal distancing by the public and current levels of testing and contact tracing are maintained.
   •   Vaccine acceptance by age group is estimated using data from two Canadian surveys (2020 Canadian Community Health Survey – September 2020)
       and EKOS probability based research panel (January 6-11, 2021). The 75% vaccine acceptance model is the average overall acceptance ranging from
       72% (18-44) to 84.7% (65+). The 55% vaccine acceptance model is the average overall acceptance ranging from 50.4% (18-44) to 59.3% (65+).

                                                                                                                                                            19
You can also read