Detecting, Extracting and Monitoring Surface Water Using Space Technologies - The 4th International Conference on the Use of Space Technology for ...
←
→
Page content transcription
If your browser does not render page correctly, please read the page content below
Detecting, Extracting and Monitoring Surface
Water Using Space Technologies
The 4th International Conference on the Use of Space Technology for Water Management
Islamabad, Pakistan, 27 February 2018

Dr Yun Chen

LAND AND WATER
Outline Overview Detection with Different Sensors Extraction Using Different Methods Spatio-temporal Monitoring Progresses and Challenges
Global Surface Water and Land Changes (1985-2015)

Heat map of global surface water and land changes over the past 30 years, which was
generated using time series of remotely sensed images (The Aqua Monitor - first global-scale
tool at 30-m resolution). The intensity of the colors highlights the spatial magnitude of the
change (from Donchyts et al., 2016).
Published Relevant Research (2000-2017)

Number of published articles (2000-2017) listed in Web of Science Core 106 Collection
containing the terms “surface water” or “flood inundation”, and refined by 107 “remote sensing”
Outline Overview Detection with Different Sensors Extraction Using Different Methods Spatio-temporal Monitoring Progresses and Challenges Concluding Remarks

Commonly Used Space-borne Remote Sensors
Sensor           Satellite         Number       Spatial         Temporal       Swath at     Scale of          Data   Data
group            /sensor           of           resolution      resolution     nadir        application*      cost   availability
                                   bands        (m)             (day)          (km)

Coarse           NOAA/AVHRR        5            1100            0.5            2800         R-G               no     1978--
resolution       MODIS             36           250-1000        0.5            2330         R-G               no     1999--
sensor           Suomi             22           375-750         0.5            3040         R-G               no     2012--
                 NPP-VIIRS

Medium           Landsat           4-9          15-80           16             185          L-G               no     1972--
resolution       SPOT              4-5          2.5-20          26             120          L-R               yes    1986--
sensor           Aster             14           15-90           16             60           L-G               no     1999--
                 Sentinel-2        13           10-60           5              290          L-R               no     2015—

High             IKONOS            5            1-4             1.5-3          11.3         L-R               yes    1999--
resolution       QuickBird         5            0.61-2.24       2.7            16.5         L                 yes    2001--
sensor           WorldView         4-17         0.31-2.40       1-4            17.6         L                 yes    2007--
                 RapidEye          5            5               1-5.5          77           L-R               yes    2008--
                 ZY-3              4            2.1-5.8         5              50           L-R               yes    2012—

*   L=Landscape, R=Regional, G=Global, L-R=Landscape to Regional, L-G=Landscape to Global, R-G=Regional to Global.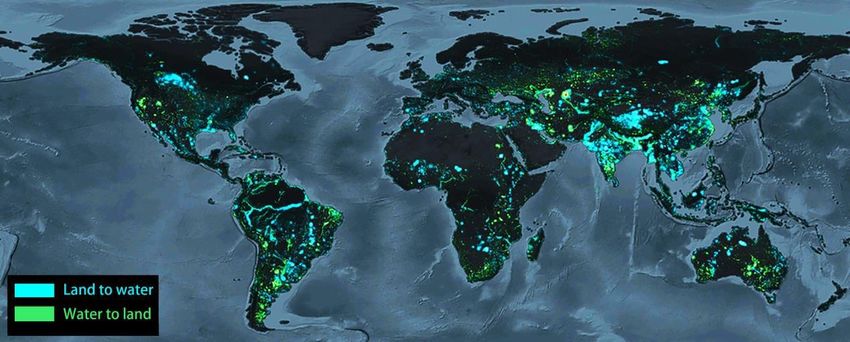
Comparisons of Landsat and Sentinel-2 sensors
                    Thematic                 Enhanced               Enhanced Thematic           Sentinel-2
                    Mapper(TM)               Thematic Mapper        Mapper Plus(ETM+)
                    Landsat 4 and 5          Plus(ETM+)             Landsat 8
                                             Landsat 7
 Spectral           1. 450-520 (B)           1. 450-520             1. 430-450 (C/A)            1. 430-450 (C/A)
 Resolution         2. 520-600 (G)           2. 530-610             2. 450-520 (B)              2. 460-520 (B)
 (nm)               3. 630-690(R)            3. 630-690             3. 530-600 (G)              3. 540-580 (G)
                    4. 760-900 (NIR)         4. 780-900             4. 630-680 (R)              4. 650-680 (R)
                    5. 1550-1750 (MIR)       5. 1550-1750           5. 850-890 (NIR)            5. 700-710 (VRE)
                    6. 2080-2350 (MIR)       6. 2090-2350           6. 1560-1660 (SIR)          6. 730-750 (VRE)
                    7. 1040-1250 (TIR)       7. 10400-12500         7. 2100-2300 (SIR)          7. 770-790 (VRE)
                                             8. 520-900 (Pan)       8. 500-680 (Pan)            8. 780-900 (NIR)
                                                                    9. 1360-1390 (C)            9. 860-880 (NNIR)
                                                                    10. 10300-11300 (LIR)       10. 940-960 (WV)
                                                                    11. 11500-12500(LIR)        11. 1370-1390 (C)
                                                                                                12. 1570-1660 (SIR)
                                                                                                13. 2100-2280 (SIR)
 Spatial            30×30                    15×15 (Pan)            15×15 (Pan)                 10×10 (Pan)
 Resolution         120×120 (TIR)            30×30                  30×30                       20×20
 (m)                                         60×60 (TIR)            100×100 (TIR)               60×60 (TIR)
 Temporal           16                       16                     16                          5
 Resolution
 (revisit days)
 Spatial            185×185                  183×170                185×185                     290×290
 coverage (km)
 Website            https://lta.cr.usgs.go   https://landsat.gsf    https://en.wikipedia.org/   https://en.wikipedia.or
                    v/TM                     c.nasa.gov/the-        wiki/Landsat_8              g/wiki/Sentinel-2
                                             enhanced-
                                             thematic-mapper-
                                             plus/
Note: B=blue, G=green, R=red, C/A=Coastal/Aerosol, NIR=near-infrared, SIR=short-wavelength infrared, MIR =mid-
wavelength infrared, LIR=long-wavelength infrared, TIR=total infrared, Pan=Panchromatic, C=Cirrus, VRE =Vegetation Red
Edge, WV=Water vapour.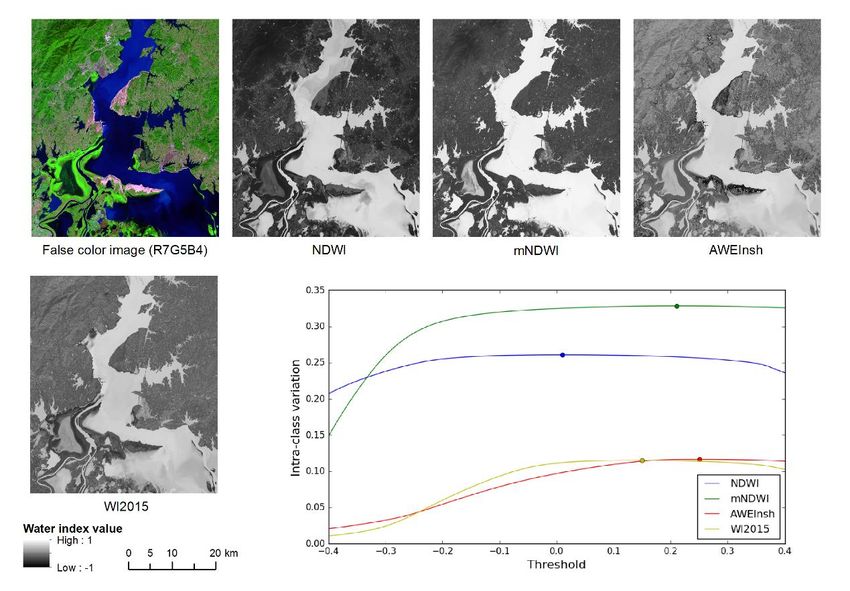
Comparisons of Worldview Series Sensors

Note: PAN=panchromatic, C1=Coastal, A=Aerosol, Y=yellow, B=blue, R=red, G=green, RE=red edge, NIR=near-infrared,
SWIR=short-wavelength infrared, C2=Cirrus, DC=desert clouds, W=Water, S= snow. GSD=Ground sample distance,
Mono= Monaural, CE90=90% of the time, when compared to the true position on the Earth.
Reflectance of Several Typical Land Cover Objects
Popular Water Indices

Indices   Equation                                                     Sources

NDWI      NDWI=(GREEN - NIR)/ (GREEN + NIR)                            McFeeters 1996

mNDWI     mNDWI=(GREEN - SWIR)/ (GREEN + SWIR)                         Xu (2006

AWEI      AWEInsh: 4×(GREEN - SWIR1) - (0.25×NIR + 2.75×SWIR2)         Feyisa et al. (2014)
          AWEIsh: BLUE + 2.5×GREEN - 1.5× (NIR + SWIR1) - 0.25×SWIR2

WI2015    1.7204 + 171×GREEN + 3×RED - 70×NIR - 45×SWIR1 - 71×SWIR2    Fisher et al. (2016)
Thresholding in Using Water Indices Landsat OLI image for Poyang Lake on 2013-10-05, its corresponding images of water indices, and line graph showing the intra-class variation between water and land with different thresholds on these index images
Combined Water Indices
•       Combination of TCW and NDWI
    •     TCW: Tasseled Cap Wetness
    •     NDWI: Normalized Difference Water Index

•       Deference between LSWI and vegetation indices (NDVI and EVI)
    •     LSWI: Land Surface Water Index
    •     NDVI: Normalized Difference Vegetation Index
    •     EVI: Enhanced Vegetation Index
•       Integration of NDWI, mNDWI and AWEI: AMERL
    •     AMERL: Automated Method for Extracting Rivers and Lakes
    •     mNDWI: modified NDWI
    •     AWEI: Automated Water Extraction Index
•       OWL (Open Water Likelihood) index
OWL – Open Water Likelihood
OWL 1 /[1 exp( f )]
5
f a0 ai * xi
i 1
a0 = -3.41375620, x1 = SWIR band 6,
a1 = -0.959735270, x2 = SWIR band 7,
a2 = 0.00417955330, x3 = NDVI (NDVI = (band2-band1)/(band2+band1)),
a3 = 14.1927990, x4 = NDWI (NDWI = (band2-band6)/(band2+band6)),
a4 = -0.430407140, x5 = MrVBF (an index derived from DEM indicating the degree
a5 = -0.0961932990, of valley bottom flatnessTimeline Diagram of Major Water Indices and Satellites
Spatio-temporal Monitoring
                             A study used time series of
                             MODIS data to assess the
                             surface water area of
                             Poyang Lake from 2000 to
                             2010, and found that the
                             Lake had been extremely
                             variable over the 11-year
                             period.

                             Inundation extent for each
                             calendar year between
                             2000 and 2010. The two
                             extreme inundation states
                             are presented in the last
                             panel (annotated as
                             “2000–2010”)
                             (from Feng et al. , 2012)
Spatio-temporal Monitoring
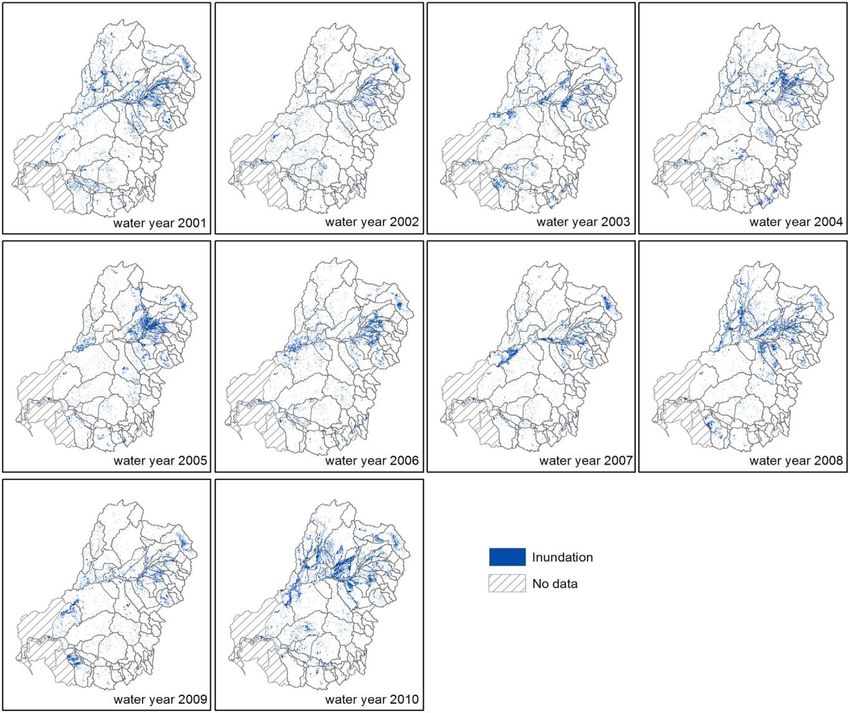
Annual maximum inundation maps of
Murray-Darling Basin, Australia, showing
the max. inundated area of each water year
defined as from July 1 of the preceding year
to June 30 of the current year (2001-2010).Spatio-temporal Monitoring
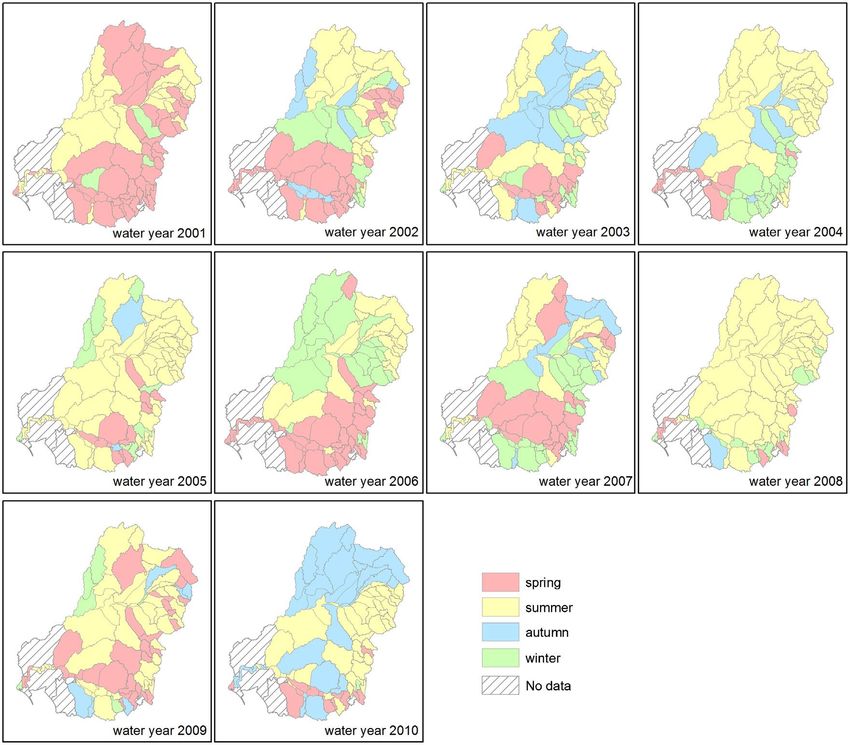
Inundation seasonality maps of Murray-
Darling Basin developed from the date of
flow peaks for each water year between
2001 and 2010.Progresses and Challenges Spatial and temporal scale issue • Pixcel unmixing and reconstruction • Spatial and temporal fusion Integration with in situ gauge data • Combination of in situ gauge data • Estimating gauge flow using remote sensing Dependency of terrain • Digital Elevation Model: sub-pixel mapping • Lidar DEM: water depth Global water monitoring • New satellite sensors • BIG data & Cloud platform • Google Earth Engine (GEE) and Data Cube
Spatial and temporal scale issue – pixel unmixing & reconstruction

Demonstration of pixel unmixing and reconstruction process (comparied with hard classification)
Spatial and temporal scale issue – spatial & temporal fusion

     (a) Evaluation map of index-then-blend (IB) result. (b) Evaluation map
     of blend-then-index (BI) result (reprinted from Huang et al. 2016).
Integration with in situ gauge data – Combination of gauge data
(a) Observed flow at the upstream
gauge and inundation area
derived from time-series MODIS
images during a flood event in
Narran floodplain in Murray-
Darling Basin (MDB), Australia.
(b) Modeled flood inundation
probability for MDB based on time
series MODIS data and time
series observed flow data.Dependency of terrain – DEM-based subpixel mapping Chowilla Floodplain of the Murray–Darling Basin of Australia (a section of the main channel of the Murray River and its tributaries, including Lake Victoria): (a) Evaluation map of the original PS (Pixel-swapping) algorithm; (b) evaluation map of the LPS (Linearised PS) algorithm; (c) evaluation map of the DMPS (DEM- based Modified PS) algorithm.
Dependency of terrain – water depth derivation from Lidar DEM

In a section of floodplain in Lower Murrumbidgee in Murray-Darling Basin,
Australia, (a) Modeled commence-to-fill volumes, (b) modeled water depth under
the scenario that the observed gauge flow is 26 GL/day. (figure produced from the
published dataset of Sims et al. 2014)
Remarks
• The last decade has been a golden period for optical remote sensing
  applications, largely due to the stable performance of MODIS and
  Landsat sensors, as well as the free distribution policy of their data.
• Many studies have been conducted using these data to detect,
  extract and monitor surface water bodies. The results have greatly
  supported research work in many related fields, such as water
  resource management eco-hydrological studies.
• A most serious limitation is that optical remote sensing data are
  easily affected by cloud cover. Therefore, solely relying on optical
  images is not wise. It is better to introduce other data sources, such
  as SAR. An integrated use of optical and radar satellite data will
  certainly improve the ability to detect and monitor surface water.
Global water monitoring – new satellite sensors

Satellite Name:              Surface Water and Ocean Topography (SWOT)
Launch Year:                 2021
Purpose:                     Survey of global surface water (extent and storage),
Spectral Resolution (nm):    395-740 (Pan); 750-1040 (NIR)
Spatial Resolution (m):      3×2.8×2.8 (Land water); 5×10.6×1.5 (Ocean)
Temporal Resolution (day):   22
Spatial Coverage (km2):      120 x120
Altitude (km):               727
Website:                     https://swot.jpl.nasa.gov/home.htm
Global water monitoring – Google Earth Engine

A more detailed and comprehensive global surface water map and its long-term change derived by Pekel et al. (2016)
through analyzing on three million Landsat images collected over the past 32 years using the Google Earth Engine
platform. The figure shows the Sacramento Valley, one of the major rice-growing regions in the USA, extracted from the
global data set (figure reprinted from Pekel et al. 2016):
a) Map of the USA showing Sacramento Valley location (red square). b) Surface water occurrence 1984–2015.
c) Surface water occurrence change intensity 1984–2015. d) Surface water recurrence 1984–2015.
e) Surface water seasonality 2014–2015. f) Transitions in surface water class 1984–2015.
The Australian and International Datacube
- CSIRO- Geoscience Australia- National
  Computational Infrastructure initiative for enabling
  the use of big data Earth Observation

Slides courtesy Stuart Minchin, Geoscience Australia

Earth Observation for agriculture and rangelands monitoring | Juan Guerschman
Satellite Data Trends
• More and more free and open
  data
• Growing data volumes
• Improved computing
  technologies
• Open source software
• Pre-processed products
What are Data Cubes?
• Data Cube = Time-series multi-dimensional
  (space, time, data type) stack of spatially aligned
  pixels ready for analysis
• Proven concept by Geoscience Australia (GA) and
  the CSIRO and planned for the future USGS
  Landsat archive.
• Analysis Ready Data (ARD) ... Dependent on
  processed products to reduce processing burden
  on users
• Open source software approach allows free
  access, promotes expanded capabilities, and
  increases data usage.
• Unique features: exploits time series, increases      TIME
  data interoperability, and supports many new
  applications.
Developing the Australian Geoscience Data Cube
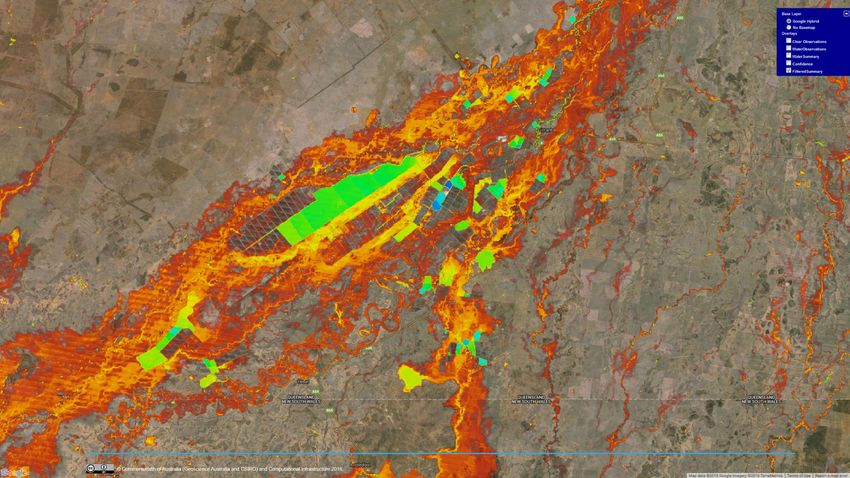
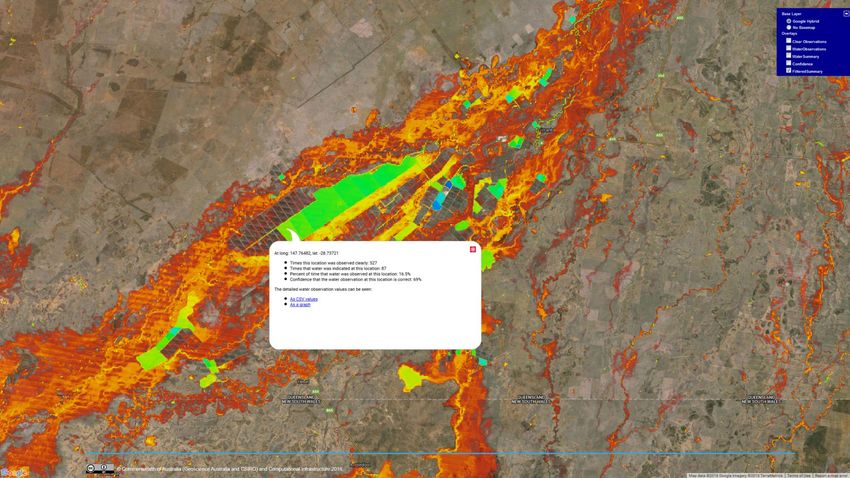
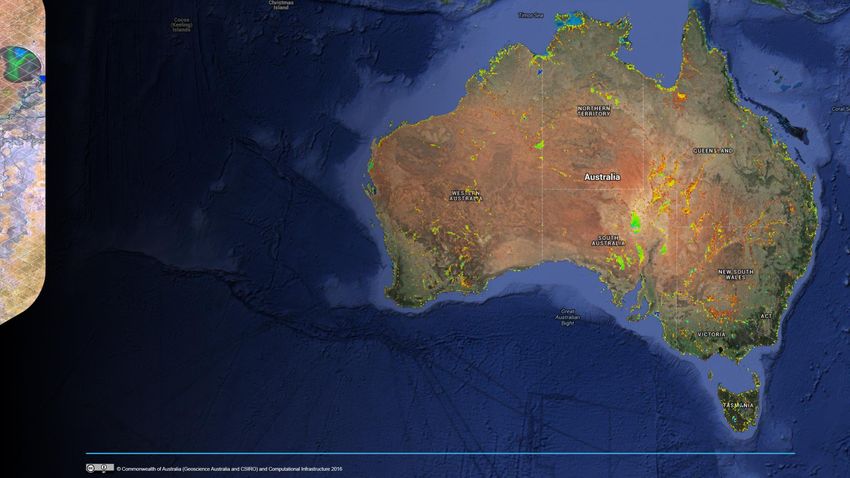
Continental Scale
Water Observations from Space
Cubbie Station:
floodplain water storages

                            Potential use for
                            SDG #2; SDG #6:
Cubbie Station: floodplain water storages
Water quality monitoring:
 Lake Burley Griffin

Potential use for
SDG #6:
Potential use for
                               SDG #2; SDG #6:
Tracking agricultural change
OpenDataCube.org: Growing a Network of Compatible Open DataCubes
AWS Demo
Fully Operational
Under Development
Planning Phase
Expression of Interest How best to service the EO Data Needs
For SDG Indicator Baselines and Monitoring ?CSIRO Land and Water
Dr Yun Chen
Senior Research Scientist
t +61 2 6246 5729
Thank you
E yun.chen@csiro.au
w www.csiro.au
CSIRO LAND AND WATERYou can also read