AZRIELI GROUP Investing in the Data Centers Industry - July 18, 2019

Page created by Annie Benson
 
CONTINUE READING
AZRIELI GROUP Investing in the Data Centers Industry - July 18, 2019
AZRIELI GROUP
Investing in the Data Centers Industry

July 18, 2019
AZRIELI GROUP Investing in the Data Centers Industry - July 18, 2019
Disclaimer

 The information included in this presentation is merely a summary. It does not exhaust all the information about the Company
  and/or Compass Datacenters LLC (“Compass”) and their business, and it is not a substitute for inspection of the Company’s
  periodic and immediate reports, as filed and to be filed with the Israel Securities Authority via the Magna distribution site. The
  presentation is not an offer or invitation to purchase securities of the Company and/or of any other corporation, nor is it a
  recommendation or option or any substitute for the investor’s discretion. In any case of discrepancy or inconsistency between
  the information in this presentation and the information in the Company’s reports on Magna, the information in the reports
  shall prevail.
 This presentation includes forecasts, objectives, assessments, estimates and other information relating to future matters
  and/or events whose materialization is uncertain and which lie beyond the Company’s control, and constitute forward-looking
  information, as defined in the Securities Law, 5728-1968. Such information (which includes, inter alia, forecasts of output,
  NOI, EBITDA, yields and projected leverage) may not materialize, in whole or in part, or may materialize in a materially different
  manner than projected. The above information is based solely on the subjective assessment of the company, based on facts
  and figures regarding the current state of Compass’ business and macroeconomic facts and figures, all as known to Compass at
  the time of preparation of this presentation. The materialization or non-materialization of the forward-looking information will
  be affected, inter alia, by risk factors that characterize Compass’ business, as well as developments in the economic
  environment, market conditions and external factors that affect its business, including a delay in the completion of sites under
  construction and development, termination of contracts, changes in the competition conditions, a significant recession, change
  in the financing conditions, and other such events which cannot be assessed in advance and which are beyond Compass’
  control. The Company does not undertake to update and/or change any such forecast and/or assessment to reflect events
  and/or circumstances occurring after the date of this presentation.
 This presentation includes information about the Data Centers market and other information that is based on external sources
  and various studies and surveys, which were not independently checked by the Company. Keep in mind that past results are
  not necessarily an indication of future performance.
 The financial information about the Compass deal takes into account another acquisition of business by Compass, closing of
  which is expected by the end of July 2019.

                                                                                                                                 2
AZRIELI GROUP Investing in the Data Centers Industry - July 18, 2019
Azrieli Group // Opportunity in the Data Centers industry

   The Group made a decision to enter the global Data Centers industry

   The board of directors and management of the Group believe that the industry fits the Group’s
    investment strategy

   One of the world’s fastest growing income-producing property markets

   The tenants are among the world’s leading companies

   The Group has been thoroughly studying the market for about two years

   A decision was made to enter the field according to the outline specified below, consisting
    primarily of:

      An investment in equity, with an option to increase the holdings, in a platform with
      significant future development and enterprise potential

                                                                                                  3
AZRIELI GROUP Investing in the Data Centers Industry - July 18, 2019
What is an Azrieli Group growth engine

          Core business activity – income-producing property

               A sizeable, significant and growing industry

         A field with potential to become a significant operating
                          segment for the Group

                            Attractive yields

       An industry that combines enterprise with an advantage for
                           financial strength

                                                                    4
AZRIELI GROUP Investing in the Data Centers Industry - July 18, 2019
The Global Data Centers Market
AZRIELI GROUP Investing in the Data Centers Industry - July 18, 2019
Data storage development

                        Now                                  The early 2000s                   The 1990s
        Projected increase in                             Sharp growth in number of     Increase in the scope of use of
    consumption of online content                               internet users           “server-client” IT architecture
                                                                                             in large organizations
          Monthly online information
                                (1)                        Internet users worldwide,
              traffic, ExaBytes
                                                                   in billions

                                                                                  4
                                              278
                                     228
                             186
                     151                                               2
            122
     96

                                                           0.4

   2016 2017 2018 2019 2020 2021                          2000       2010        2018

(1) 1 Exabyte = 1 Million TeraByte = 1 Billion GigaByte
(2) Source: Clipperton Finance, Cisco
                                                                                                                     6
Data Centers // Opportunity in the Global Market (1)
   The global market is estimated to generate annual revenues of approx. $91 billion.

   By 2022, the market is expected to grow at an average annual pace of approx. 35%, totaling annual
    revenues of approx. $307 billion.

   The U.S.A. is positioned as the global market leader: About 60% of the data centers capacity is located
    North America, 20% in Asia-Pacific, and 13% in Europe.

   The market growth is led by the global cloud companies, and is driven mainly by the growth of the data
    industry by both business and private entities.

          Global DC market breakdown (% in MW)                                                  Industry growth factors
                                2%                                                     Cloud
                                                              United States
                20%                                           Canada                   AI
                                                                              )2(
                                                              Major Europe
                                                              Other Europe             IoT (Internet of Things)                                           $137
                                                              APAC
                                                                                                                                                     $99
          1%                                                  LATAM
                                                                                       Augmented reality                         $47
                                                                                                                                          $69

                                                                                                                    $23   $32

          12%
                                                                                       5G networks
                                                        61%                                                        2015A 2016A 2017A 2018E 2019E 2020E

                                                                                       Smart transportation                    Public Cloud ($bn)

                3%
                                                                                       Crypto Currencies
(1) Source of data: CMA Strategy Consulting, RBC, Structure Research
(2) UK, Germany, France, Ireland, the Netherlands
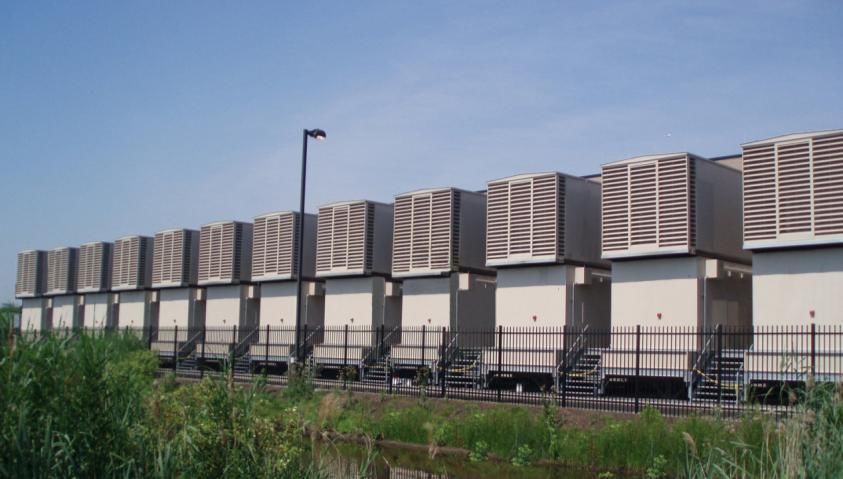
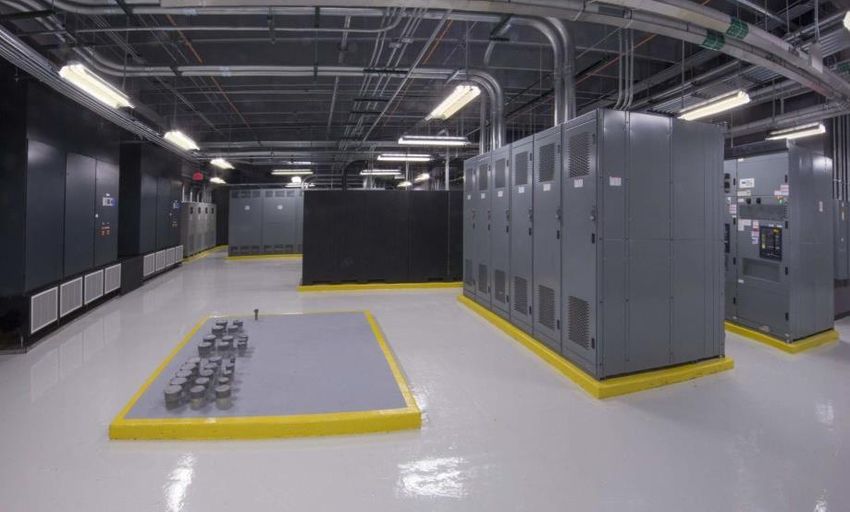
                                                                                                                                                           7
Data Centers // Characteristics

     Main characteristics                                  Tenants and Leases
   Income-producing real estate, a building housing      Lease is based on power units rather than area
    computers and servers of companies of various          units
    types
                                                          Measurement unit: KW
   Includes hardware for processing, storage,
                                                          Types of tenants:
    switches, etc.
                                                           –   Hyperscale (>5 MW)
   High-standard security requirements, very high
                                                           –   Wholesale (300 KW – 5MW)
    redundancy in terms of power, latency, systems,
    control and safety                                     –   Retail (Multi Tenants) (
Data Centers // Customer breakdown

                    Types of customers

   Hyperscale -Wholesale                 Retail

                                                  9
Data Centers //
   The Changes and Expected Growth in the Market
     Growth in the number of Hyperscale Data Centers                                                             Main drivers for increasing demand for
                                                                                53%                                       Outsourced services
                                                                 48%
                                                  44%                                                 Assists companies in focusing on their core business
                                       38%
                         32%
           27%                                                                                        Increase in costs and complexity of in-house DC
                                                                  570           628                    management increases attractiveness of outsourcing
                                                   509
                                        448
            338           386
                                                                                                      More companies will “lease” comprehensive IT services
                                                                                                       from cloud providers, and transfer the task of building and
           2015A        2016A         2017A       2018E         2019E          2020E                   maintaining their IT infrastructure to a limited group of
             # of Hyperscale Data Centres        % Share of Data Centre Servers (Installed Base)       specialist experts.

      The U.S. market is shifting to outsourcing solutions                                             Key North American markets in terms of capacity
                                   CAGR )2013-2023):                                                                 and development
                                 Service providers: +24%
                                                                                                                         2019       2022                          2019   2022
                                Internal Data Centers: -10%
                                                                                                                      Critical MW Critical MW 3-YR CAGR   MW/YR   Rank   Rank
         2013                                                                     2019             Northern VA          1,393       1,946      11.8%       184     1      1
                                                                                                   Dallas                693        826        6.0%        44      2      2
                                                                                                   Las Vegas & Reno      593        659        3.6%        22      3      4
               12%
                                                                                                   Chicago               573        714        7.6%        47      4      3
                                                                                                   Silicon Valley        519        651        7.8%        44      5      5
                                                                                                   New Jersey            516        580        4.0%        21      6      6
                                                           45%
                                                                                                   Houston               383        424        3.4%        13      7      10
                                                                                         55%
                                                                                                   Atlanta               376        460        6.9%        28      8      7
                                                                                                   Los Angeles           374        427        4.5%        18      9      9

                          88%                                                                      Seattle               325        363        3.8%        13      10     11
                                                                                                   Phoenix               317        441        11.6%       41      11     8
     Internal Data Centers                  Service Providers                                      New York              295        320        2.8%         8      12     12

(1) Source: CMA Strategy Consulting, RBC
(2) Source: Industry Research, Cisco Global Cloud Index: Forecast and Methodology, Statista, Gartner, BI Intelligence
(3) Source: IDC, Worldwide Datacenter Installation Census and Construction Forecast, 2019–2023, Doc #US43797219 , Apr 2019
                                                                                                                                                                         10
The analysis includes datacenters only (without server closet and server rooms)
Data Centers // U.S. capacity increase forecast
                                          The forecast includes the deployment of Retail Colocation
                                                (
Data Centers // The Global revenues development forecast
Hyperscale cloud providers rely increasingly on third-party wholesale providers to develop their capacity to support growth
                         Outsourced Infrastructure Global Forecast                                Total Infrastructure Forecast Mix
        ($ in Bns)
                             Hyperscale               Retail            Wholesale                                                              2017
                                                                                                                      8%      6%

                                                                                    $306.8                                  9%

                                                                                     24.4

                                                                                     58.0                     77%
                                                                           $223.8
                                                                            20.3
                                                                                             Colocation                    Hyperscale/ Cloud
                                                               $164.7       50.5             Managed Infrastructure        On-Premise
                                                                16.9
                                            $122.2
                                                                43.9
                                                                                                                                               2022E
                                              14.0                                  224.4
                             $91.5                                                                                    12%
              $69.5           11.6            38.0
                                                                           153.0
                9.8           33.1
               28.9                                            103.9                                      43%
                                              70.2
                              46.8                                                                                            34%
               30.8

               2017          2018E           2019E             2020E       2021E    2022E
                                                                                                                11%
         % Growth             32%             34%               35%         36%      37%
                                                                                             Colocation                     Hyperscale/Cloud

                                                                                             Managed Infrastructure         On-Premise
(1) Source of data: Wall Street Research, Structure Research, RBC
                                                                                                                                                      12
Data Centers // U.S. Market Characteristics

                                                                            Retail                                        Hyperscale / Wholesale

                        Customers                               Medium-sized businesses                           Large cloud service providers,
                                                                  – banks, airlines, etc.                        communication companies, etc.

                           Rent(2)                                                                                Hyperscale: US$ 90-120 kW/Month
                                                                     US$ 150-250 kW/Month
                                                                                                                  Wholesale: US$ 110-140 kW/Month

                        Duration of
                         contracts                                              1-3 years                                         5-10 years

                      Yield-on-cost (2)                                      10%-20%                                               8%-12%

(1) Source of data: CMA Strategy Consulting, RBC
(2) Gross modified. According to the company’s and CMA’s assessment, the cost of construction of 1MW is in the range of $6-8 million.
                                                                                                                                               13
The Compass Deal
Azrieli Group // The Go To Market Approach

                                                                      Local partner

                             A reasonably-priced active platform & experienced
                                              management (1)

                                Existing and future operations in the Wholesale/
                                              Hyperscale segment

                      Developing a significant installed base in a mature market

                                              Land and development pipeline
                                          in attractive locations for future growth

                                 Long term (Steady State) leverage of 50%-60%
(1) The importance of relationships and acquaintance with key customers, mainly in the Hyperscale and Wholesale markets
                                                                                                                          15
Azrieli Group // Compass Deal
Description of the Company
   10 active sites, 3 sites under construction and development

   Active mainly in the central-eastern U.S and in Canada in the Montreal region.

   The Company’s management is experienced in the development and establishment of data centers and
    relationships with strategic customers.

   The DCs are located close to power lines and high voltage and fiber line infrastructure.

                                           Data centers in the U.S.A. and Canada
                                                                                                Montreal
                                                                                              (2 Facilities)

                                                                  Minneapolis
                                                                  (2 Facilities)

                                                                                                    Northern Virginia
                                                                                                     (Campus Build)
                                                                                     Nashville
                                               Phoenix                Tulsa
                                                                                   (2 Facilities)
                                            (Campus Build)         (1 Facility)

                                                                Dallas                                 Raleigh
                                                             (2 Facilities)                          (1 Facility)
         3 Hyperscale Deployments
         8 Stabilized Campuses
                                                                    Dallas Fort Worth
         2 Facilities in Montreal Canada                             (Campus Build)

                                                                                                                        16
Azrieli Group // Compass Deal
     The partners
    Ontario Teachers’ Pension Plan– Ontario teachers’ pension fund, one of Canada’s largest institutional investors

    RedBird Capital Partners - Investments are focused on communications infrastructure, sports & hospitality,
     energy, and financial services.

    Compass management – decades of experience in the initiation and management of Data Centers.

     Ownership structure

                                   July 2019                                                                      Expected Dec. 2020

                                            19.5%)1(                                                                        33%
                                                                                                                               )1(

                          54.5%
                                                  23.7%
                                                                                          Management

                Management
                                           2.3%
(1) Option to increase holdings up to 33% according to current value against future investments in development.
                                                                                                                                       17
Azrieli Group // Compass Deal

                                                     Current income-                    Duration of         Future development
       NOI for 100%                                  producing output                existing contracts          potential

                                                                                         ~7 years               ~ 560MW
        $ 38 Million                                     ~30MW
                                                                                         Average                 Potential
        Current(1) NOI                                   Current
         Annualized
                                                                                        lease term             output in the
                                                         output                                                 long term

     Management
    Compass management – decades of experience in the initiation and management of server farms.
           CEO              Finance                Sales           Strategy & operations Construction

             Chris Crosby                    Jared Day             Raymond Hawkins          Adil Attlassy       Nancy Novak
            Founder & CEO                 President & CFO               CRO                     CTO            SVP construction
            25+ years of                   20+ years of             30+ years of           30+ years of         30+ years of
             experience                     experience               experience             experience           experience
                     Proferian
                                                                                                                   Construction
                                                                                                                    Executive
(1) Included signed but not yet closed agreements.
                                                                                                                                  18
Azrieli Group // Compass Deal
                                                                Compass’s facilities
            3 Hyperscale(1) facilities under
                                                                                               10 Active facilities
                            development(2)
                           Current                                    Additional short-term        Total potential output in
                       producing output                                 output pipeline            acquired assets and land

                              ~30MW                                             ~ 120MW                   ~ 560MW

                                          Projected leverage                        Existing debt in acquired company

                                               40%-50%                                       $ 201 Million
                                           projects in pipeline                                net debt

(1) For Large cloud companies.
(2) The time tables, actual size and marketing of the projects are uncertain.
                                                                                                                               19
Summary // Trends in the Data Centers Market

         Cloud development causes businesses to opt for intensive hardware
                                  outsourcing

        Consequently, the Data Centers market is growing at a high pace, and
             presents an opportunity to develop a new growth engine

        The data revolution has created a reality where Data Storage and Data
                 Processing are growing at increased speed and size

       The yields in the Data Centers market are considerably higher than other
                             traditional real estate sectors

         “Stickiness” – Due to the sensitivity and materiality of the matter,
       companies tend not to make frequent changes in their server farms and
            databases, leading to long-term contracts and little turnover

                                                                                  20
21
Summary // An Opportunity for Azrieli Group

                A new and growing business segment

          Income-producing real estate with attractive yields

                Consistent with the Group’s strategy –
                      real estate development

            A growth engine in a significant global market

               Significant potential operating segment

                                                                22
Thank you
You can also read